Matplotlib Axis Title
In Matplotlib, axis titles are used to label the axes of a plot to indicate the quantity being represented. Axis titles play a crucial role in helping viewers understand the data being presented in a plot. In this article, we will explore how to add axis titles to plots in Matplotlib.
Setting X and Y Axis Titles
To set the title for the X and Y axes in a Matplotlib plot, we can use the set_xlabel() and set_ylabel() methods.
import matplotlib.pyplot as plt

x = [1, 2, 3, 4, 5]
y = [10, 20, 15, 25, 30]

plt.plot(x, y)
plt.xlabel('X-axis Label how2matplotlib.com')
plt.ylabel('Y-axis Label how2matplotlib.com')
plt.show()
Output:
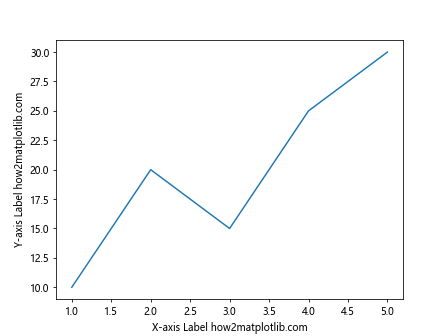
In the code snippet above, we have created a simple line plot with x and y coordinates. We have set the X-axis label using set_xlabel() and Y-axis label using set_ylabel().
Rotating Axis Labels
If you want to rotate the axis labels for better readability, you can use the rotation parameter in the set_xlabel() and set_ylabel() methods.
import matplotlib.pyplot as plt

x = [1, 2, 3, 4, 5]
y = [10, 20, 15, 25, 30]

plt.plot(x, y)
plt.xlabel('X-axis Label how2matplotlib.com', rotation=45)
plt.ylabel('Y-axis Label how2matplotlib.com', rotation=45)
plt.show()
Output:
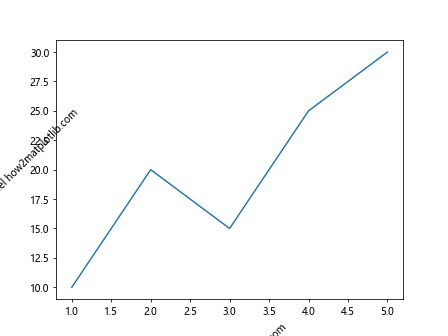
By setting the rotation parameter to the angle at which you want to rotate the labels (in degrees), you can adjust the orientation of the axis labels.
Customizing Axis Titles
You can customize the font size and font weight of the axis titles using the fontsize and fontweight parameters.
import matplotlib.pyplot as plt

x = [1, 2, 3, 4, 5]
y = [10, 20, 15, 25, 30]

plt.plot(x, y)
plt.xlabel('X-axis Label how2matplotlib.com', fontsize=14, fontweight='bold')
plt.ylabel('Y-axis Label how2matplotlib.com', fontsize=14, fontweight='bold')
plt.show()
Output:
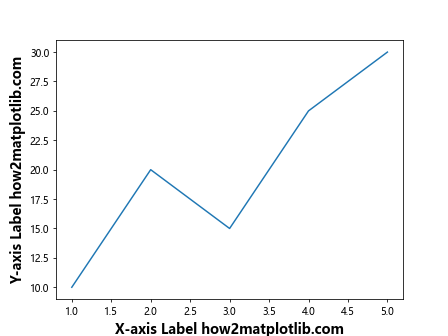
In the code snippet above, we have set the font size to 14 points and the font weight to ‘bold’ for both the X and Y axis labels.
Adding a Title to the Axes
In addition to the axis labels, you can also add a title to the X and Y axes using the set_title() method.
import matplotlib.pyplot as plt

x = [1, 2, 3, 4, 5]
y = [10, 20, 15, 25, 30]

plt.plot(x, y)
plt.xlabel('X-axis Label how2matplotlib.com')
plt.ylabel('Y-axis Label how2matplotlib.com')
plt.title('Plot Title how2matplotlib.com')
plt.show()
Output:
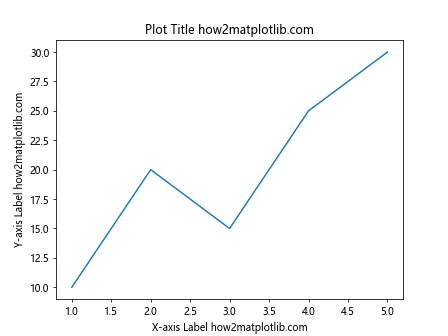
By using the set_title() method, you can provide a descriptive title for the plot, which can help viewers quickly grasp the context of the data being presented.
Adjusting the Axis Title Position
You can adjust the position of the axis titles by setting the labelpad parameter in the set_xlabel() and set_ylabel() methods.
import matplotlib.pyplot as plt

x = [1, 2, 3, 4, 5]
y = [10, 20, 15, 25, 30]

plt.plot(x, y)
plt.xlabel('X-axis Label how2matplotlib.com', labelpad=20)
plt.ylabel('Y-axis Label how2matplotlib.com', labelpad=20)
plt.show()
Output:
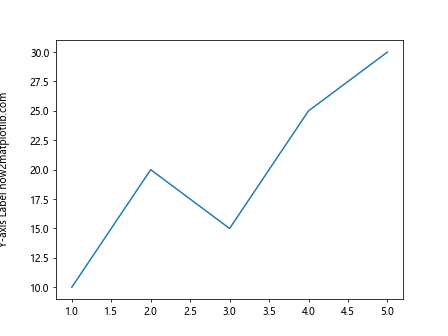
By adjusting the value of the labelpad parameter, you can control the distance between the axis labels and the respective axes.
Adding Units to Axis Titles
If you want to add units to the axis labels, you can simply include the unit within the label strings.
import matplotlib.pyplot as plt

x = [1, 2, 3, 4, 5]
y = [10, 20, 15, 25, 30]

plt.plot(x, y)
plt.xlabel('Time (s) how2matplotlib.com')
plt.ylabel('Temperature (°C) how2matplotlib.com')
plt.show()
Output:
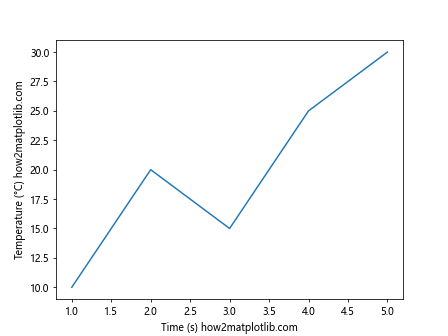
In the code snippet above, we have added ‘s’ for seconds and ‘°C’ for degrees Celsius to the X and Y axes labels, respectively.
Adding Mathematical Symbols to Axis Titles
To add mathematical symbols to the axis labels, you can use LaTeX notation within the label strings.
import matplotlib.pyplot as plt

x = [1, 2, 3, 4, 5]
y = [10, 20, 15, 25, 30]

plt.plot(x, y)
plt.xlabel('$\Delta$x how2matplotlib.com')
plt.ylabel('$\Delta$y how2matplotlib.com')
plt.show()
By enclosing the mathematical symbols within ‘$’ symbols, you can render them properly in the axis labels.
Adjusting Axis Label Alignment
You can control the alignment of the axis labels using the horizontalalignment and verticalalignment parameters in the set_xlabel() and set_ylabel() methods.
import matplotlib.pyplot as plt

x = [1, 2, 3, 4, 5]
y = [10, 20, 15, 25, 30]

plt.plot(x, y)
plt.xlabel('X-axis Label how2matplotlib.com', horizontalalignment='right', verticalalignment='top')
plt.ylabel('Y-axis Label how2matplotlib.com', horizontalalignment='right', verticalalignment='top')
plt.show()
Output:
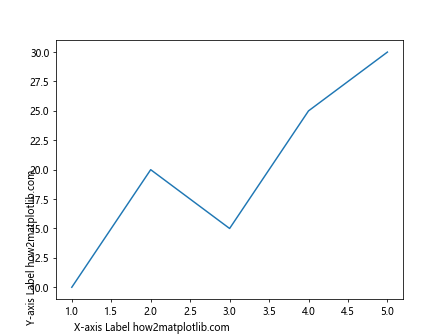
By setting the horizontalalignment and verticalalignment parameters to the desired values (‘left’, ‘center’, or ‘right’ for horizontal alignment, and ‘top’, ‘center’, or ‘bottom’ for vertical alignment), you can adjust the alignment of the axis labels.
Adding Multiple Lines to Axis Titles
If you need to include multiple lines in the axis titles, you can use the newline character ‘\n’ within the label strings.
import matplotlib.pyplot as plt

x = [1, 2, 3, 4, 5]
y = [10, 20, 15, 25, 30]

plt.plot(x, y)
plt.xlabel('X-axis\nLabel how2matplotlib.com')
plt.ylabel('Y-axis\nLabel how2matplotlib.com')
plt.show()
Output:
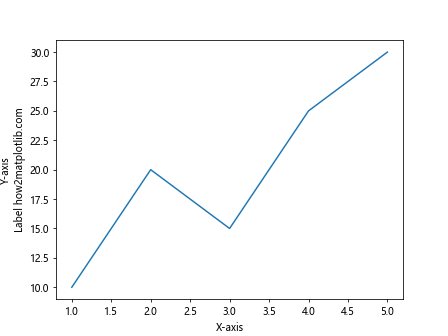
By adding ‘\n’ in the label strings, you can create line breaks in the axis labels to display information on multiple lines.
Controlling Axis Label Font Color
You can customize the font color of the axis labels using the color parameter in the set_xlabel() and set_ylabel() methods.
import matplotlib.pyplot as plt

x = [1, 2, 3, 4, 5]
y = [10, 20, 15, 25, 30]

plt.plot(x, y)
plt.xlabel('X-axis Label how2matplotlib.com', color='blue')
plt.ylabel('Y-axis Label how2matplotlib.com', color='red')
plt.show()
Output:
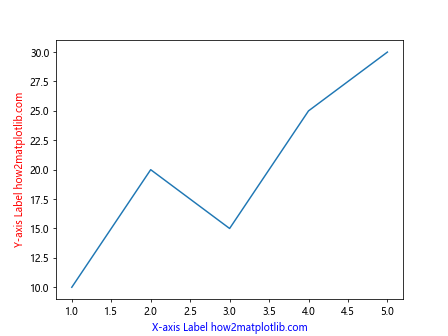
By setting the color parameter to a specific color name or hexadecimal code, you can change the font color of the axis labels.
Changing Axis Label Font Style
You can adjust the font style of the axis labels using the fontstyle parameter in the set_xlabel() and set_ylabel() methods.
import matplotlib.pyplot as plt

x = [1, 2, 3, 4, 5]
y = [10, 20, 15, 25, 30]

plt.plot(x, y)
plt.xlabel('X-axis Label how2matplotlib.com', fontstyle='italic')
plt.ylabel('Y-axis Label how2matplotlib.com', fontstyle='normal')
plt.show()
Output:
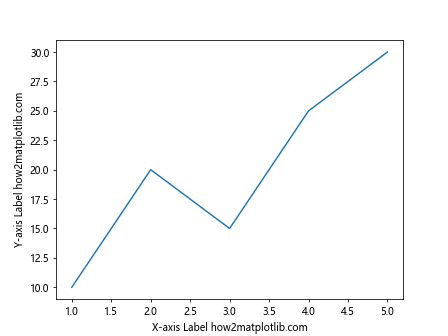
By setting the fontstyle parameter to ‘normal’, ‘italic’, or ‘oblique’, you can change the font style of the axis labels accordingly.
Removing Axis Labels
If you want to remove the axis labels from a plot, you can use the set_visible() method with the axis.label attribute.
import matplotlib.pyplot as plt

x = [1, 2, 3, 4, 5]
y = [10, 20, 15, 25, 30]

plt.plot(x, y)
plt.xlabel('X-axis Label how2matplotlib.com').set_visible(False)
plt.ylabel('Y-axis Label how2matplotlib.com').set_visible(False)
plt.show()
Output:
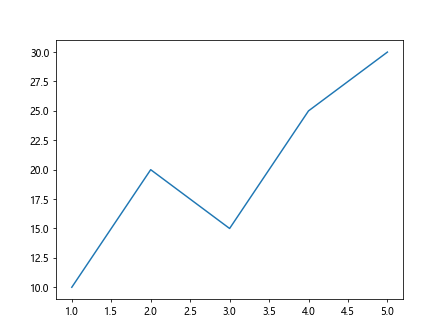
By setting the visible attribute to False for the axis labels, you can hide them from the plot.
Conclusion
In this article, we have explored various ways to customize and add titles to axes in Matplotlib plots. By utilizing the methods and parameters mentioned above, you can enhance the readability and visual appeal of your plots. Experiment with different customization options to create informative and visually appealing plots in Matplotlib.