Matplotlib Bold Title
Matplotlib is a widely used plotting library in Python that allows users to create various types of visualizations. In this article, we will focus on how to create bold titles in matplotlib plots.
Example 1: Basic plot with bold title
import matplotlib.pyplot as plt

plt.plot([1, 2, 3, 4], [1, 4, 9, 16])
plt.title('Bold Title Example', fontweight='bold')
plt.show()
Output:
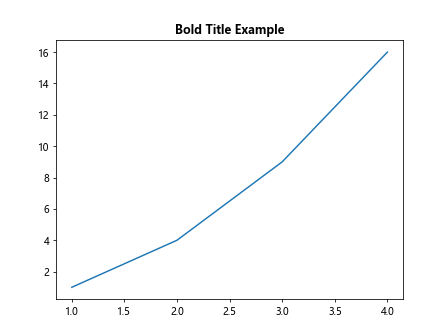
In this example, we use the fontweight parameter in the title function to make the title bold.
Example 2: Customizing title font size and weight
import matplotlib.pyplot as plt

plt.plot([1, 2, 3, 4], [1, 4, 9, 16])
plt.title('Bold Title with Custom Font Size', fontweight='bold', fontsize=14)
plt.show()
Output:
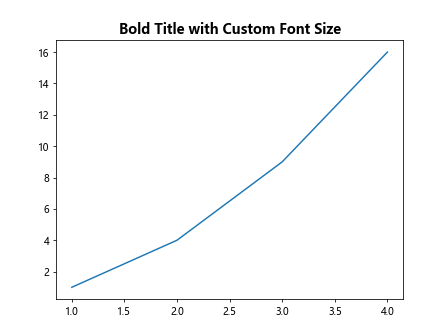
You can also customize the font size of the title along with making it bold.
Example 3: Creating subplots with bold titles
import matplotlib.pyplot as plt

fig, axs = plt.subplots(2)
fig.suptitle('Bold Subplot Titles', fontweight='bold')

axs[0].plot([1, 2, 3, 4], [1, 4, 9, 16])
axs[0].set_title('Subplot 1', fontweight='bold')

axs[1].plot([1, 2, 3, 4], [1, 2, 3, 4])
axs[1].set_title('Subplot 2', fontweight='bold')

plt.show()
Output:
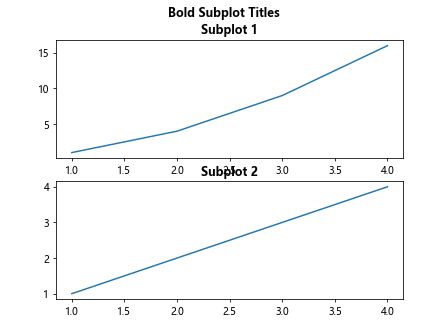
You can create subplots with bold titles by setting the fontweight parameter in the set_title function.
Example 4: Adding bold titles to bar plots
import matplotlib.pyplot as plt

plt.bar(['A', 'B', 'C'], [3, 7, 2])
plt.title('Bold Title for Bar Plot', fontweight='bold')
plt.show()
Output:
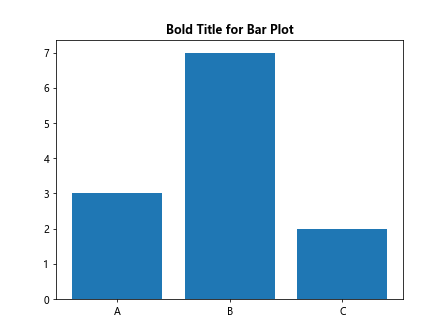
Adding a bold title to a bar plot is similar to other types of plots in matplotlib.
Example 5: Pie chart with bold title
import matplotlib.pyplot as plt

sizes = [20, 30, 50]
labels = ['A', 'B', 'C']
plt.pie(sizes, labels=labels)
plt.title('Bold Title for Pie Chart', fontweight='bold')
plt.show()
Output:
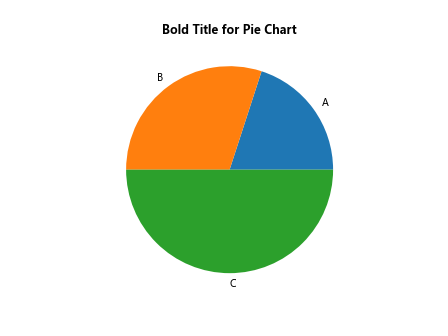
You can also add a bold title to a pie chart in matplotlib.
Example 6: Scatter plot with bold title
import matplotlib.pyplot as plt

x = [1, 2, 3, 4, 5]
y = [3, 5, 1, 7, 4]
plt.scatter(x, y)
plt.title('Bold Title for Scatter Plot', fontweight='bold')
plt.show()
Output:
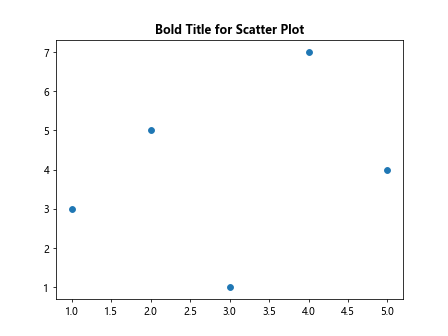
Adding a bold title to a scatter plot follows the same syntax as other plot types.
Example 7: Line plot with bold title and subtitle
import matplotlib.pyplot as plt

x = [1, 2, 3, 4, 5]
y = [3, 5, 1, 7, 4]
plt.plot(x, y)
plt.title('Main Title', fontweight='bold')
plt.suptitle('Subtitle', fontweight='bold')
plt.show()
Output:
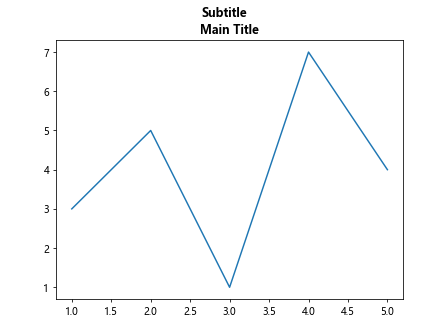
You can add both a main title and a subtitle to a plot with bold font weight.
Example 8: Horizontal bar plot with bold title
import matplotlib.pyplot as plt

plt.barh(['A', 'B', 'C'], [3, 7, 2])
plt.title('Bold Title for Horizontal Bar Plot', fontweight='bold')
plt.show()
Output:
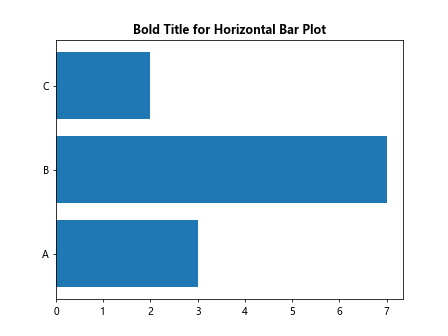
Similarly, horizontal bar plots can also have bold titles in matplotlib.
Example 9: Box plot with bold title
import matplotlib.pyplot as plt

data = [[1, 2, 3, 4], [2, 3, 4, 5], [3, 4, 5, 6]]
plt.boxplot(data)
plt.title('Bold Title for Box Plot', fontweight='bold')
plt.show()
Output:
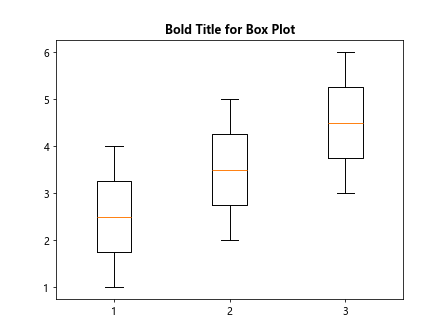
Box plots can be customized with bold titles using the title function.
Example 10: Adding bold title to multiple subplots
import matplotlib.pyplot as plt

fig, axs = plt.subplots(2, 2)
fig.suptitle('Bold Title for Multiple Subplots', fontweight='bold')

axs[0, 0].plot([1, 2, 3, 4], [1, 4, 9, 16])
axs[0, 0].set_title('Subplot 1', fontweight='bold')

axs[0, 1].hist([1, 2, 1, 3, 2, 1], bins=3)
axs[0, 1].set_title('Subplot 2', fontweight='bold')

axs[1, 0].bar(['A', 'B', 'C'], [3, 7, 2])
axs[1, 0].set_title('Subplot 3', fontweight='bold')

axs[1, 1].pie([20, 30, 50], labels=['A', 'B', 'C'])
axs[1, 1].set_title('Subplot 4', fontweight='bold')

plt.show()
Output:
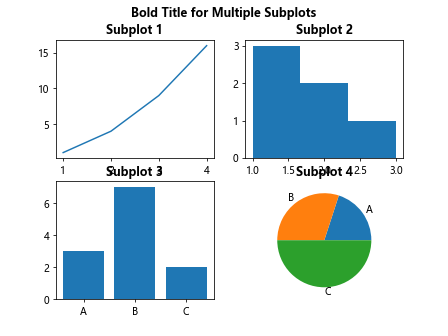
You can add bold titles to multiple subplots in a single figure using matplotlib.
In conclusion, creating bold titles in matplotlib plots is a simple yet effective way to draw attention to the main focus of your visualizations. By customizing the font weight of the titles, you can make your plots more visually appealing and help convey your message more effectively. Experiment with different plot types and styles to find the best way to incorporate bold titles into your matplotlib plots.