Matplotlib Boxplot Example
In this article, we will explore how to create boxplots using the Matplotlib library in Python. Boxplots are a great way to visualize the distribution of a dataset and to identify outliers.
Basic Boxplot
A basic boxplot can be created using the boxplot() function from Matplotlib. Here is an example:
import matplotlib.pyplot as plt

data = [1, 2, 3, 4, 5, 6, 7, 8, 9, 10]
plt.boxplot(data)
plt.show()
Output:
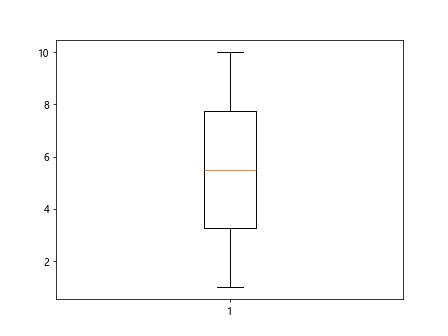
This code will generate a simple boxplot with a box showing the interquartile range, whiskers extending to the minimum and maximum values, and outliers as individual points.
Customizing Colors
You can customize the colors of the various components of the boxplot by specifying the color parameter. Here is an example:
import matplotlib.pyplot as plt

data = [5, 10, 15, 20, 25]
plt.boxplot(data, patch_artist=True, boxprops=dict(facecolor='skyblue'))
plt.show()
Output:
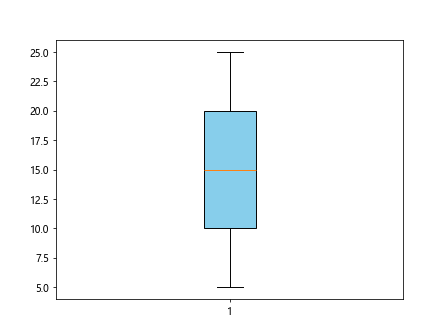
In this example, the box of the boxplot will be filled with a light blue color.
Horizontal Boxplot
You can also create horizontal boxplots by setting the vert parameter to False. Here is an example:
import matplotlib.pyplot as plt

data = [2, 4, 6, 8, 10]
plt.boxplot(data, vert=False)
plt.show()
Output:
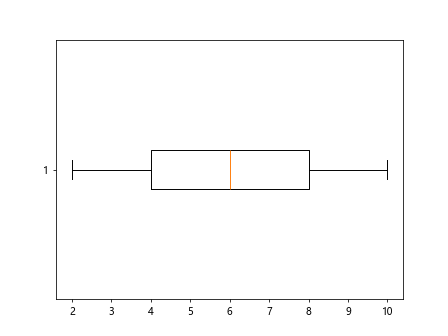
This code will generate a horizontal boxplot instead of the default vertical one.
Multiple Boxplots
You can compare multiple datasets using a single boxplot by passing a list of lists to the boxplot() function. Each inner list represents a different dataset. Here is an example:
import matplotlib.pyplot as plt

data = [[1, 2, 3, 4, 5], [5, 10, 15, 20, 25], [10, 20, 30, 40, 50]]
plt.boxplot(data)
plt.show()
Output:
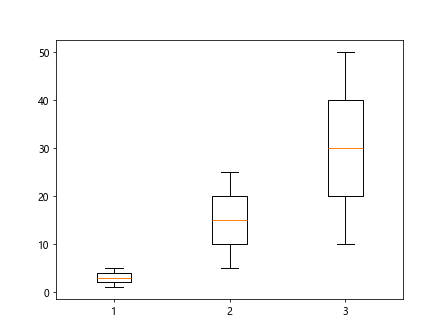
This code will generate a boxplot with three box-and-whisker plots representing three different datasets.
Grouped Boxplots
You can create grouped boxplots to compare different categories within a dataset by using the positions parameter. Here is an example:
import matplotlib.pyplot as plt

data1 = [1, 2, 3, 4, 5]
data2 = [5, 10, 15, 20, 25]
data3 = [10, 20, 30, 40, 50]

plt.boxplot([data1, data2, data3], positions=[1, 2, 3])
plt.show()
Output:
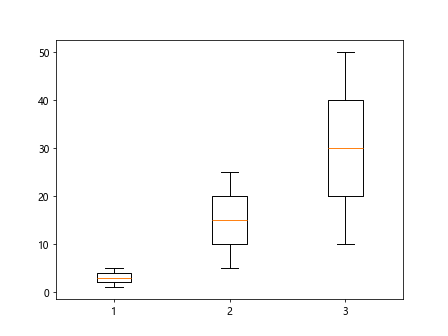
In this example, the boxplots for data1, data2, and data3 will be grouped together at positions 1, 2, and 3 respectively.
Notched Boxplot
You can create notched boxplots by setting the notch parameter to True. Here is an example:
import matplotlib.pyplot as plt

data = [1, 2, 3, 4, 5]
plt.boxplot(data, notch=True)
plt.show()
Output:
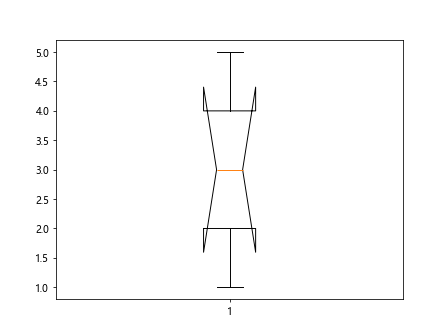
This code will generate a notched boxplot, where the notches represent the confidence interval around the median.
Adding Whiskers
You can customize the whiskers of the boxplot by specifying the whis parameter. Here is an example:
import matplotlib.pyplot as plt

data = [1, 2, 3, 4, 5]
plt.boxplot(data, whis=1.5)
plt.show()
Output:
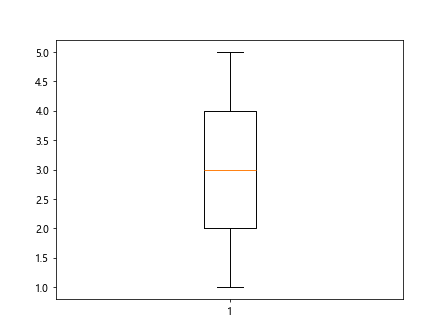
In this example, the whiskers will extend to 1.5 times the interquartile range instead of the default 1.5 times the height of the box.
Boxplot with Labels
You can add labels to the boxplot using the xticklabels parameter. Here is an example:
import matplotlib.pyplot as plt

data = [1, 2, 3, 4, 5]
plt.boxplot(data, whis=1.5, xticklabels=['A', 'B', 'C', 'D', 'E'])
plt.show()
In this code snippet, the boxplot will have labels ‘A’, ‘B’, ‘C’, ‘D’, ‘E’ corresponding to the data points.
Changing Box Width
You can customize the width of the boxes in the boxplot by setting the widths parameter. Here is an example:
import matplotlib.pyplot as plt

data = [1, 2, 3, 4, 5]
plt.boxplot(data, widths=0.5)
plt.show()
Output:
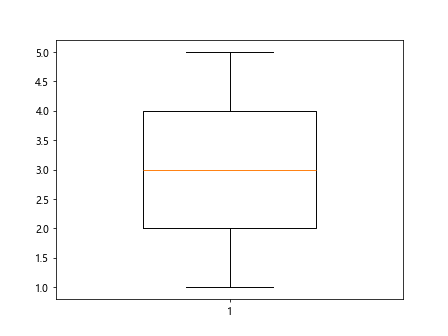
In this example, the boxes of the boxplot will have a width of 0.5 units.
Horizontal Grouped Boxplot
You can create horizontal grouped boxplots by specifying the vert and positions parameters together. Here is an example:
import matplotlib.pyplot as plt

data1 = [1, 2, 3, 4, 5]
data2 = [5, 10, 15, 20, 25]
data3 = [10, 20, 30, 40, 50]

plt.boxplot([data1, data2, data3], vert=False, positions=[1, 2, 3])
plt.show()
Output:
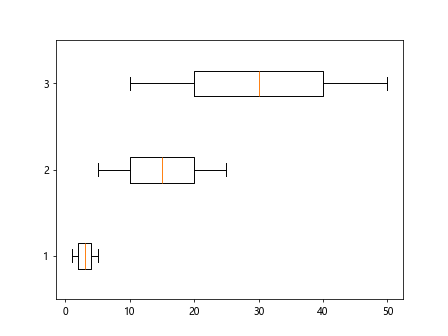
This code will generate horizontal grouped boxplots for data1, data2, and data3 at positions 1, 2, and 3 respectively.
Boxplot with Grid
You can add a grid to the boxplot by using the grid function. Here is an example:
import matplotlib.pyplot as plt

data = [1, 2, 3, 4, 5]
plt.boxplot(data)
plt.grid(True)
plt.show()
Output:
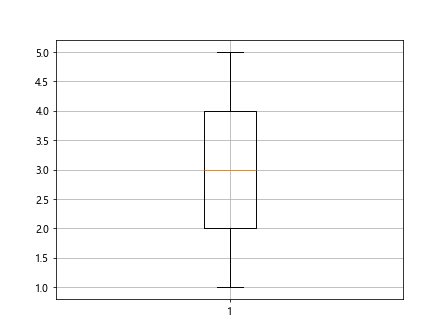
This code will generate a boxplot with a grid in the background for reference.
Rotated Boxplot
You can rotate the boxplot by setting the vert parameter to False and changing the orientation. Here is an example:
import matplotlib.pyplot as plt

data = [1, 2, 3, 4, 5]
plt.boxplot(data, vert=False)
plt.show()
Output:
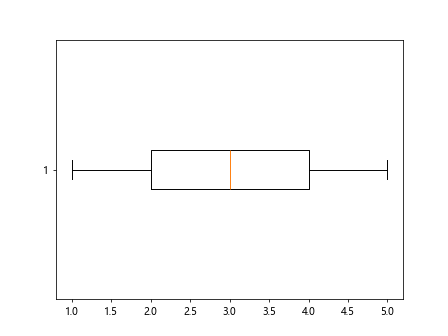
This code will generate a rotated boxplot in a horizontal orientation.
Boxplot with Mean Point
You can add mean points to the boxplot by setting the showmeans parameter to True. Here is an example:
import matplotlib.pyplot as plt

data = [1, 2, 3, 4, 5]
plt.boxplot(data, showmeans=True)
plt.show()
Output:
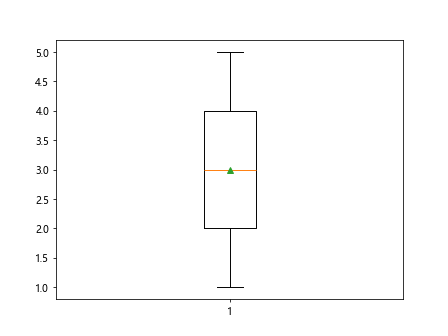
In this example, a point representing the mean of the dataset will be added to the boxplot.
Boxplot with Median Line
You can add a line indicating the median value of the dataset by setting the showmedian parameter to True. Here is an example:
import matplotlib.pyplot as plt

data = [1, 2, 3, 4, 5]
plt.boxplot(data, showmedian=True)
plt.show()
This code will generate a boxplot with a line representing the median value of the data.
Boxplot with Whisker Caps
You can customize the whisker caps of the boxplot by setting the flierprops parameter. Here is an example:
import matplotlib.pyplot as plt

data = [1, 2, 3, 4, 5]
plt.boxplot(data, flierprops=dict(marker='o', color='red', markersize=10, linestyle='none'))
plt.show()
Output:
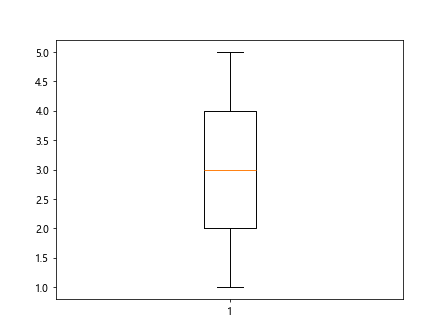
In this example, the outliers will be represented by red circles with a size of 10.
Grouped Boxplot with Legend
You can add a legend to a grouped boxplot by using the legend function. Here is an example:
import matplotlib.pyplot as plt

data1 = [1, 2, 3, 4, 5]
data2 = [5, 10, 15, 20, 25]
data3 = [10, 20, 30, 40, 50]

plt.boxplot([data1, data2, data3], labels=['Group 1', 'Group 2', 'Group 3'])
plt.legend()
plt.show()
In this code snippet, a legend will be added to the boxplot to show the group labels.
Boxplot with Outliers
You can display outliers in the boxplot by setting the showfliers parameter to True. Here is an example:
import matplotlib.pyplot as plt

data = [1, 2, 3, 4, 5, 10, 15, 20]
plt.boxplot(data, showfliers=True)
plt.show()
Output:
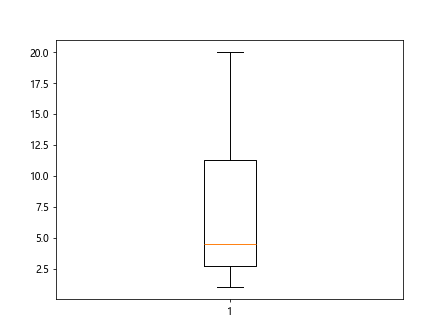
In this example, the boxplot will display any outliers in the dataset as individual points.
Boxplot with Custom Whiskers
You can customize the appearance of the whiskers of the boxplot by using the whiskerprops parameter. Here is an example:
import matplotlib.pyplot as plt

data = [1, 2, 3, 4, 5]
plt.boxplot(data, whiskerprops=dict(color='green', linestyle='--'))
plt.show()
Output:
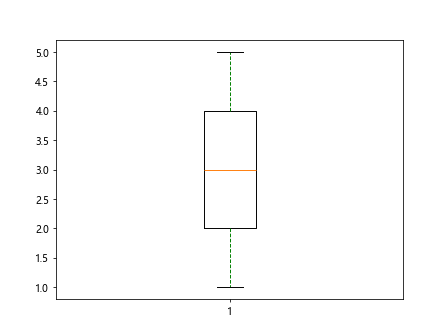
In this code snippet, the whiskers of the boxplot will be green and dashed.
Boxplot with Outline
You can customize the outline of the boxplot by setting the boxprops parameter. Here is an example:
import matplotlib.pyplot as plt

data = [1, 2, 3, 4, 5]
plt.boxplot(data, boxprops=dict(color='purple', linewidth=2))
plt.show()
Output:
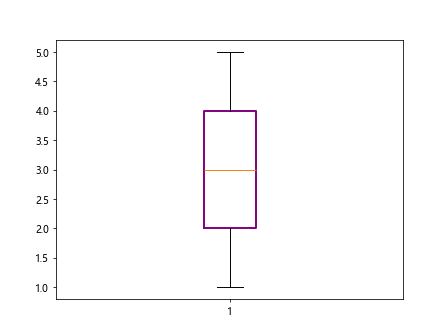
In this example, the outline of the boxes in the boxplot will be purple with a width of 2 units.
Boxplot with Title
You can add a title to the boxplot by using the title function. Here is an example:
import matplotlib.pyplot as plt

data = [1, 2, 3, 4, 5]
plt.boxplot(data)
plt.title('Example Boxplot')
plt.show()
Output:
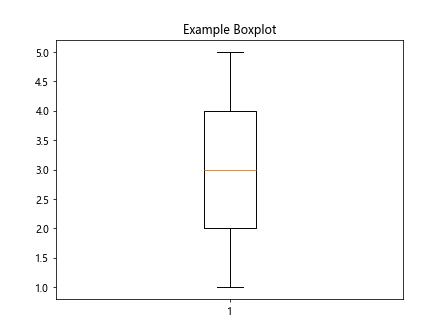
In this code snippet, a title ‘Example Boxplot’ will be added to the top of the boxplot.
Boxplot with Axes Labels
You can add labels to the x and y axes of the boxplot using the xlabel and ylabel functions. Here is an example:
import matplotlib.pyplot as plt

data = [1, 2, 3, 4, 5]
plt.boxplot(data)
plt.xlabel('X-axis')
plt.ylabel('Y-axis')
plt.show()
Output:
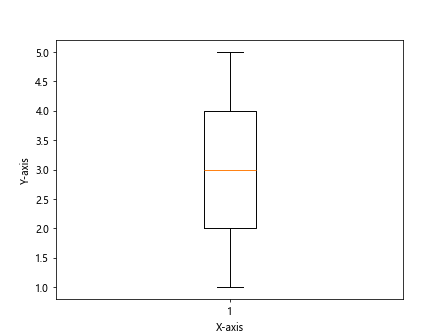
In this example, the x-axis will be labeled as ‘X-axis’ and the y-axis will be labeled as ‘Y-axis’.
Conclusion
In this article, we have explored various examples of creating boxplots using the Matplotlib library in Python. Boxplots are a powerful tool for visualizing the distribution of data and identifying outliers. By customizing different aspects of the boxplot, such as colors, widths, and labels, you can create informative and visually appealing visualizations to analyze your dataset. Experiment with the examples provided above and explore the many possibilities of creating boxplots with Matplotlib.