Matplotlib Aspect Ratio
When creating plots using Matplotlib, it’s important to consider the aspect ratio of the plot. The aspect ratio determines the relationship between the width and height of the plot and can significantly impact how the data is visualized. In this article, we will explore how to adjust the aspect ratio of plots in Matplotlib and provide examples to demonstrate various scenarios.
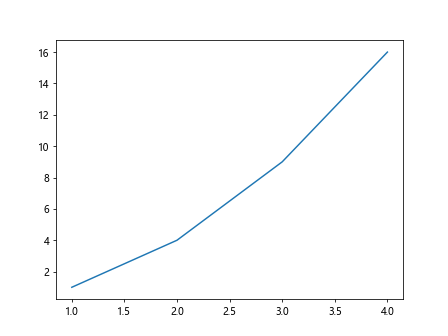
1. Set Aspect Ratio
You can set the aspect ratio of a plot using the set_aspect() method. This method takes a parameter aspect, which can be set to values such as 'auto', 'equal', or a numerical value.
import matplotlib.pyplot as plt

fig, ax = plt.subplots()
ax.plot([1, 2, 3, 4], [1, 4, 9, 16])
ax.set_aspect('auto')
plt.show()
Output:
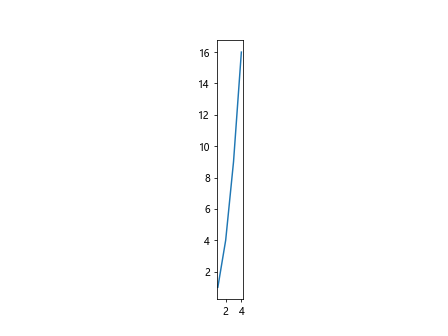
2. Set Aspect Ratio Numerically
You can set the aspect ratio numerically by providing a ratio value to the set_aspect() method. Below is an example of setting the aspect ratio to 2:
import matplotlib.pyplot as plt

fig, ax = plt.subplots()
ax.plot([1, 2, 3, 4], [1, 4, 9, 16])
ax.set_aspect(2)
plt.show()
Output:
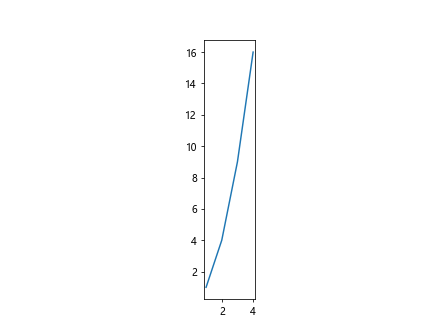
3. Equal Aspect Ratio
You can set the aspect ratio to be equal in both directions using the 'equal' value in the set_aspect() method. This will ensure that the width and height are equal.
import matplotlib.pyplot as plt

fig, ax = plt.subplots()
ax.plot([1, 2, 3, 4], [1, 4, 9, 16])
ax.set_aspect('equal')
plt.show()
Output:

4. Lock Aspect Ratio
You can lock the aspect ratio of the plot so that it remains constant when resizing the plot window. This can be achieved using the axis('scaled') method.
import matplotlib.pyplot as plt

fig, ax = plt.subplots()
ax.plot([1, 2, 3, 4], [1, 4, 9, 16])
ax.axis('scaled')
plt.show()
Output:
5. Custom Aspect Ratio
You can set a custom aspect ratio by providing a tuple of two values representing the width and height ratio to the set_aspect() method. For example, a ratio of 2:1 can be set as (2, 1).
import matplotlib.pyplot as plt

fig, ax = plt.subplots()
ax.plot([1, 2, 3, 4], [1, 4, 9, 16])
ax.set_aspect((2, 1))
plt.show()
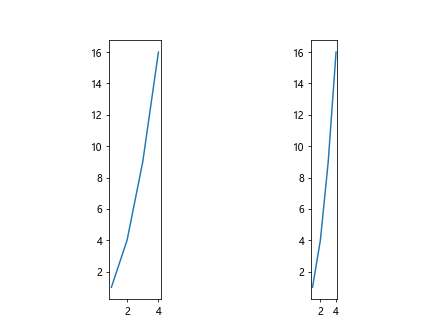
6. Adjusting Aspect Ratio for Subplots
When creating subplots, you can adjust the aspect ratio of each subplot individually. Here is an example of setting different aspect ratios for two subplots:
import matplotlib.pyplot as plt

fig, axs = plt.subplots(1, 2)
axs[0].plot([1, 2, 3, 4], [1, 4, 9, 16])
axs[0].set_aspect('equal')

axs[1].plot([1, 2, 3, 4], [1, 4, 9, 16])
axs[1].set_aspect(2)

plt.show()
Output:
7. Aspect Ratio for Images
You can also adjust the aspect ratio when displaying images in Matplotlib. Here is an example of setting the aspect ratio for an image:
import matplotlib.pyplot as plt
import matplotlib.image as mpimg

img = mpimg.imread('image.jpg')
plt.imshow(img, aspect='auto')
plt.axis('off')
plt.show()
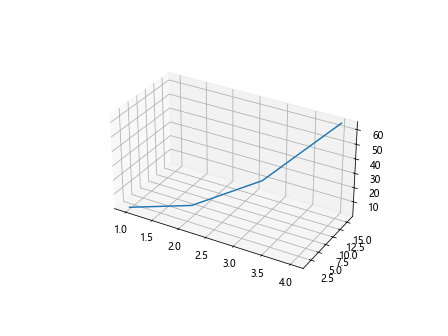
8. Aspect Ratio for 3D Plots
When working with 3D plots in Matplotlib, you can adjust the aspect ratio of the plot using the set_box_aspect() method. Here is an example:
import matplotlib.pyplot as plt
from mpl_toolkits.mplot3d import Axes3D

fig = plt.figure()
ax = fig.add_subplot(111, projection='3d')
ax.plot([1, 2, 3, 4], [1, 4, 9, 16], [1, 8, 27, 64])
ax.set_box_aspect([2,1,1])
plt.show()
Output:
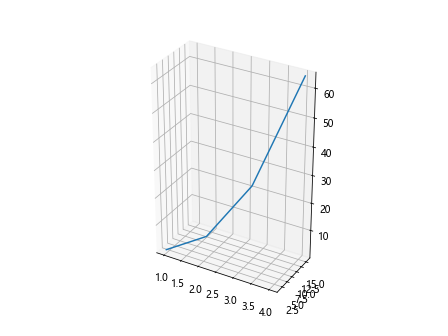
9. Fixed Aspect Ratio for 3D Plots
You can set a fixed aspect ratio for 3D plots by using the set_box_aspect() method with a tuple containing the desired ratios for each axis. Here is an example:
import matplotlib.pyplot as plt
from mpl_toolkits.mplot3d import Axes3D

fig = plt.figure()
ax = fig.add_subplot(111, projection='3d')
ax.plot([1, 2, 3, 4], [1, 4, 9, 16], [1, 8, 27, 64])
ax.set_box_aspect([2,1,3])
plt.show()
Output:
10. Automatic Aspect Ratio Adjustment
Matplotlib also provides the adjustable parameter in the set_box_aspect() method, which allows for automatic adjustment of the aspect ratio based on the plot content. Here is an example:
import matplotlib.pyplot as plt
from mpl_toolkits.mplot3d import Axes3D

fig = plt.figure()
ax = fig.add_subplot(111, projection='3d')
ax.plot([1, 2, 3, 4], [1, 4, 9, 16], [1, 8, 27, 64])
ax.set_box_aspect([2,1,1], adjustable='datalim')
plt.show()
Conclusion
Adjusting the aspect ratio of plots in Matplotlib is essential for visualizing data accurately. By utilizing the methods and techniques discussed in this article, you can control the aspect ratio of plots, subplots, images, and 3D plots to create effective and informative visualizations. Experiment with different aspect ratios to find the best representation of your data.