Adding Colorbar in Matplotlib
Matplotlib is a popular data visualization library in Python that allows users to create a wide range of plots and charts. One useful feature of Matplotlib is the ability to add a colorbar to plots, which can provide additional information about the data being displayed.
Introduction to Colorbar
A colorbar is a graphical representation of the mapping between colors and data values in a plot. It helps users understand the range of values present in the plot and the corresponding colors assigned to those values. Colorbars are commonly used in heatmaps, contour plots, and scatter plots to provide clarity on the data being visualized.
Creating a Simple Colorbar
To add a colorbar to a plot in Matplotlib, you can use the plt.colorbar() function. Here’s an example code snippet showing how to create a simple scatter plot with a colorbar:
import matplotlib.pyplot as plt
import numpy as np

x = np.random.rand(100)
y = np.random.rand(100)
colors = np.random.rand(100)

plt.scatter(x, y, c=colors, cmap='viridis')
plt.colorbar()
plt.show()
Output:
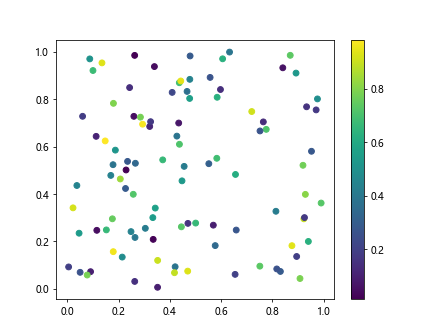
In this code, we generate random data points for x and y coordinates, as well as random colors. We then create a scatter plot using plt.scatter() and specify the colors using the c parameter. Finally, we add a colorbar to the plot using plt.colorbar().
Customizing Colorbar Appearance
Matplotlib allows users to customize the appearance of the colorbar to suit their needs. You can adjust the size, orientation, label, and tick marks of the colorbar to make it more informative. Here’s an example code snippet showing how to customize the colorbar appearance:
import matplotlib.pyplot as plt
import numpy as np

x = np.random.rand(100)
y = np.random.rand(100)
colors = np.random.rand(100)

plt.scatter(x, y, c=colors, cmap='viridis')
cbar = plt.colorbar()
cbar.set_label('Color Intensity')
cbar.set_ticks([0, 0.5, 1])
cbar.set_ticklabels(['Low', 'Medium', 'High'])

plt.show()
Output:
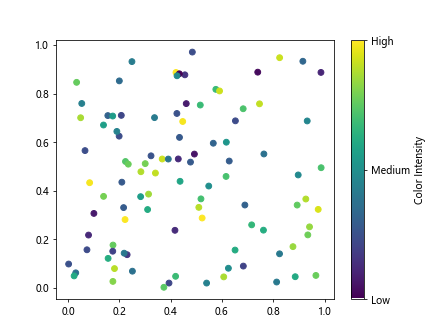
In this code, we create a scatter plot with random data points and colors. We then customize the colorbar by setting a label using cbar.set_label(), defining specific tick marks using cbar.set_ticks(), and labeling those tick marks with cbar.set_ticklabels().
Using Colorbars in Different Plot Types
Colorbars can be added to various plot types in Matplotlib to enhance data visualization. Here are a few examples demonstrating how to use colorbars in different plot types:
1. Heatmap
A heatmap is a graphical representation of data in the form of a matrix where each cell is colored based on its value. You can add a colorbar to a heatmap to indicate the range of values. Here’s an example code snippet showing how to create a heatmap with a colorbar:
import matplotlib.pyplot as plt
import numpy as np

data = np.random.rand(10, 10)

plt.imshow(data, cmap='viridis')
plt.colorbar()
plt.show()
Output:
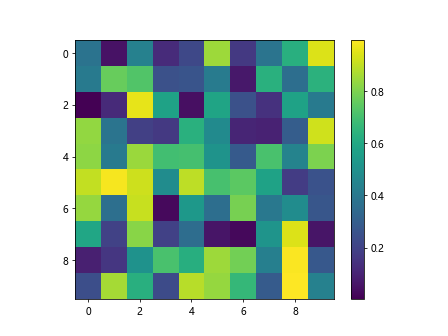
In this code, we generate random data for a 10×10 matrix and create a heatmap using plt.imshow(). We add a colorbar to the heatmap using plt.colorbar().
2. Contour Plot
A contour plot is a graphical representation of 3D data in 2D space, where lines represent points of equal value. Adding a colorbar to a contour plot can help users understand the data distribution better. Here’s an example code snippet showing how to create a contour plot with a colorbar:
import matplotlib.pyplot as plt
import numpy as np

x = np.linspace(-3, 3, 100)
y = np.linspace(-3, 3, 100)
X, Y = np.meshgrid(x, y)
Z = np.sin(X) + np.cos(Y)

plt.contourf(X, Y, Z, cmap='viridis')
plt.colorbar()
plt.show()
Output:
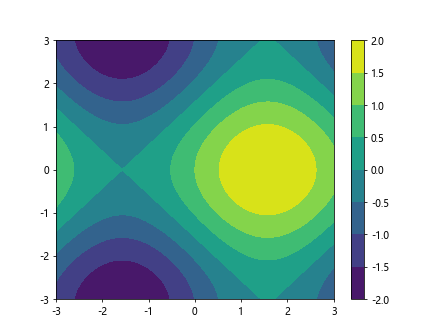
In this code, we create a contour plot of the function Z = sin(X) + cos(Y) using plt.contourf(). We add a colorbar to the contour plot using plt.colorbar().
3. Surface Plot
A surface plot is a graphical representation of 3D data in 3D space, where the surface represents the data values. Adding a colorbar to a surface plot can provide additional insights into the data. Here’s an example code snippet showing how to create a surface plot with a colorbar:
import matplotlib.pyplot as plt
import numpy as np

x = np.linspace(-5, 5, 100)
y = np.linspace(-5, 5, 100)
X, Y = np.meshgrid(x, y)
Z = np.sin(np.sqrt(X**2 + Y**2))

fig = plt.figure()
ax = fig.add_subplot(111, projection='3d')
surf = ax.plot_surface(X, Y, Z, cmap='viridis')
fig.colorbar(surf)
plt.show()
Output:
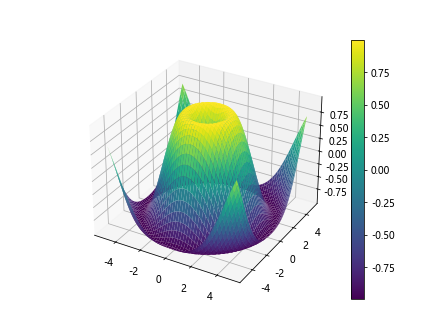
In this code, we create a surface plot of the function Z = sin(sqrt(X^2 + Y^2)) using ax.plot_surface(). We add a colorbar to the surface plot using fig.colorbar().
Conclusion
In conclusion, colorbars are a useful tool in Matplotlib for enhancing data visualization by providing additional information about the data being displayed. By using colorbars effectively, users can create more informative and visually appealing plots and charts. Experiment with the examples provided in this article to see how colorbars can improve your data visualization projects.