Magma Colormap
The Magma colormap is a popular colormap in data visualization that is designed to be perceptually uniform and visually appealing. It is commonly used to represent ordered data that ranges from low to high values. In this article, we will explore the Magma colormap in more detail and learn how to use it in Python with Matplotlib.
1. Introduction to Magma Colormap
The Magma colormap is a perceptually uniform colormap that is designed to be easily interpreted by viewers. It is a colormap that transitions from dark colors (usually black or dark purple) to bright colors (usually yellow or white), making it well-suited for representing ordered data that ranges from low to high values.
2. Using Magma Colormap in Matplotlib
To use the Magma colormap in Matplotlib, you can simply specify the colormap name when plotting data. Here’s an example:
import matplotlib.pyplot as plt
import numpy as np

# Create a sample data array
x = np.linspace(0, 10, 100)
y = np.sin(x)

# Plot the data using the Magma colormap
plt.scatter(x, y, c=y, cmap='magma')
plt.colorbar()
plt.show()
Output:
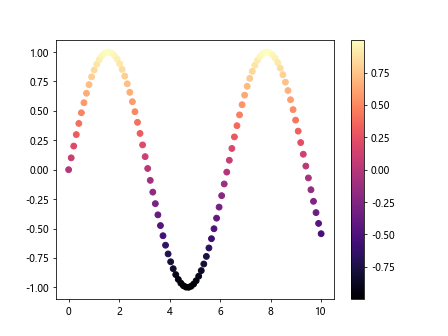
In the above code snippet, we create a scatter plot of a sine wave and use the Magma colormap to color the points based on their y-values.
3. Customizing the Magma Colormap
You can also customize the Magma colormap by adjusting the color map boundaries and normalization. Here’s an example:
import matplotlib.pyplot as plt
import numpy as np
from matplotlib.colors import Normalize

# Create a sample data array
x = np.linspace(0, 10, 100)
y = np.sin(x)

# Create a custom Magma colormap
cmap = plt.get_cmap('magma')
norm = Normalize(vmin=-1, vmax=1)

# Plot the data with the custom Magma colormap
plt.scatter(x, y, c=y, cmap=cmap, norm=norm)
plt.colorbar()
plt.show()
Output:
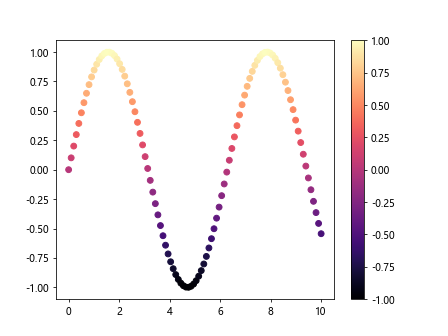
In the above code snippet, we create a custom Magma colormap that is normalized between -1 and 1, allowing us to customize the color mapping based on our data range.
4. Using Magma Colormap in 3D Plots
You can also use the Magma colormap in 3D plots in Matplotlib. Here’s an example:
import matplotlib.pyplot as plt
import numpy as np

# Create sample data
x = np.linspace(-5, 5, 100)
y = np.linspace(-5, 5, 100)
X, Y = np.meshgrid(x, y)
Z = np.sin(np.sqrt(X**2 + Y**2))

# Plot the data in 3D using the Magma colormap
fig = plt.figure()
ax = fig.add_subplot(111, projection='3d')
surf = ax.plot_surface(X, Y, Z, cmap='magma')
fig.colorbar(surf)
plt.show()
Output:
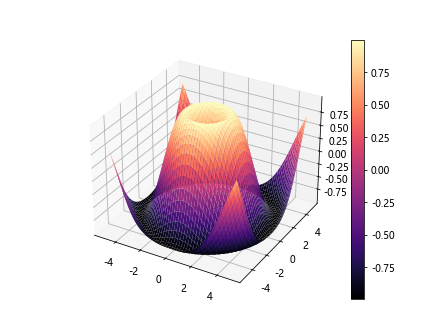
In the above code snippet, we create a 3D surface plot of a sine wave and use the Magma colormap to color the surface based on the z-values.
5. Using Magma Colormap with Images
The Magma colormap can also be used with images in Matplotlib. Here’s an example of how to apply the Magma colormap to an image:
import matplotlib.pyplot as plt
import numpy as np

# Create a sample image
image = np.random.rand(100, 100)

# Display the image with the Magma colormap
plt.imshow(image, cmap='magma')
plt.colorbar()
plt.show()
Output:
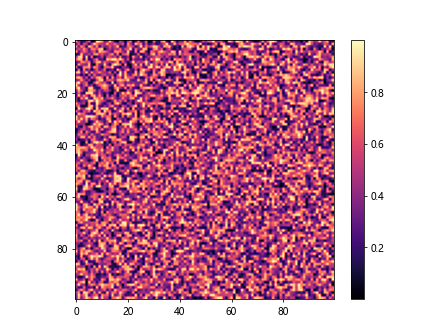
In the above code snippet, we create a random image and use the Magma colormap to display it with the appropriate color scheme.
6. Reversing the Magma Colormap
You can easily reverse the Magma colormap to change the color gradient direction. Here’s an example:
import matplotlib.pyplot as plt
import numpy as np

# Create a sample data array
x = np.linspace(0, 10, 100)
y = np.sin(x)

# Plot the data using the reversed Magma colormap
plt.scatter(x, y, c=y, cmap='magma_r')
plt.colorbar()
plt.show()
Output:
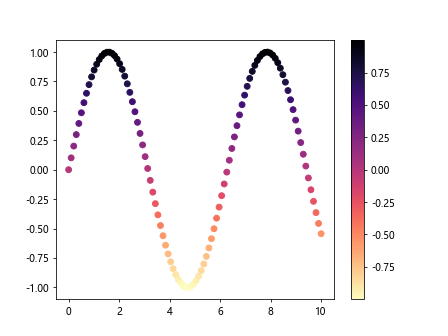
In the above code snippet, we reverse the Magma colormap by using 'magma_r' instead of 'magma' when plotting the data.
7. Applying Magma Colormap to Histograms
You can also apply the Magma colormap to histograms in Matplotlib. Here’s an example:
import matplotlib.pyplot as plt
import numpy as np

# Create a sample data array
data = np.random.randn(1000)

# Plot a histogram with the Magma colormap
plt.hist(data, bins=30, cmap='magma')
plt.colorbar()
plt.show()
In the above code snippet, we create a histogram of random data and use the Magma colormap to color the histogram bars.
8. Creating a Colorbar with the Magma Colormap
You can create a colorbar with the Magma colormap to show the color mapping of your data. Here’s an example:
import matplotlib.pyplot as plt
import numpy as np

# Create a sample data array
data = np.random.rand(100)

# Plot the data with the Magma colormap and add a colorbar
plt.scatter(range(100), data, c=data, cmap='magma')
plt.colorbar(label='Values')
plt.show()
Output:
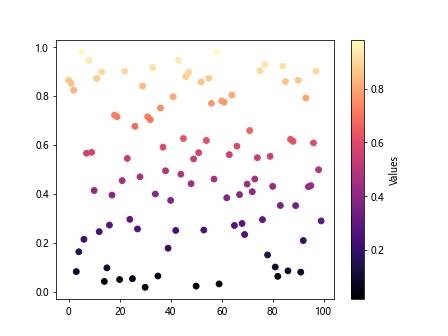
In the above code snippet, we create a colorbar that represents the Magma colormap and shows the color mapping of our data.
9. Using Magma Colormap with Seaborn
You can also use the Magma colormap with Seaborn, a popular data visualization library built on top of Matplotlib. Here’s an example:
import seaborn as sns
import numpy as np

# Create a sample data array
x = np.random.randn(100)
y = np.random.randn(100)

# Create a scatter plot with Seaborn using the Magma colormap
sns.scatterplot(x=x, y=y, palette='magma')
plt.show()
In the above code snippet, we create a scatter plot using Seaborn and apply the Magma colormap to the plot.
10. Conclusion
In this article, we have explored the Magma colormap in detail and learned how to use it in Python with Matplotlib. The Magma colormap is a visually appealing and perceptually uniform colormap that is great for representing ordered data. By following the examples provided in this article, you can easily apply the Magma colormap to your data visualizations and create beautiful plots.