Log Scale in Matplotlib
Matplotlib is a versatile library for creating visualizations in Python. One commonly used feature in Matplotlib is the ability to use a logarithmic scale for the axes. This can be particularly useful when working with data that spans several orders of magnitude. In this article, we will explore how to use log scale in Matplotlib.
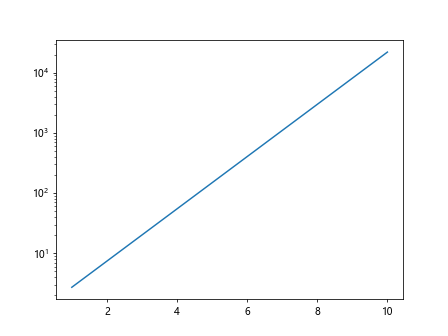
1. Plotting a Simple Line Chart with Log Scale
import matplotlib.pyplot as plt
import numpy as np

x = np.linspace(1, 10, 100)
y = np.exp(x)

plt.figure()
plt.plot(x, y)
plt.yscale('log')
plt.show()
Output:
2. Changing the Base of Log Scale
import matplotlib.pyplot as plt
import numpy as np

x = np.linspace(1, 10, 100)
y = np.exp(x)

plt.figure()
plt.plot(x, y)
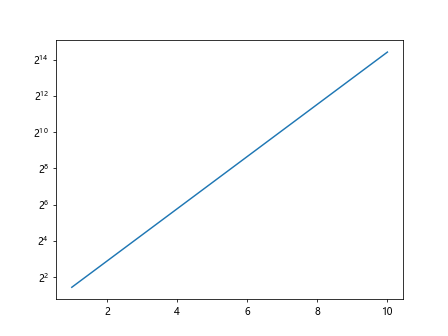
plt.yscale('log', base=2)
plt.show()
Output:
3. Dual Axes with Different Scales
import matplotlib.pyplot as plt
import numpy as np

x = np.linspace(1, 10, 100)
y = np.exp(x)

fig, ax1 = plt.subplots()

ax1.plot(x, y, 'b-')
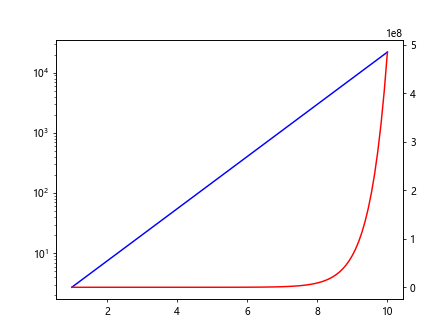
ax1.set_yscale('log')

ax2 = ax1.twinx()
ax2.plot(x, y**2, 'r-')
ax2.set_yscale('linear')

plt.show()
Output:
4. Log Scale for both X and Y Axis
import matplotlib.pyplot as plt
import numpy as np

x = np.linspace(1, 10, 100)
y = np.exp(x)

plt.figure()
plt.plot(x, y)
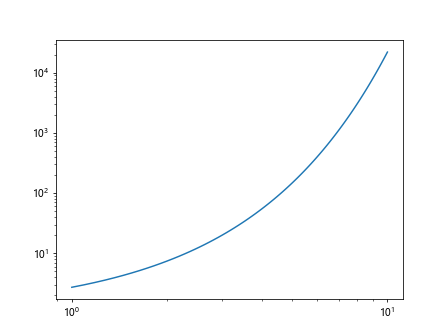
plt.xscale('log')
plt.yscale('log')
plt.show()
Output:
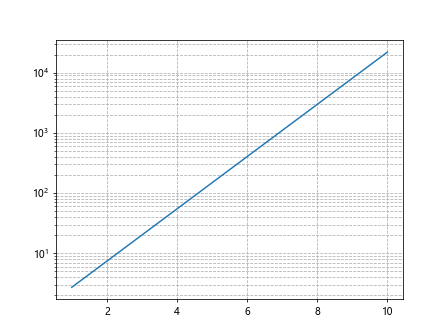
5. Adding Gridlines to Log-Scaled Plot
import matplotlib.pyplot as plt
import numpy as np

x = np.linspace(1, 10, 100)
y = np.exp(x)

plt.figure()
plt.plot(x, y)
plt.yscale('log')
plt.grid(True, which="both", ls="--")
plt.show()
Output:
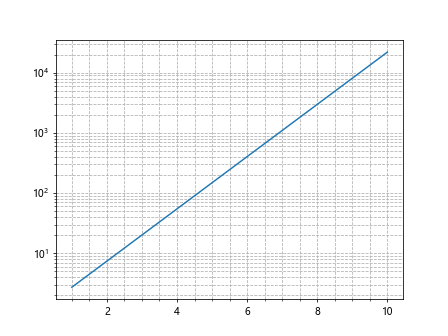
6. Using Logarithmic Ticks
import matplotlib.pyplot as plt
import numpy as np

x = np.linspace(1, 10, 100)
y = np.exp(x)

plt.figure()
plt.plot(x, y)
plt.yscale('log')
plt.minorticks_on()
plt.grid(True, which="both", ls="--")
plt.show()
Output:
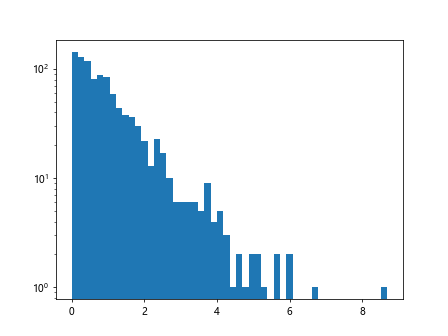
7. Log Scale Histogram
import matplotlib.pyplot as plt
import numpy as np

x = np.linspace(1, 10, 100)
y = np.exp(x)

data = np.random.exponential(1, 1000)

plt.figure()
plt.hist(data, bins=50)
plt.yscale('log')
plt.show()
Output:
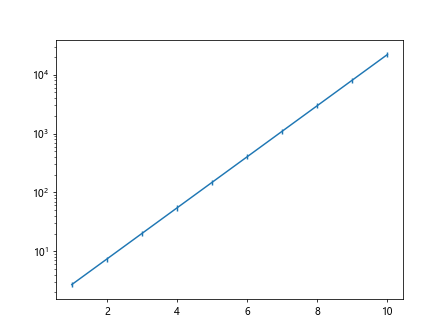
8. Log Scale with Error Bars
import matplotlib.pyplot as plt
import numpy as np

x = np.arange(1, 11)
y = np.exp(x)
error = 0.1 * y

plt.figure()
plt.errorbar(x, y, yerr=error)
plt.yscale('log')
plt.show()
Output:
9. Log Scale Heatmap
import matplotlib.pyplot as plt
import numpy as np

x = np.linspace(1, 10, 100)
y = np.exp(x)

data = np.random.rand(10,10)

plt.figure()
plt.imshow(data, norm=LogNorm())
plt.colorbar()
plt.show()
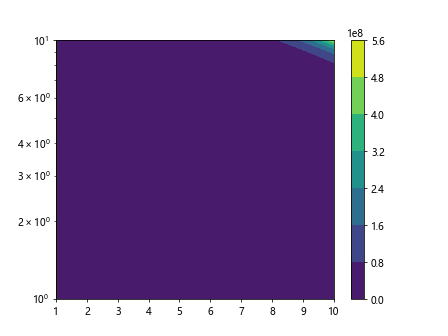
10. Contour Plot with Log Scale
import matplotlib.pyplot as plt
import numpy as np

x = np.linspace(1, 10, 100)
y = np.linspace(1, 10, 100)
X, Y = np.meshgrid(x, y)
Z = np.exp(X + Y)

plt.figure()
plt.contourf(X, Y, Z)
plt.yscale('log')
plt.colorbar()
plt.show()
Output:
Conclusion
In this article, we have explored various ways to use log scale in Matplotlib. By utilizing log scale, we can effectively visualize data that spans a wide range of values. Whether it is a simple line chart or a complex contour plot, Matplotlib provides the flexibility to create log-scaled plots for a wide range of applications. Next time you are working with data that has large variations, consider incorporating log scale into your visualizations using Matplotlib.