How to Customize Matplotlib Legend Size: A Comprehensive Guide
Matplotlib legend size is an essential aspect of data visualization that can significantly impact the readability and overall appearance of your plots. In this comprehensive guide, we’ll explore various techniques to customize the size of legends in Matplotlib, providing you with the tools to create visually appealing and informative plots. From adjusting font sizes to modifying legend box dimensions, we’ll cover everything you need to know about controlling matplotlib legend size.
Understanding Matplotlib Legend Size
Before diving into the specifics of customizing matplotlib legend size, it’s crucial to understand what exactly we mean by “legend size” in the context of Matplotlib. The legend size encompasses several aspects:
- Font size of the legend text
- Size of the legend markers or symbols
- Overall dimensions of the legend box
- Spacing between legend entries
Each of these components contributes to the overall appearance and readability of your legend, and Matplotlib provides various methods to adjust them individually or collectively.
Let’s start with a basic example to illustrate a default legend in Matplotlib:
import matplotlib.pyplot as plt

plt.figure(figsize=(8, 6))
plt.plot([1, 2, 3, 4], [1, 4, 2, 3], label='Line 1')
plt.plot([1, 2, 3, 4], [2, 3, 4, 1], label='Line 2')
plt.title('Default Legend Size - how2matplotlib.com')
plt.legend()
plt.show()
Output:
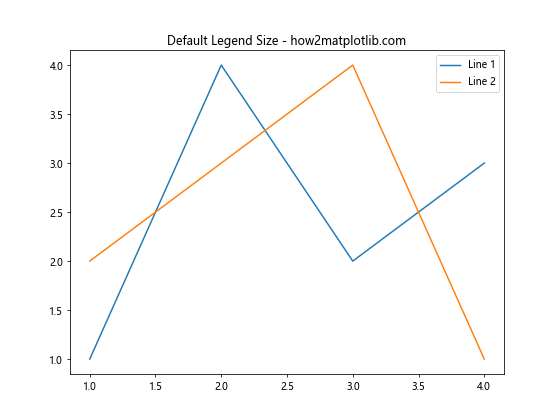
In this example, we create a simple plot with two lines and a default legend. The legend size is determined automatically by Matplotlib based on the plot size and content.
Adjusting Legend Font Size
One of the most common ways to modify matplotlib legend size is by changing the font size of the legend text. This can be achieved using the fontsize parameter in the legend() function.
Here’s an example demonstrating how to increase the legend font size:
import matplotlib.pyplot as plt

plt.figure(figsize=(8, 6))
plt.plot([1, 2, 3, 4], [1, 4, 2, 3], label='Line 1')
plt.plot([1, 2, 3, 4], [2, 3, 4, 1], label='Line 2')
plt.title('Increased Legend Font Size - how2matplotlib.com')
plt.legend(fontsize=16)
plt.show()
Output:
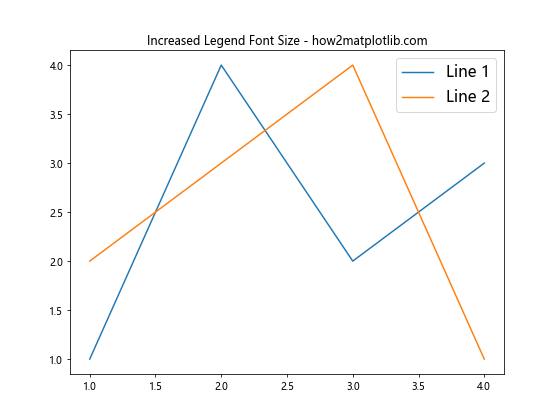
In this code, we set fontsize=16 in the legend() function, which increases the font size of the legend text. You can adjust this value to make the legend text larger or smaller according to your preferences.
Modifying Legend Marker Size
The size of the markers or symbols in the legend can also contribute to the overall matplotlib legend size. You can adjust this using the markerscale parameter in the legend() function.
Here’s an example that demonstrates how to increase the size of legend markers:
import matplotlib.pyplot as plt

plt.figure(figsize=(8, 6))
plt.plot([1, 2, 3, 4], [1, 4, 2, 3], label='Line 1', marker='o')
plt.plot([1, 2, 3, 4], [2, 3, 4, 1], label='Line 2', marker='s')
plt.title('Increased Legend Marker Size - how2matplotlib.com')
plt.legend(markerscale=2)
plt.show()
Output:
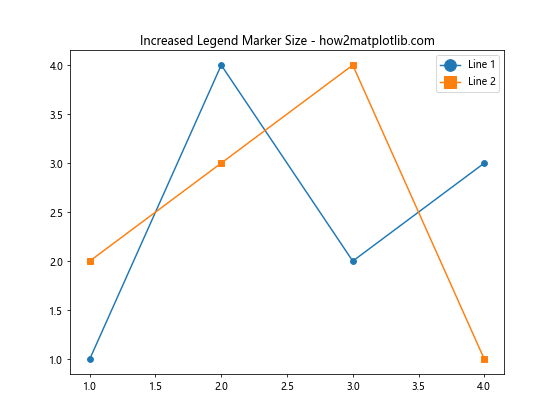
In this example, we set markerscale=2 in the legend() function, which doubles the size of the markers in the legend compared to their size in the plot.
Adjusting Legend Box Size
Sometimes, you may want to control the overall size of the legend box. This can be achieved by using the bbox_to_anchor parameter in combination with the loc parameter in the legend() function.
Here’s an example that demonstrates how to create a larger legend box:
import matplotlib.pyplot as plt

plt.figure(figsize=(8, 6))
plt.plot([1, 2, 3, 4], [1, 4, 2, 3], label='Line 1')
plt.plot([1, 2, 3, 4], [2, 3, 4, 1], label='Line 2')
plt.title('Larger Legend Box - how2matplotlib.com')
plt.legend(bbox_to_anchor=(1.05, 1), loc='upper left', borderaxespad=0.)
plt.tight_layout()
plt.show()
Output:
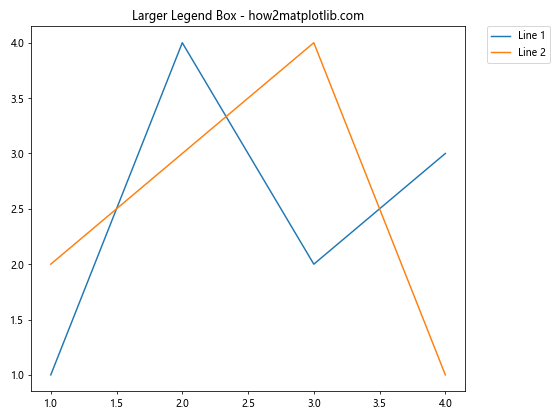
In this code, we use bbox_to_anchor=(1.05, 1) to position the legend outside the plot area, and loc='upper left' to align it with the upper-left corner of the plot. This approach allows for a larger legend box without overlapping with the plot content.
Controlling Legend Spacing
The spacing between legend entries can also affect the overall matplotlib legend size. You can adjust this using the labelspacing parameter in the legend() function.
Here’s an example that demonstrates how to increase the spacing between legend entries:
import matplotlib.pyplot as plt

plt.figure(figsize=(8, 6))
plt.plot([1, 2, 3, 4], [1, 4, 2, 3], label='Line 1')
plt.plot([1, 2, 3, 4], [2, 3, 4, 1], label='Line 2')
plt.title('Increased Legend Spacing - how2matplotlib.com')
plt.legend(labelspacing=2)
plt.show()
Output:
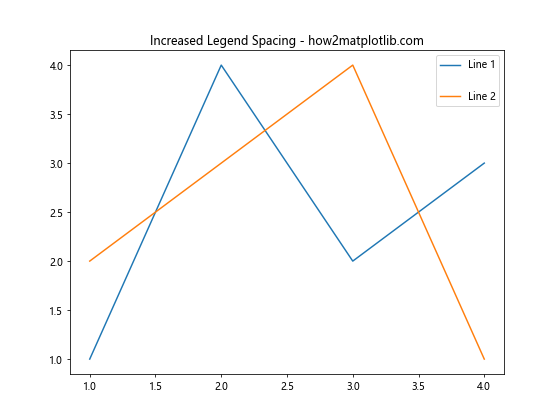
In this example, we set labelspacing=2 in the legend() function, which increases the vertical space between legend entries.
Combining Multiple Legend Size Adjustments
Often, you may want to combine multiple techniques to achieve the desired matplotlib legend size. Let’s look at an example that incorporates several of the methods we’ve discussed:
import matplotlib.pyplot as plt

plt.figure(figsize=(10, 6))
plt.plot([1, 2, 3, 4], [1, 4, 2, 3], label='Line 1', marker='o')
plt.plot([1, 2, 3, 4], [2, 3, 4, 1], label='Line 2', marker='s')
plt.title('Combined Legend Size Adjustments - how2matplotlib.com')
plt.legend(fontsize=14, markerscale=1.5, labelspacing=1.5,
           bbox_to_anchor=(1.05, 1), loc='upper left', borderaxespad=0.)
plt.tight_layout()
plt.show()
Output:
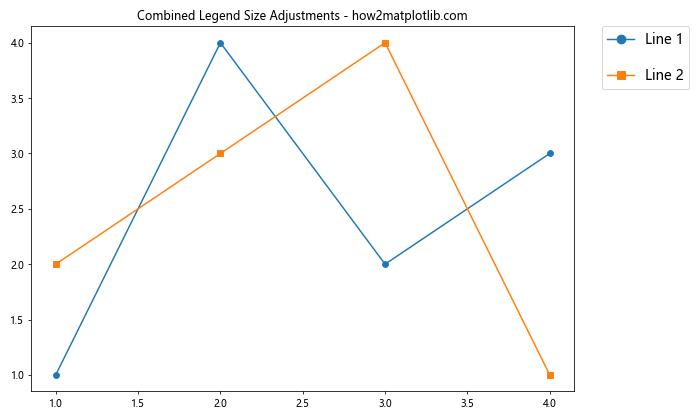
In this comprehensive example, we’ve combined several techniques to customize the matplotlib legend size:
- Increased font size with
fontsize=14 - Enlarged marker size with
markerscale=1.5 - Adjusted spacing between entries with
labelspacing=1.5 - Positioned the legend outside the plot area using
bbox_to_anchorandloc
This approach gives you fine-grained control over various aspects of the legend’s appearance.
Using rcParams to Set Default Legend Size
If you want to set a default matplotlib legend size for all your plots in a script or notebook, you can use Matplotlib’s rcParams. This approach allows you to define global settings for legend properties.
Here’s an example that demonstrates how to use rcParams to set default legend size properties:
import matplotlib.pyplot as plt

plt.rcParams['legend.fontsize'] = 14
plt.rcParams['legend.markerscale'] = 1.5
plt.rcParams['legend.labelspacing'] = 1.2

plt.figure(figsize=(8, 6))
plt.plot([1, 2, 3, 4], [1, 4, 2, 3], label='Line 1', marker='o')
plt.plot([1, 2, 3, 4], [2, 3, 4, 1], label='Line 2', marker='s')
plt.title('Default Legend Size with rcParams - how2matplotlib.com')
plt.legend()
plt.show()
Output:

In this example, we use plt.rcParams to set default values for legend font size, marker scale, and label spacing. These settings will apply to all subsequent plots in your script or notebook unless overridden.
Adjusting Legend Size for Multiple Legends
In some cases, you may have multiple legends in a single plot, each requiring different size adjustments. Matplotlib allows you to customize the size of each legend independently.
Here’s an example that demonstrates how to adjust the size of multiple legends:
import matplotlib.pyplot as plt

fig, ax = plt.subplots(figsize=(10, 6))

line1, = ax.plot([1, 2, 3, 4], [1, 4, 2, 3], label='Line 1', color='blue')
line2, = ax.plot([1, 2, 3, 4], [2, 3, 4, 1], label='Line 2', color='red')
line3, = ax.plot([1, 2, 3, 4], [3, 1, 4, 2], label='Line 3', color='green')

legend1 = ax.legend(handles=[line1, line2], loc='upper left', fontsize=12, title='Legend 1')
ax.add_artist(legend1)

legend2 = ax.legend(handles=[line3], loc='lower right', fontsize=16, title='Legend 2')

plt.title('Multiple Legends with Different Sizes - how2matplotlib.com')
plt.show()
Output:
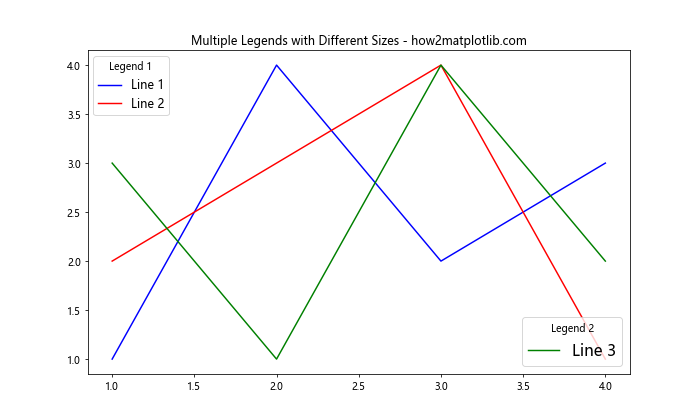
In this example, we create two separate legends with different font sizes and positions. The first legend is added using ax.legend(), and then we use ax.add_artist() to keep it on the plot. The second legend is then added with different properties.
Dynamically Adjusting Legend Size Based on Plot Size
Sometimes, you may want to adjust the matplotlib legend size dynamically based on the size of your plot. This can be particularly useful when creating plots that need to be resized or when working with responsive layouts.
Here’s an example that demonstrates how to adjust the legend size proportionally to the plot size:
import matplotlib.pyplot as plt

def create_plot(width, height):
    fig, ax = plt.subplots(figsize=(width, height))
    ax.plot([1, 2, 3, 4], [1, 4, 2, 3], label='Line 1')
    ax.plot([1, 2, 3, 4], [2, 3, 4, 1], label='Line 2')

    # Calculate font size based on plot dimensions
    font_size = min(width, height) * 1.5

    ax.legend(fontsize=font_size)
    ax.set_title(f'Dynamic Legend Size ({width}x{height}) - how2matplotlib.com')
    plt.show()

# Create plots with different sizes
create_plot(6, 4)
create_plot(8, 6)
create_plot(10, 8)
In this example, we define a function create_plot() that takes width and height parameters. The legend font size is calculated based on the smaller dimension of the plot, ensuring that the legend remains readable across different plot sizes.
Using Style Sheets to Control Legend Size
Matplotlib style sheets provide a convenient way to apply consistent styling across multiple plots, including legend size settings. You can create a custom style sheet to define your preferred legend size properties.
Here’s an example that demonstrates how to create and use a custom style sheet for legend size:
import matplotlib.pyplot as plt

# Create a custom style sheet
plt.style.use({
    'legend.fontsize': 14,
    'legend.markerscale': 1.5,
    'legend.labelspacing': 1.2,
    'legend.borderpad': 0.5,
})

plt.figure(figsize=(8, 6))
plt.plot([1, 2, 3, 4], [1, 4, 2, 3], label='Line 1', marker='o')
plt.plot([1, 2, 3, 4], [2, 3, 4, 1], label='Line 2', marker='s')
plt.title('Legend Size with Custom Style Sheet - how2matplotlib.com')
plt.legend()
plt.show()
Output:
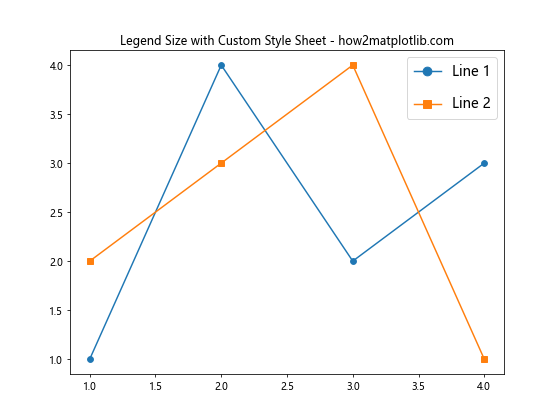
In this example, we create a custom style sheet using a dictionary that defines various legend properties. This approach allows you to maintain consistent legend sizing across multiple plots in your project.
Adjusting Legend Size in Subplots
When working with subplots, you may need to adjust the matplotlib legend size for each subplot individually or create a single legend for all subplots.
Here’s an example that demonstrates both approaches:
import matplotlib.pyplot as plt

fig, (ax1, ax2) = plt.subplots(1, 2, figsize=(12, 5))

# Subplot 1 with individual legend
ax1.plot([1, 2, 3, 4], [1, 4, 2, 3], label='Line 1')
ax1.plot([1, 2, 3, 4], [2, 3, 4, 1], label='Line 2')
ax1.set_title('Subplot 1 - Individual Legend')
ax1.legend(fontsize=10)

# Subplot 2
ax2.plot([1, 2, 3, 4], [3, 1, 4, 2], label='Line 3')
ax2.plot([1, 2, 3, 4], [4, 2, 1, 3], label='Line 4')
ax2.set_title('Subplot 2')

# Create a single legend for both subplots
handles, labels = [], []
for ax in fig.axes:
    for h, l in zip(*ax.get_legend_handles_labels()):
        handles.append(h)
        labels.append(l)

fig.legend(handles, labels, loc='lower center', ncol=4, fontsize=12,
           bbox_to_anchor=(0.5, -0.05), title='Combined Legend')

plt.suptitle('Legend Size in Subplots - how2matplotlib.com', fontsize=16)
plt.tight_layout()
plt.show()
Output:
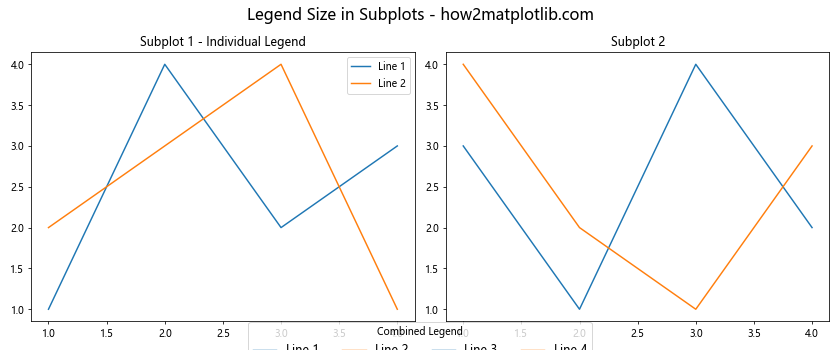
In this example, we create two subplots. The first subplot has its own legend with a smaller font size, while we create a single combined legend for both subplots at the bottom of the figure with a larger font size.
Fine-tuning Legend Size with Padding and Margins
To achieve precise control over matplotlib legend size, you can adjust the padding and margins around the legend text and symbols. This allows you to create more compact or spacious legends as needed.
Here’s an example that demonstrates how to fine-tune legend size using padding and margins:
import matplotlib.pyplot as plt

plt.figure(figsize=(8, 6))
plt.plot([1, 2, 3, 4], [1, 4, 2, 3], label='Line 1')
plt.plot([1, 2, 3, 4], [2, 3, 4, 1], label='Line 2')
plt.title('Fine-tuned Legend Size - how2matplotlib.com')

plt.legend(fontsize=12,
           borderpad=0.2,    # Padding between legend border and content
           labelspacing=0.5, # Vertical spacing between legend entries
           handlelength=1.5, # Length of legend handles
           handletextpad=0.5,# Spacing between handle and text
           borderaxespad=0.2 # Padding between legend and axes
          )

plt.show()
Output:
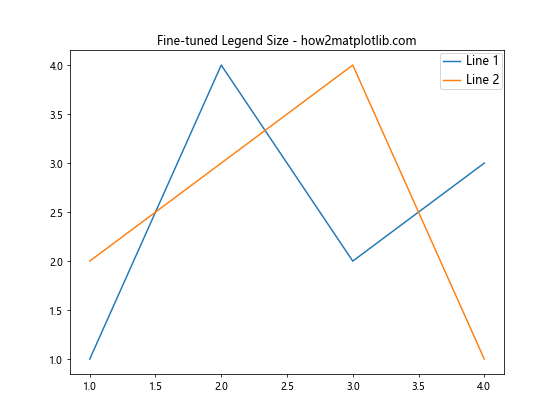
In this example, we use various parameters to fine-tune the legend’s appearance:
borderpad: Controls the padding between the legend border and its contentlabelspacing: Adjusts the vertical spacing between legend entrieshandlelength: Sets the length of the legend handles (markers or lines)handletextpad: Controls the spacing between the handle and the label textborderaxespad: Adjusts the padding between the legend and the axes
By adjusting these parameters, you can create a more compact or spacious legend that fits your specific needs.
Using Text Properties to Customize Legend Text Size
In addition to the fontsize parameter, you can use text properties to have even more control over the size and appearance of legend text.
Here’sHere’s an example that demonstrates how to use text properties to customize legend text size:
import matplotlib.pyplot as plt
from matplotlib.font_manager import FontProperties

plt.figure(figsize=(8, 6))
plt.plot([1, 2, 3, 4], [1, 4, 2, 3], label='Line 1')
plt.plot([1, 2, 3, 4], [2, 3, 4, 1], label='Line 2')
plt.title('Customized Legend Text Size - how2matplotlib.com')

font_prop = FontProperties(size=14, weight='bold', style='italic')
plt.legend(prop=font_prop)

plt.show()
Output:
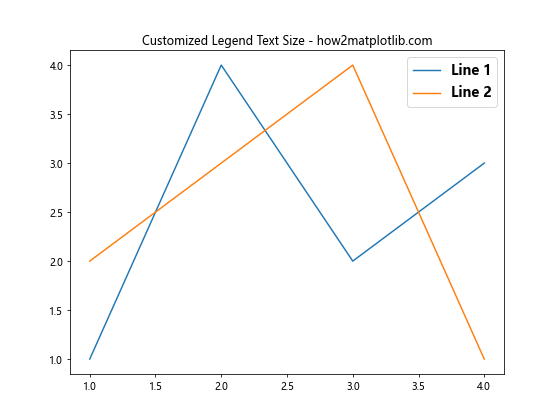
In this example, we use FontProperties to create a custom font configuration for the legend text. This allows us to set not only the size but also other properties like weight and style.
Adjusting Legend Size in 3D Plots
When working with 3D plots in Matplotlib, legend size considerations become even more important due to the added complexity of the visualization. Here’s an example of how to adjust legend size in a 3D plot:
import matplotlib.pyplot as plt
import numpy as np
from mpl_toolkits.mplot3d import Axes3D

fig = plt.figure(figsize=(10, 8))
ax = fig.add_subplot(111, projection='3d')

t = np.linspace(0, 20, 100)
x = np.sin(t)
y = np.cos(t)
z = t

ax.plot(x, y, z, label='3D Curve')
ax.set_xlabel('X axis')
ax.set_ylabel('Y axis')
ax.set_zlabel('Z axis')
ax.set_title('3D Plot with Adjusted Legend Size - how2matplotlib.com')

ax.legend(fontsize=12, markerscale=1.5, bbox_to_anchor=(1.1, 0.5), loc='center left')

plt.tight_layout()
plt.show()
Output:
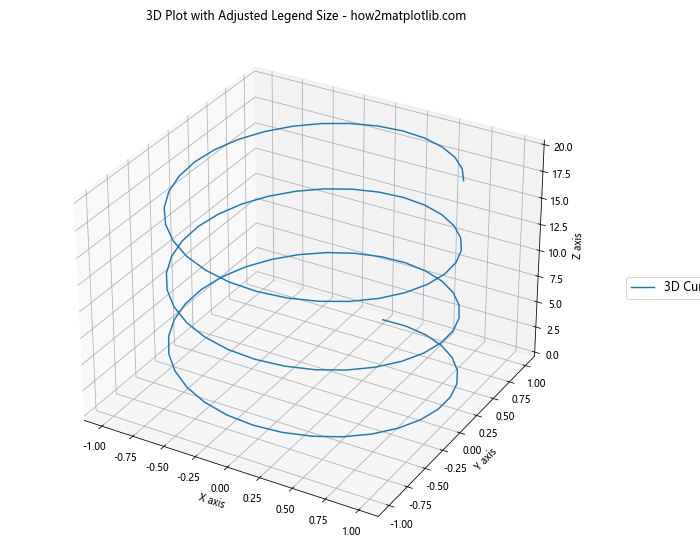
In this 3D plot example, we adjust the legend size using fontsize and markerscale, and position it outside the plot area using bbox_to_anchor to ensure it doesn’t overlap with the 3D visualization.
Creating a Custom Legend with Specific Sizes
Sometimes, you may need to create a custom legend with specific sizes for different elements. Matplotlib allows you to build a legend from scratch using plt.legend() with custom handles and labels.
Here’s an example that demonstrates how to create a custom legend with varying sizes:
import matplotlib.pyplot as plt
import matplotlib.patches as mpatches

fig, ax = plt.subplots(figsize=(8, 6))

# Create custom legend handles
big_square = mpatches.Rectangle((0, 0), 1, 1, facecolor="red")
small_square = mpatches.Rectangle((0, 0), 0.5, 0.5, facecolor="blue")
circle = mpatches.Circle((0.5, 0.5), 0.25, facecolor="green")

# Create the legend with custom handles and labels
legend = ax.legend([big_square, small_square, circle],
                   ['Big Square', 'Small Square', 'Circle'],
                   loc='center',
                   fontsize=12,
                   handlelength=3,
                   handleheight=3,
                   title='Custom Legend',
                   title_fontsize=14)

# Adjust the size of individual legend items
legend._legend_box.align = "left"
for handle in legend.legendHandles:
    handle._sizes = [100]  # Adjust this value to change the size of legend items

ax.set_title('Custom Legend with Specific Sizes - how2matplotlib.com')
ax.axis('off')  # Turn off axis for this example
plt.show()
Output:
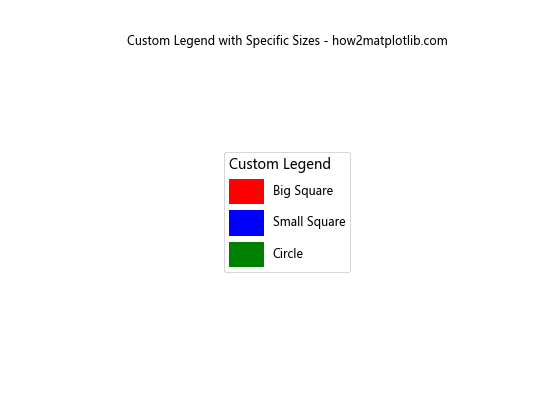
In this example, we create custom legend handles with different shapes and sizes. We then use these handles to create a legend with specific sizes for each item.
Responsive Legend Size for Different Display Devices
When creating visualizations that need to be displayed on various devices with different screen sizes, it’s important to make the matplotlib legend size responsive. Here’s an example of how to adjust legend size based on the figure’s DPI (dots per inch):
import matplotlib.pyplot as plt

def create_responsive_plot(dpi):
    plt.figure(figsize=(8, 6), dpi=dpi)
    plt.plot([1, 2, 3, 4], [1, 4, 2, 3], label='Line 1')
    plt.plot([1, 2, 3, 4], [2, 3, 4, 1], label='Line 2')

    # Calculate font size based on DPI
    font_size = max(8, int(dpi / 10))

    plt.legend(fontsize=font_size)
    plt.title(f'Responsive Legend Size (DPI: {dpi}) - how2matplotlib.com')
    plt.show()

# Create plots for different DPI values
create_responsive_plot(72)   # Low DPI (e.g., low-resolution display)
create_responsive_plot(150)  # Medium DPI
create_responsive_plot(300)  # High DPI (e.g., high-resolution display or print)
In this example, we define a function that creates a plot with a legend size that adapts to the figure’s DPI. This approach ensures that the legend remains readable across different display resolutions.
Animating Legend Size Changes
For dynamic visualizations, you might want to animate changes in matplotlib legend size. Here’s an example that demonstrates how to create an animation where the legend size changes over time:
import matplotlib.pyplot as plt
import matplotlib.animation as animation
import numpy as np

fig, ax = plt.subplots(figsize=(8, 6))

x = np.linspace(0, 2 * np.pi, 100)
line, = ax.plot(x, np.sin(x), label='Sine Wave')

ax.set_xlim(0, 2 * np.pi)
ax.set_ylim(-1.5, 1.5)

legend = ax.legend(fontsize=10)
ax.set_title('Animated Legend Size - how2matplotlib.com')

def update(frame):
    # Update legend font size
    new_size = 10 + 10 * np.sin(frame / 10)
    legend.get_texts()[0].set_fontsize(new_size)

    # Update plot title to show current font size
    ax.set_title(f'Animated Legend Size: {new_size:.1f}pt - how2matplotlib.com')
    return legend,

ani = animation.FuncAnimation(fig, update, frames=100, interval=50, blit=True)
plt.show()
Output:
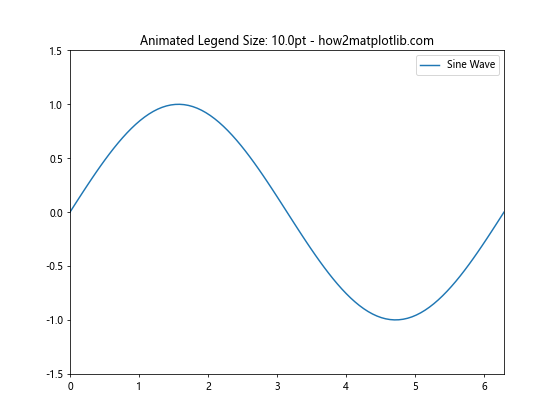
In this example, we create an animation where the legend font size oscillates between 10 and 20 points. The update function changes the font size of the legend text in each frame of the animation.
Matplotlib legend size Conclusion
Mastering matplotlib legend size is crucial for creating clear, informative, and visually appealing data visualizations. Throughout this comprehensive guide, we’ve explored various techniques to customize legend size, from basic adjustments to advanced methods for responsive and dynamic legends.
Key takeaways include:
- Use
fontsizeto adjust the text size of legends. - Modify
markerscaleto change the size of legend markers. - Utilize
bbox_to_anchorandlocto control legend positioning and size. - Adjust spacing and padding for fine-grained control over legend appearance.
- Implement responsive legend sizing for different display resolutions.
- Create custom legends with specific sizes for complex visualizations.
- Use animations to create dynamic legend size changes.
By applying these techniques, you can ensure that your matplotlib legends enhance rather than detract from your visualizations, making your data more accessible and understandable to your audience.
Remember that the perfect matplotlib legend size often depends on the specific context of your visualization, the amount of information you need to convey, and the medium in which your plot will be displayed. Don’t hesitate to experiment with different approaches to find the best solution for your particular use case.