Matplotlib Errorbar
Matplotlib is a popular data visualization library in Python that allows users to create a wide range of charts and plots. One useful feature of Matplotlib is the ability to create error bars on plots using the errorbar function. Error bars are a graphical representation of the variability of data and are commonly used in scientific research to indicate uncertainty in measurements.
In this article, we will explore how to use the errorbar function in Matplotlib to create error bars on various types of plots. We will cover different ways to customize error bars, including changing their style, color, and thickness. We will also discuss how to add error bars to bar plots, scatter plots, and line plots.
Basic Errorbar Plot
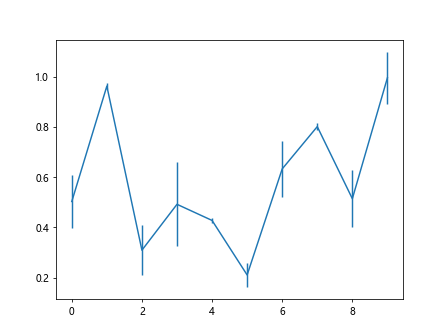
To create a basic errorbar plot in Matplotlib, you can use the errorbar function. The function takes three main arguments: x, y, and yerr. Here is an example of how to create a simple errorbar plot with random data:
import matplotlib.pyplot as plt
import numpy as np

x = np.arange(10)
y = np.random.rand(10)
yerr = np.random.rand(10) * 0.2

plt.errorbar(x, y, yerr=yerr)
plt.show()
Output:

Customizing Error Bars
Changing Error Bar Color and Style
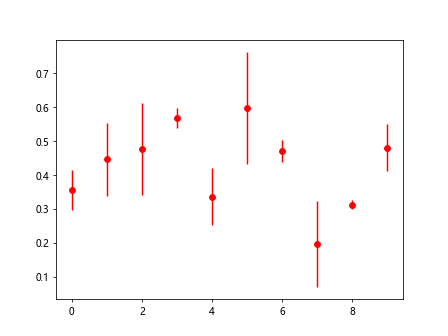
You can customize the color and style of error bars in Matplotlib by using the color and fmt parameters in the errorbar function. The fmt parameter allows you to specify the style of the error bars using format strings. Here is an example of how to change the color and style of error bars:
import matplotlib.pyplot as plt
import numpy as np

x = np.arange(10)
y = np.random.rand(10)
yerr = np.random.rand(10) * 0.2

plt.errorbar(x, y, yerr=yerr, color='red', fmt='o')
plt.show()
Output:

Changing Error Bar Thickness
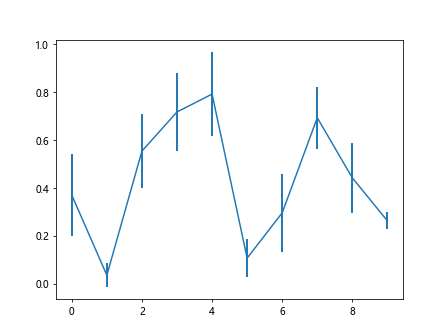
You can also change the thickness of error bars by using the elinewidth parameter in the errorbar function. Here is an example of how to adjust the thickness of error bars:
import matplotlib.pyplot as plt
import numpy as np

x = np.arange(10)
y = np.random.rand(10)
yerr = np.random.rand(10) * 0.2

plt.errorbar(x, y, yerr=yerr, elinewidth=2)
plt.show()
Output:

Adding Error Bars to Different Plot Types
Error Bars on Bar Plots
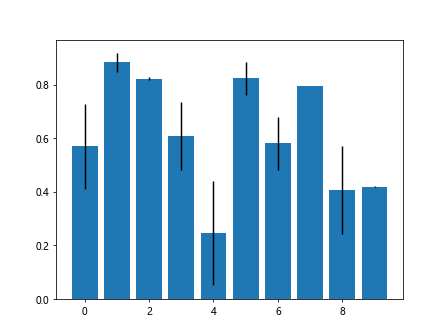
You can easily add error bars to bar plots in Matplotlib using the errorbar function. Here is an example of how to create a bar plot with error bars:
import matplotlib.pyplot as plt
import numpy as np

x = np.arange(10)
y = np.random.rand(10)
yerr = np.random.rand(10) * 0.2

plt.bar(x, y, yerr=yerr)
plt.show()
Output:

Error Bars on Scatter Plots
Error bars can also be added to scatter plots in Matplotlib. Here is an example of how to create a scatter plot with error bars:
import matplotlib.pyplot as plt
import numpy as np

x = np.arange(10)
y = np.random.rand(10)
yerr = np.random.rand(10) * 0.2

plt.scatter(x, y, yerr=yerr)
plt.show()
Error Bars on Line Plots
In addition to bar plots and scatter plots, you can also add error bars to line plots in Matplotlib. Here is an example of how to create a line plot with error bars:
import matplotlib.pyplot as plt
import numpy as np

x = np.arange(10)
y = np.random.rand(10)
yerr = np.random.rand(10) * 0.2

plt.plot(x, y, yerr=yerr)
plt.show()
Conclusion
In this article, we have explored how to use the errorbar function in Matplotlib to create error bars on various types of plots. We have covered different ways to customize error bars, including changing their color, style, and thickness. By following the examples provided in this article, you should be able to easily add error bars to your Matplotlib plots and effectively communicate the uncertainty in your data.