Matplotlib Annotation Box
Matplotlib is a popular plotting library in Python, known for its versatility and powerful features. One useful feature of Matplotlib is the ability to add annotation boxes to your plots. Annotation boxes are a great way to highlight important information on your plots or provide additional context to your data. In this article, we will explore how to use annotation boxes in Matplotlib with detailed examples.
Basic Annotation Box
To add a basic annotation box to a plot in Matplotlib, you can use the annotate function. Here is a simple example:
import matplotlib.pyplot as plt

x = [1, 2, 3, 4, 5]
y = [1, 4, 9, 16, 25]

plt.plot(x, y)
plt.annotate('Max Value', (5, 25), xytext=(4, 20),
             arrowprops=dict(facecolor='black', shrink=0.05))
plt.show()
Output:
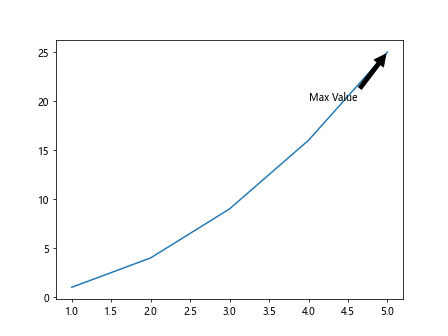
In this example, we are adding an annotation box with the text “Max Value” to the point (5, 25) on the plot. The xytext parameter specifies the position of the text, and arrowprops is used to customize the appearance of the arrow connecting the annotation to the point.
Customizing Annotation Box
You can customize the appearance of the annotation box in Matplotlib by adjusting various properties such as text color, background color, font size, and border style. Here is an example:
import matplotlib.pyplot as plt

x = [1, 2, 3, 4, 5]
y = [1, 4, 9, 16, 25]

plt.plot(x, y)
plt.annotate('Min Value', (1, 1), xytext=(2, 5),
             arrowprops=dict(facecolor='red', shrink=0.05),
             fontsize=12, color='blue', bbox=dict(facecolor='yellow', edgecolor='green', boxstyle='round,pad=0.5'))
plt.show()
Output:
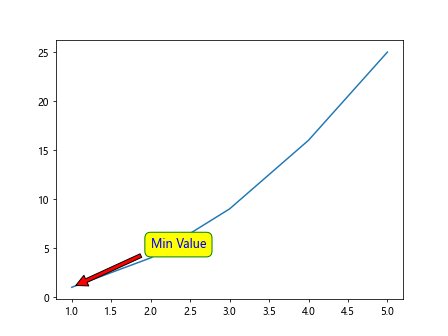
In this example, we are customizing the appearance of the annotation box by setting the font size to 12, text color to blue, background color to yellow, edge color to green, and using a rounded box style.
Adding Annotations to Subplots
You can also add annotation boxes to subplots in Matplotlib. Here is an example of adding annotations to multiple subplots:
import matplotlib.pyplot as plt

x = [1, 2, 3, 4, 5]
y1 = [1, 4, 9, 16, 25]
y2 = [1, 2, 3, 4, 5]

fig, ax = plt.subplots(1, 2)
ax[0].plot(x, y1)
ax[0].annotate('Max Value', (5, 25), xytext=(4, 20),
               arrowprops=dict(facecolor='black', shrink=0.05))

ax[1].plot(x, y2)
ax[1].annotate('Min Value', (1, 1), xytext=(2, 5),
               arrowprops=dict(facecolor='red', shrink=0.05),
               fontsize=12, color='blue', bbox=dict(facecolor='yellow', edgecolor='green', boxstyle='round,pad=0.5'))

plt.show()
Output:
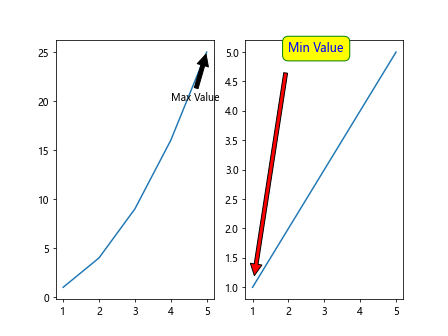
This example demonstrates how to add annotations to two subplots using the subplots function to create a figure with multiple axes.
Annotation Box with Arrows
You can add arrows to annotation boxes in Matplotlib to point to specific data points on the plot. Here is an example of adding an arrow to an annotation box:
import matplotlib.pyplot as plt

x = [1, 2, 3, 4, 5]
y = [1, 4, 9, 16, 25]

plt.plot(x, y)
plt.annotate('Mid Value', (3, 9), xytext=(2, 13),
             arrowprops=dict(arrowstyle='->', connectionstyle='arc3,rad=0.5', lw=2))
plt.show()
Output:
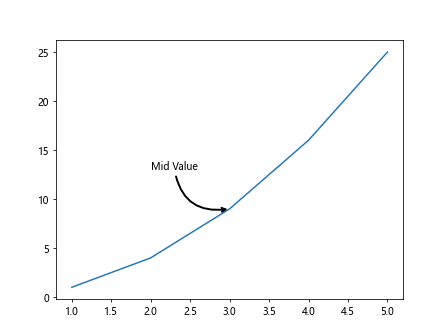
In this example, we are adding an arrow to the annotation box using the arrowstyle -> and customizing the arrow connection style with arc3,rad=0.5.
Multi-line Annotation Box
You can create multi-line annotation boxes in Matplotlib by using newline characters in the text string. Here is an example:
import matplotlib.pyplot as plt

x = [1, 2, 3, 4, 5]
y = [1, 4, 9, 16, 25]

plt.plot(x, y)
plt.annotate('Multi\nLine\nText', (3, 9), xytext=(4, 15),
             arrowprops=dict(facecolor='black', shrink=0.05))
plt.show()
Output:
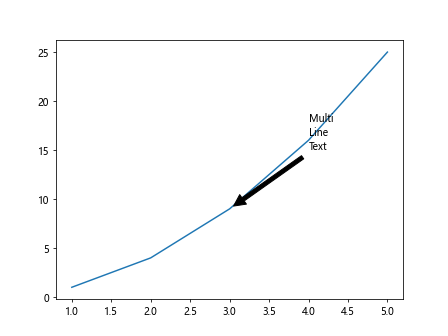
In this example, we are creating a multi-line annotation box with the text “Multi”, “Line”, and “Text” on separate lines by using the newline character \n.
Annotation Box with Rotation
You can rotate the text in an annotation box in Matplotlib to change its orientation. Here is an example of adding a rotated annotation box:
import matplotlib.pyplot as plt

x = [1, 2, 3, 4, 5]
y = [1, 4, 9, 16, 25]

plt.plot(x, y)
plt.annotate('Rotated Text', (3, 9), xytext=(2, 13),
             arrowprops=dict(facecolor='black', shrink=0.05),
             rotation=45)
plt.show()
Output:
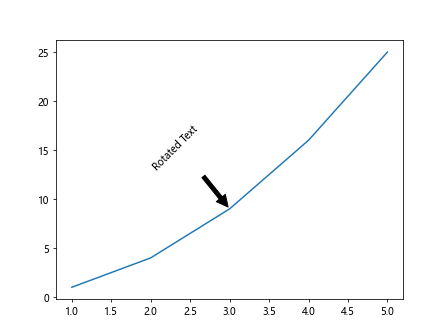
In this example, we are rotating the text in the annotation box by 45 degrees using the rotation parameter.
Annotation Box with Text Alignment
You can align the text in an annotation box in Matplotlib using the horizontalalignment and verticalalignment parameters. Here is an example:
import matplotlib.pyplot as plt

x = [1, 2, 3, 4, 5]
y = [1, 4, 9, 16, 25]

plt.plot(x, y)
plt.annotate('Aligned Text', (3, 9), xytext=(2, 13),
             arrowprops=dict(facecolor='black', shrink=0.05),
             horizontalalignment='right', verticalalignment='bottom')
plt.show()
Output:
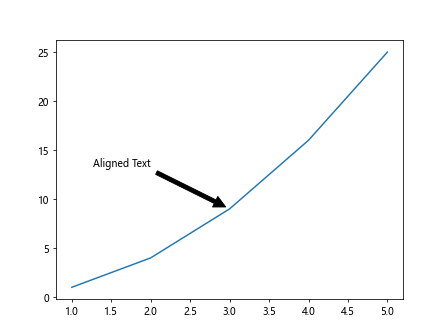
In this example, we are aligning the text in the annotation box to the right horizontally and to the bottom vertically using the horizontalalignment and verticalalignment parameters.
Annotation Box with Connectionstyle
You can customize the connection style of the arrow in an annotation box in Matplotlib using the connectionstyle parameter. Here is an example:
import matplotlib.pyplot as plt

x = [1, 2, 3, 4, 5]
y = [1, 4, 9, 16, 25]

plt.plot(x, y)
plt.annotate('Connected Text', (3, 9), xytext=(2, 13),
             arrowprops=dict(facecolor='black', shrink=0.05),
             connectionstyle='arc3,rad=0.3')
plt.show()
In this example, we are customizing the connection style of the arrow in the annotation box with arc3,rad=0.3.
Draggable Annotation Box
You can make the annotation box draggable in Matplotlib by using the DraggableAnnotation class from the mpldatacursor module. Here is an example:
import matplotlib.pyplot as plt
from mpldatacursor import DraggableAnnotation

x = [1, 2, 3, 4, 5]
y = [1, 4, 9, 16, 25]

fig, ax = plt.subplots()
ax.plot(x, y)

da = DraggableAnnotation(ax.annotate('Draggable Text', (3, 9), xytext=(2, 13),
                                    arrowprops=dict(facecolor='black', shrink=0.05)))
plt.show()
In this example, we are making the annotation box draggable by creating an instance of DraggableAnnotation with the annotate function.
Annotation Box with LaTeX
You can use LaTeX math expressions in annotation boxes in Matplotlib by setting the usetex parameter to True. Here is an example:
import matplotlib.pyplot as plt

x = [1, 2, 3, 4, 5]
y = [1, 4, 9, 16, 25]

plt.plot(x, y)
plt.annotate(r'$\sum_{i=1}^{5} x_i$', (3, 9), xytext=(2, 13),
             arrowprops=dict(facecolor='black', shrink=0.05), usetex=True)
plt.show()
In this example, we are using a LaTeX math expression to display the sum of x values in the annotation box by setting usetex=True.
Annotation Box with Arrow Position
You can control the position of the arrow in an annotation box in Matplotlib by customizing the arrowstyle and connectionstyle parameters. Here is an example:
import matplotlib.pyplot as plt

x = [1, 2, 3, 4, 5]
y = [1, 4, 9, 16, 25]

plt.plot(x, y)
plt.annotate('Arrow Position', (3, 9), xytext=(2, 13),
             arrowprops=dict(arrowstyle='->', connectionstyle='angle,angleA=90,angleB=0,rad=10'))
plt.show()
Output:
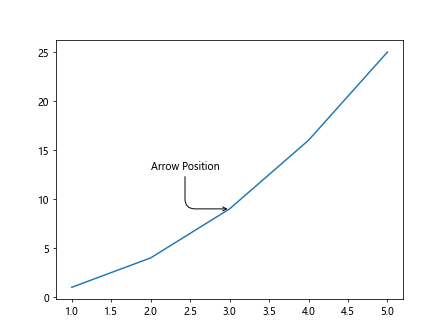
In this example, we are controlling the position of the arrow in the annotation box by setting the connectionstyle parameter to angle,angleA=90,angleB=0,rad=10.
Annotation Box with Arrow Offset
You can adjust the offset of the arrow in an annotation box in Matplotlib by customizing the arrowprops parameter. Here is an example:
import matplotlib.pyplot as plt

x = [1, 2, 3, 4, 5]
y = [1, 4, 9, 16, 25]

plt.plot(x, y)
plt.annotate('Arrow Offset', (3, 9), xytext=(2, 13),
             arrowprops=dict(arrowstyle='->', connectionstyle='arc3,rad=0.5', lw=2, relpos=(0.4,0.4)))
plt.show()
Output:
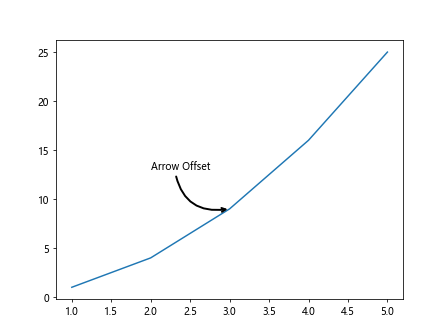
In this example, we are adjusting the offset of the arrow in the annotation box by setting the relpos parameter to (0.4,0.4).
Annotation Box with Fancy Arrow Patch
You can create a fancy arrow patch in an annotation box in Matplotlib by customizing the arrowprops parameter with FancyArrowPatch. Here is an example:
import matplotlib.pyplot as plt
from matplotlib.patches import FancyArrowPatch

x = [1, 2, 3, 4, 5]
y = [1, 4, 9, 16, 25]

plt.plot(x, y)
arrow = FancyArrowPatch((2, 5), (1, 1), arrowstyle='fancy', lw=2, color='red')
plt.gca().add_patch(arrow)
plt.text(1, 1, 'Fancy Arrow', fontsize=12, color='blue', bbox=dict(facecolor='yellow', edgecolor='green'))
plt.show()
Output:
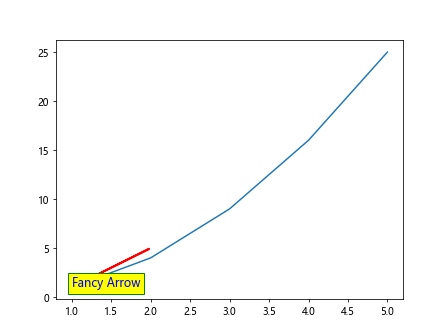
In this example, we are creating a fancy arrow patch with a custom arrowstyle, line width, and color to display the text “Fancy Arrow” on the plot.
Conclusion
In this article, we have explored how to use annotation boxes in Matplotlib to add informative text and highlights to your plots. We covered various customization options such as text alignment, rotation, arrow styles, connection styles, and LaTeX math expressions. Annotation boxes are a powerful tool for enhancing the visual presentation of your data and providing additional context to your audience. Experiment with the examples provided to create visually appealing and informative plots using Matplotlib’s annotation box feature.