Using Matplotlib’s ax.annotate
Matplotlib is a powerful library for creating visualizations in Python. One useful feature it offers is the ability to add annotations to plots using the annotate method of an Axes object. In this article, we will explore how to use the annotate method to add annotations to different types of plots.
1. Basic Annotation
import matplotlib.pyplot as plt

fig, ax = plt.subplots()
ax.plot([1, 2, 3, 4], [1, 4, 9, 16])

ax.annotate('Annotation Example', xy=(3, 9), xytext=(2, 12),
            arrowprops=dict(facecolor='black', shrink=0.05))

plt.show()
Output:
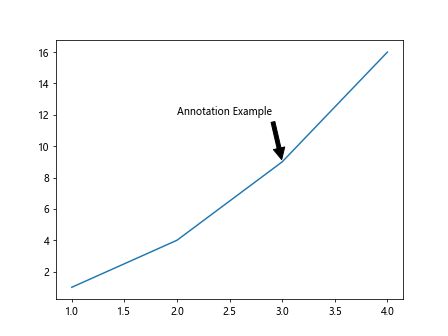
In this example, we create a simple plot and add an annotation at the point (3, 9). The xy parameter specifies the point to annotate, and xytext sets the position of the text. The arrowprops argument customizes the arrow connecting the annotation to the point.
2. Text and Arrow Styling
import matplotlib.pyplot as plt

fig, ax = plt.subplots()
ax.plot([1, 2, 3, 4], [1, 4, 9, 16])

ax.annotate('Bold and Red Text', xy=(2, 4), xytext=(1, 6),
            arrowprops=dict(arrowstyle='->', connectionstyle='arc3,rad=.5'),
            fontsize=12, fontweight='bold', color='red')

plt.show()
Output:
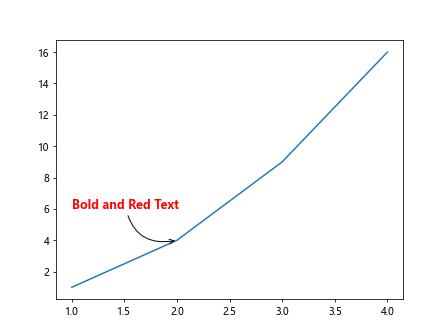
In this example, we demonstrate how to style the text and the arrow of an annotation. The fontweight argument can be used to make the text bold, while the color argument changes the text color.
3. Annotation with Custom Arrow
import matplotlib.pyplot as plt

fig, ax = plt.subplots()
ax.plot([1, 2, 3, 4], [1, 4, 9, 16])

ax.annotate('Custom Arrow', xy=(3, 9), xytext=(2, 12),
            arrowprops=dict(arrowstyle='-|>', lw=2, color='green'))

plt.show()
Output:
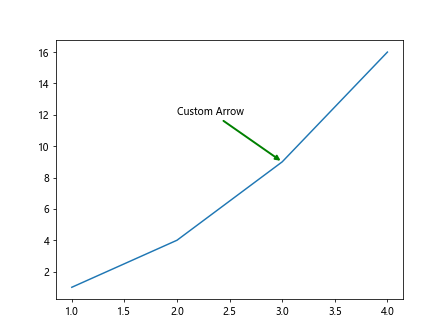
In this example, we add an annotation with a custom arrow style. The arrowstyle argument allows you to specify the style of the arrow, and lw sets the line width of the arrow.
4. Annotation with Box
import matplotlib.pyplot as plt

fig, ax = plt.subplots()
ax.plot([1, 2, 3, 4], [1, 4, 9, 16])

ax.annotate('Boxed Annotation', xy=(2, 4), xytext=(1, 6),
            arrowprops=dict(arrowstyle='->'),
            bbox=dict(boxstyle='round,pad=0.5', fc='yellow', ec='blue', lw=2))

plt.show()
Output:
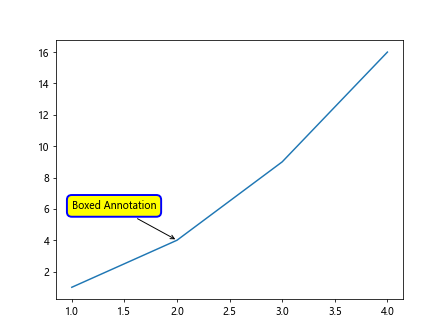
In this example, we create an annotation with a box around the text. The bbox argument allows you to customize the box style, fill color (fc), edge color (ec), and line width (lw).
5. Multiple Annotations
import matplotlib.pyplot as plt

fig, ax = plt.subplots()
ax.plot([1, 2, 3, 4], [1, 4, 9, 16])

ax.annotate('First Annotation', xy=(2, 4), xytext=(1, 6),
            arrowprops=dict(arrowstyle='->'))

ax.annotate('Second Annotation', xy=(3, 9), xytext=(2, 12),
            arrowprops=dict(arrowstyle='->'))

plt.show()
Output:
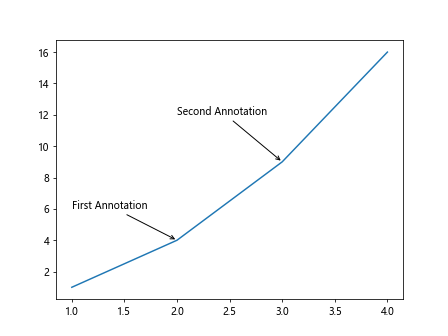
In this example, we add multiple annotations to the plot at different points. Each annotate function call creates a new annotation with its own text and position.
6. Annotation with Vertical Text Alignment
import matplotlib.pyplot as plt

fig, ax = plt.subplots()
ax.plot([1, 2, 3, 4], [1, 4, 9, 16])

ax.annotate('Vertical Alignment', xy=(2, 4), xytext=(1, 6),
            arrowprops=dict(arrowstyle='->'),
            verticalalignment='top')

plt.show()
Output:
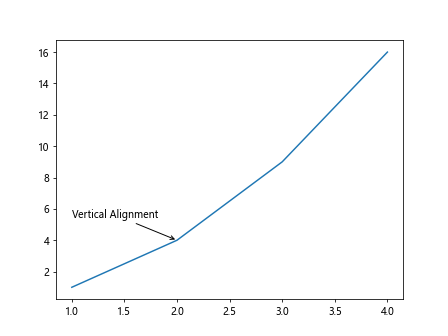
This example demonstrates how to align the text vertically within an annotation. The verticalalignment argument can be set to top, bottom, center, baseline, or center_baseline.
7. Annotation with Horizontal Text Alignment
import matplotlib.pyplot as plt

fig, ax = plt.subplots()
ax.plot([1, 2, 3, 4], [1, 4, 9, 16])

ax.annotate('Horizontal Alignment', xy=(2, 4), xytext=(1, 6),
            arrowprops=dict(arrowstyle='->'),
            horizontalalignment='right')

plt.show()
Output:
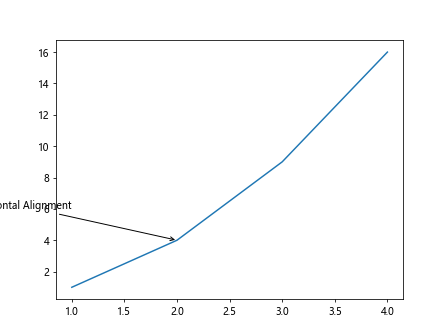
Similarly, you can align the text horizontally within an annotation using the horizontalalignment argument with values such as left, center, or right.
8. Annotation with Background Color
import matplotlib.pyplot as plt

fig, ax = plt.subplots()
ax.plot([1, 2, 3, 4], [1, 4, 9, 16])

ax.annotate('Background Color', xy=(2, 4), xytext=(1, 6),
            bbox=dict(boxstyle='round', facecolor='cyan', edgecolor='none'),
            arrowprops=dict(arrowstyle='->'))

plt.show()
Output:
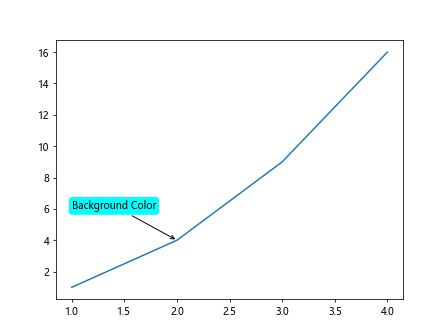
In this example, we add a background color to the annotation text by setting the facecolor and edgecolor of the bounding box.
9. Using LaTeX in Annotations
import matplotlib.pyplot as plt

fig, ax = plt.subplots()
ax.plot([1, 2, 3, 4], [1, 4, 9, 16])

ax.annotate(r'$\sum_{i=1}^n x_i$', xy=(3, 9), xytext=(2, 12),
            fontsize=16, color='purple',
            arrowprops=dict(arrowstyle='->'))

plt.show()
Output:
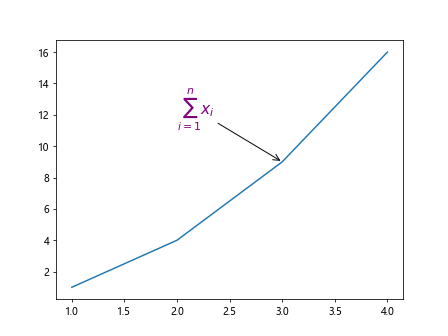
Matplotlib supports LaTeX formatting in annotations, allowing you to include mathematical symbols and equations within the text.
10. Rotated Annotation Text
import matplotlib.pyplot as plt

fig, ax = plt.subplots()
ax.plot([1, 2, 3, 4], [1, 4, 9, 16])

ax.annotate('Rotated Text', xy=(2, 4), xytext=(1, 6),
            rotation=45,
            arrowprops=dict(arrowstyle='->'))

plt.show()
Output:
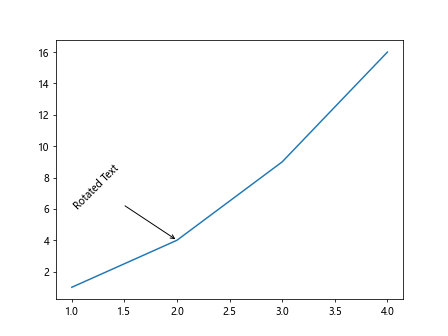
You can rotate the annotation text using the rotation argument, which specifies the angle of rotation in degrees.
Conclusion
In this article, we have explored various ways to customize annotations in Matplotlib using the ax.annotate method. From styling text and arrows to adding boxes and incorporating LaTeX, there are endless possibilities for enhancing your visualizations with annotations. Experiment with different parameters and styles to create informative and visually appealing plots.