Markersize in Matplotlib
When creating plots using Matplotlib, markers are used to represent data points on the graph. The size of these markers can be customized using the markersize parameter. In this article, we will explore how to adjust the markersize in Matplotlib to create visually appealing and informative plots.
Changing Markersize
To change the size of markers in Matplotlib, we can specify the markersize parameter when plotting data points. This parameter accepts a numerical value that determines the size of the markers in points.
import matplotlib.pyplot as plt
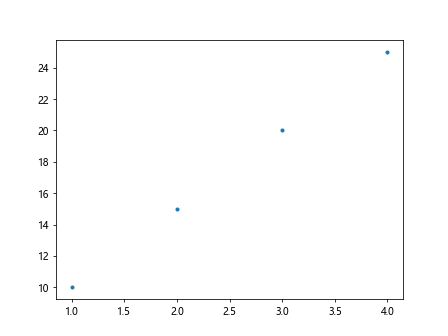
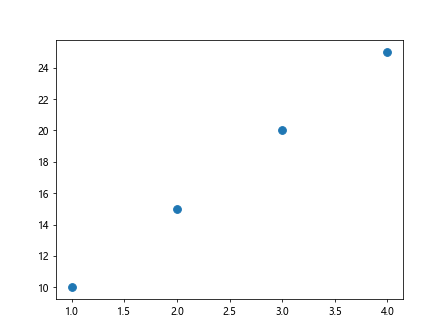
# Create a simple scatter plot with markersize 10
plt.scatter([1, 2, 3, 4], [10, 15, 20, 25], s=10)
plt.show()
Output:
Customizing Markersize in Different Plots
Marketsize can be customized in various types of plots in Matplotlib, such as scatter plots, line plots, and bar plots. Let’s look at examples of changing markersize in different types of plots.
Scatter Plots
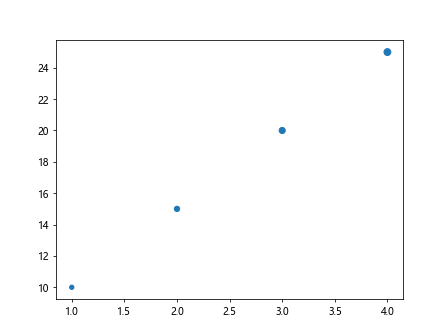
In scatter plots, markersize controls the size of individual data points. We can use different markersizes for different data points in the plot.
import matplotlib.pyplot as plt

# Scatter plot with different markersizes
plt.scatter([1, 2, 3, 4], [10, 15, 20, 25], s=[20, 30, 40, 50])
plt.show()
Output:
Line Plots
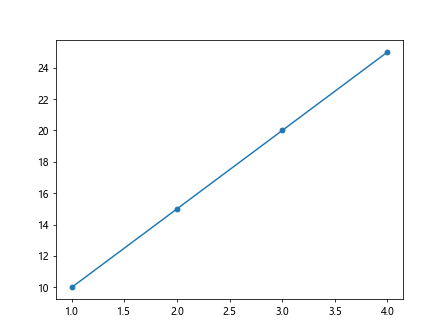
In line plots, the markersize controls the size of the markers placed on the data points.
import matplotlib.pyplot as plt

# Line plot with markersize 5
plt.plot([1, 2, 3, 4], [10, 15, 20, 25], marker='o', markersize=5)
plt.show()
Output:
Bar Plots
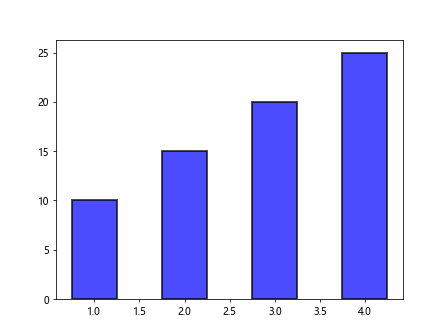
In bar plots, the markersize parameter can be used to adjust the thickness of the bars.
import matplotlib.pyplot as plt

# Bar plot with markersize 8
plt.bar([1, 2, 3, 4], [10, 15, 20, 25], width=0.5, align='center', color='blue', edgecolor='black', linewidth=2, alpha=0.7)
plt.show()
Output:
Changing Markersize Globally
We can also change the default markersize globally for all plots in Matplotlib. This can be done by setting the rcParams at the beginning of the script.
import matplotlib.pyplot as plt
plt.rcParams['lines.markersize'] = 8

# Create a scatter plot with default markersize set to 8
plt.scatter([1, 2, 3, 4], [10, 15, 20, 25])
plt.show()
Output:
Combining Markersize with Other Parameters
In addition to markersize, we can combine it with other parameters to further customize the appearance of markers in Matplotlib. For example, we can change the color and shape of markers along with adjusting the size.
import matplotlib.pyplot as plt
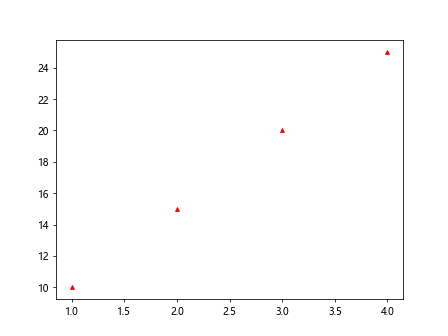
# Scatter plot with red triangles and markersize 15
plt.scatter([1, 2, 3, 4], [10, 15, 20, 25], s=15, color='red', marker='^')
plt.show()
Output:
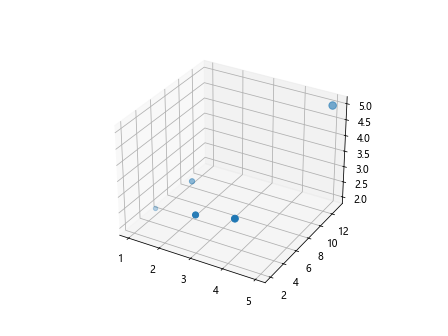
Markersize in 3D Plots
Markersize can also be adjusted in 3D plots in Matplotlib. The s parameter can be used to control the size of markers in 3D scatter plots.
from mpl_toolkits.mplot3d import Axes3D
import matplotlib.pyplot as plt

fig = plt.figure()
ax = fig.add_subplot(111, projection='3d')

x = [1, 2, 3, 4, 5]
y = [5, 6, 2, 3, 13]
z = [2, 3, 3, 3, 5]
s = [20, 30, 40, 50, 60]

# 3D scatter plot with markersize based on 's'
ax.scatter(x, y, z, s=s)
plt.show()
Output:
Conclusion
In this article, we explored how to customize markersize in Matplotlib to enhance the appearance of plots. By adjusting the markersize parameter, we can control the size of markers in various types of plots, such as scatter plots, line plots, and bar plots. Additionally, we learned how to change the default markersize globally and combine markersize with other parameters to create visually appealing plots. Markersize plays a crucial role in visualizing data effectively, and mastering its usage in Matplotlib can significantly improve the quality of plots.