Logarithmic Scale in Matplotlib
Matplotlib is a popular data visualization library in Python that allows users to create various types of plots and charts. One useful feature of Matplotlib is the ability to set logarithmic scales on plots, which is particularly helpful when dealing with data that covers a wide range of values. In this article, we will explore how to use logarithmic scales in Matplotlib.
Basic Line Plot with Logarithmic Scale
import matplotlib.pyplot as plt
import numpy as np

x = np.linspace(1, 10, 100)
y = np.exp(x)

plt.plot(x, y)
plt.yscale('log')
plt.show()
Output:
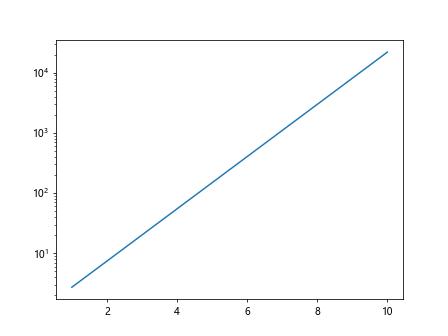
In this example, we create a basic line plot using NumPy to generate exponential data. We then set the y-axis to use a logarithmic scale by calling the plt.yscale('log') function.
Logarithmic Scale on Axes
import matplotlib.pyplot as plt
import numpy as np

x = np.linspace(1, 10, 100)
y = np.exp(x)

fig, ax = plt.subplots()
ax.plot(x, y)
ax.set_yscale('log')
plt.show()
Output:
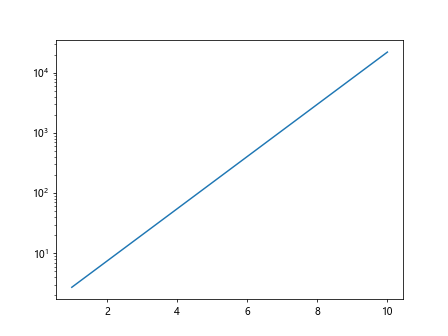
In this example, we create the plot using the object-oriented approach in Matplotlib. We set the y-axis of the axes object ax to use a logarithmic scale using the set_yscale('log') method.
Scatter Plot with Logarithmic Scale
import matplotlib.pyplot as plt
import numpy as np

x = np.random.rand(100) * 100
y = np.random.rand(100) * 100

plt.scatter(x, y)
plt.xscale('log')
plt.yscale('log')
plt.show()
Output:
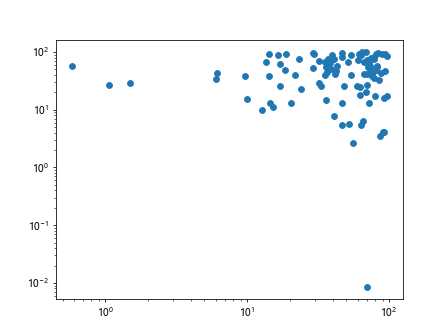
This example demonstrates how to create a scatter plot with logarithmic scales on both the x-axis and y-axis. We use random values generated by NumPy to create the data points.
Logarithmic Scale for Histogram
import matplotlib.pyplot as plt
import numpy as np

data = np.random.exponential(scale=1, size=1000)

plt.hist(data, bins=30)
plt.yscale('log')
plt.show()
Output:
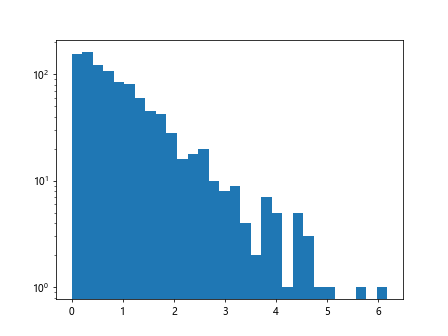
In this example, we create a histogram of exponentially distributed data. We set the y-axis to use a logarithmic scale by calling the plt.yscale('log') function.
Logarithmic Scale for Error Bars
import matplotlib.pyplot as plt
import numpy as np

x = np.arange(1, 11)
y = np.log10(x)
errors = np.random.rand(10) * 0.1

plt.errorbar(x, y, yerr=errors, fmt='o')
plt.yscale('log')
plt.show()
Output:
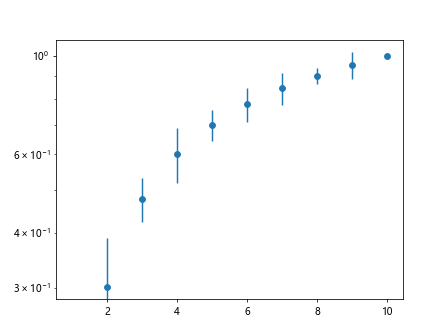
This example shows how to create a line plot with error bars and set the y-axis to use a logarithmic scale. The plt.errorbar() function is used to plot the data points with error bars.
Logarithmic Scale for Heatmap
import matplotlib.pyplot as plt
import numpy as np

data = np.random.rand(10, 10)

plt.imshow(data, cmap='hot', interpolation='nearest')
plt.colorbar()
plt.yscale('log')
plt.show()
Output:
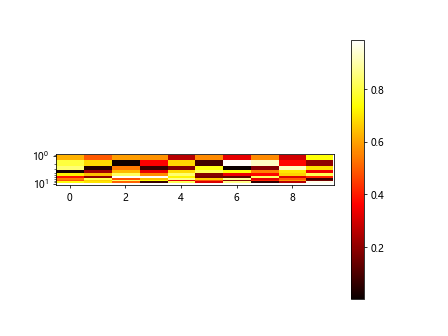
In this example, we create a heatmap using random data and set the y-axis to use a logarithmic scale. The plt.imshow() function is used to display the heatmap.
Logarithmic Scale for Polar Plot
import matplotlib.pyplot as plt
import numpy as np

theta = np.linspace(0, 2*np.pi, 100)
r = np.log10(theta)

plt.polar(theta, r)
plt.yscale('log')
plt.show()
This example demonstrates how to create a polar plot with a logarithmic scale on the radial axis. We use NumPy to generate the values for theta and r.
Logarithmic Scale in Subplots
import matplotlib.pyplot as plt
import numpy as np

x = np.linspace(1, 10, 100)
y1 = np.exp(x)
y2 = np.exp(2*x)

fig, axs = plt.subplots(1, 2)
axs[0].plot(x, y1)
axs[0].set_yscale('log')
axs[1].plot(x, y2)
axs[1].set_yscale('log')

plt.show()
Output:
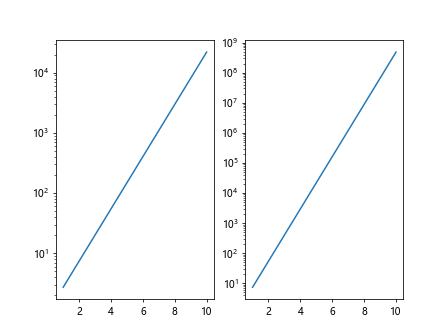
In this example, we create two subplots with different exponential data and set the y-axis of each subplot to use a logarithmic scale. The subplots are created using the plt.subplots() function.
Logarithmic Scale for Bar Chart
import matplotlib.pyplot as plt
import numpy as np

x = np.arange(1, 6)
y = np.log10(x)

plt.bar(x, y)
plt.yscale('log')
plt.show()
Output:
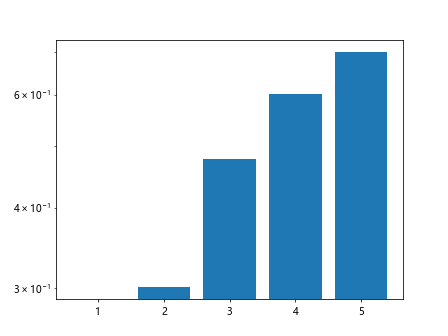
This example shows how to create a bar chart with logarithmic scales on the y-axis. We use NumPy to generate the values for the x-axis and y-axis.
Customizing Logarithmic Scale Ticks
import matplotlib.pyplot as plt
import numpy as np
from matplotlib.ticker import ScalarFormatter

x = np.arange(1, 11)
y = np.power(2, x)

plt.plot(x, y)
plt.yscale('log')
plt.gca().yaxis.set_major_formatter(ScalarFormatter())
plt.show()
Output:
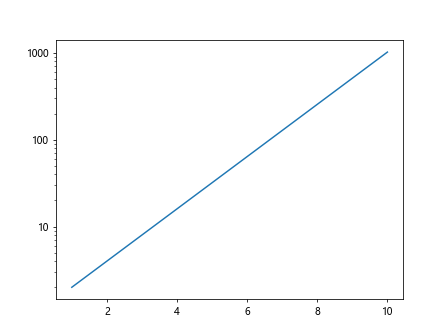
This example demonstrates how to customize the ticks on the y-axis of a plot with a logarithmic scale. We use a ScalarFormatter to adjust the tick labels.
Conclusion
In this article, we have explored how to use logarithmic scales in Matplotlib for various types of plots including line plots, scatter plots, histograms, error bars, heatmaps, polar plots, subplots, bar charts, and customizing tick labels. Logarithmic scales are useful when dealing with data that spans multiple orders of magnitude. By understanding how to set logarithmic scales in Matplotlib, you can effectively visualize and analyze your data.