Heatmap plt
A heatmap is a graphical representation of data where the individual values contained in a matrix are represented as colors. It is a popular way to visualize data in a matrix form and can be particularly useful for showing patterns in large datasets. In this article, we will explore how to create heatmaps using the matplotlib library in Python.
Basic Heatmap
To create a basic heatmap using matplotlib, we can use the imshow function along with a colormap. Here is an example of how to create a simple heatmap:
import matplotlib.pyplot as plt
import numpy as np

# Create a random matrix
data = np.random.rand(10, 10)

plt.imshow(data, cmap='hot', interpolation='nearest')
plt.colorbar()
plt.show()
Output:
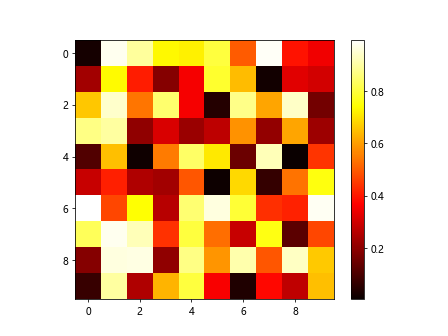
In the example above, we first generate a random 10×10 matrix using np.random.rand(). We then use plt.imshow() to display the matrix with a ‘hot’ colormap and show a colorbar with plt.colorbar().
Customizing Heatmaps
We can further customize our heatmaps by adjusting various parameters such as the color scheme, aspect ratio, and annotations. Here is an example that demonstrates how to customize a heatmap:
import matplotlib.pyplot as plt
import numpy as np

data = np.random.rand(5, 5)

plt.imshow(data, cmap='coolwarm', interpolation='nearest', aspect='auto')
plt.colorbar()
plt.xlabel('X axis')
plt.ylabel('Y axis')
plt.title('Customized Heatmap')
plt.show()
Output:
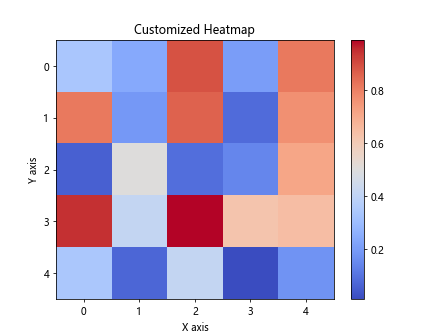
In this example, we use a ‘coolwarm’ colormap, set the aspect ratio to ‘auto’, add labels for the X and Y axes, and include a title for the heatmap.
Clustered Heatmap
A common use case for heatmaps is to visualize hierarchical clustering results. We can achieve this by reordering the rows and columns of the matrix to highlight patterns. Here is an example of a clustered heatmap:
import matplotlib.pyplot as plt
import numpy as np

data = np.random.rand(8, 8)

plt.imshow(data, cmap='viridis', interpolation='nearest')
plt.colorbar()
plt.title('Clustered Heatmap')
plt.show()
Output:
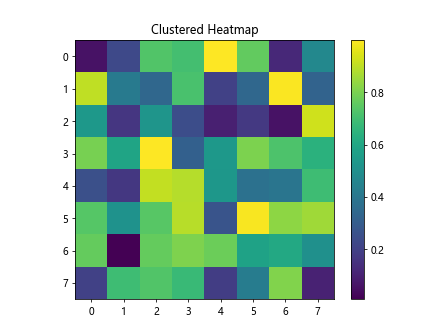
In this example, we create a random 8×8 matrix and display it with a ‘viridis’ colormap. The rows and columns are not reordered in this example, but one can apply clustering algorithms to rearrange them accordingly.
Subplots with Heatmaps
Sometimes we may want to create multiple heatmaps within the same figure. We can achieve this using subplots in matplotlib. Here is an example of how to create subplots with heatmaps:
import matplotlib.pyplot as plt
import numpy as np

data1 = np.random.rand(5, 5)
data2 = np.random.rand(5, 5)

plt.figure(figsize=(10, 5))

# Subplot 1
plt.subplot(1, 2, 1)
plt.imshow(data1, cmap='plasma', interpolation='nearest')
plt.colorbar()
plt.title('Heatmap 1')

# Subplot 2
plt.subplot(1, 2, 2)
plt.imshow(data2, cmap='magma', interpolation='nearest')
plt.colorbar()
plt.title('Heatmap 2')

plt.tight_layout()
plt.show()
Output:
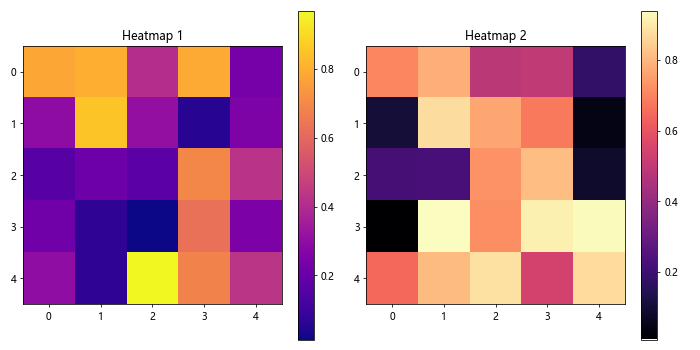
In this example, we create two random 5×5 matrices and display them in a side-by-side layout using subplots. We use different colormaps (‘plasma’ and ‘magma’) for each heatmap to distinguish between them.
Annotated Heatmap
Adding annotations to a heatmap can provide additional information or context to the data being visualized. Here is an example of how to create an annotated heatmap:
import matplotlib.pyplot as plt
import numpy as np

data = np.random.rand(5, 5)

plt.imshow(data, cmap='inferno', interpolation='nearest')

for i in range(5):
    for j in range(5):
        plt.text(j, i, f'{data[i, j]:.2f}', ha='center', va='center', color='white')

plt.colorbar()
plt.title('Annotated Heatmap')
plt.show()
Output:
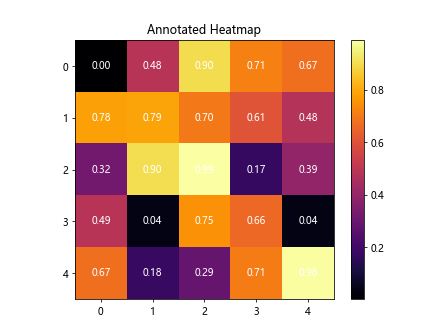
In this example, we iterate through the elements of the matrix and display the numerical values as annotations at the center of each cell. We use the ‘inferno’ colormap for the heatmap and ensure that the text is displayed in white for better contrast.
Heatmap with Masked Values
Sometimes we may want to mask certain values in the heatmap to highlight specific regions or exclude outliers. We can achieve this by using masked arrays in numpy. Here is an example of a masked heatmap:
import matplotlib.pyplot as plt
import numpy as np

data = np.random.rand(6, 6)
mask = np.random.choice([True, False], size=(6, 6), p=[0.2, 0.8])

masked_data = np.ma.masked_array(data, mask)

plt.imshow(masked_data, cmap='cividis', interpolation='nearest')
plt.colorbar()
plt.title('Masked Heatmap')
plt.show()
Output:
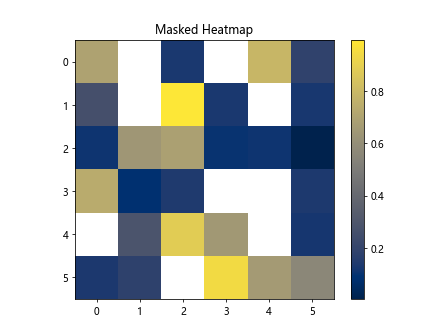
In this example, we create random data and a random mask of True and False values. We then use a masked array to hide certain values in the heatmap, which are represented by blank spaces in the plot.
Interactive Heatmap
To create an interactive heatmap that allows users to explore the data more interactively, we can use the mplcursors library. Here is an example of an interactive heatmap:
import mplcursors
import matplotlib.pyplot as plt
import numpy as np

data = np.random.rand(7, 7)

plt.imshow(data, cmap='twilight', interpolation='nearest')
plt.colorbar()
mplcursors.cursor(hover=True)
plt.show()
Output:
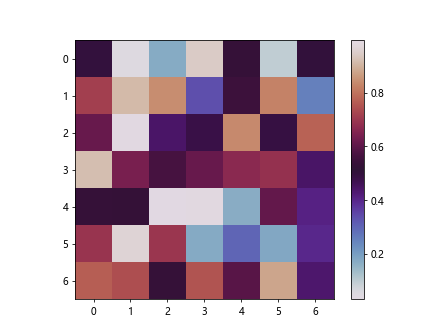
In this example, we create a random 7×7 matrix and display it with a ‘twilight’ colormap. We then enable mplcursors to add interactive annotations to the heatmap, allowing users to see the exact values by hovering over each data point.
Contour Heatmap
Instead of displaying the heatmap as a grid of colors, we can represent the data using contour lines. This can be useful for visualizing data patterns more clearly. Here is an example of a contour heatmap:
import matplotlib.pyplot as plt
import numpy as np

data = np.random.rand(6, 6)

plt.contourf(data, cmap='terrain')
plt.colorbar()
plt.title('Contour Heatmap')
plt.show()
Output:
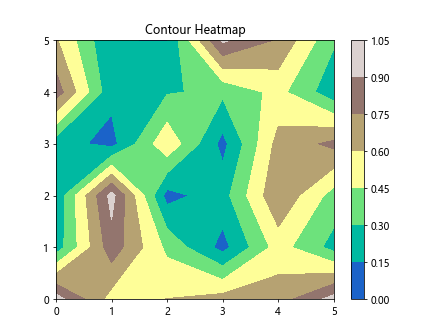
In this example, we create a random 6×6 matrix and use plt.contourf() to plot the heatmap as filled contours with a ‘terrain’ colormap. The contour lines help to show the data distribution more intuitively.
Animated Heatmap
For time-series data or data that changes over time, we can create animated heatmaps to visualize the evolution of patterns. We can use the matplotlib.animation module to create such animations. Here is an example of an animated heatmap:
import matplotlib.animation as animation
import matplotlib.pyplot as plt
import numpy as np

fig, ax = plt.subplots()

data = np.random.rand(5, 5)

def update(frame):
    ax.clear()
    data = np.random.rand(5, 5)
    ax.imshow(data, cmap='plasma', interpolation='nearest')
    ax.set_title(f'Frame {frame}')

ani = animation.FuncAnimation(fig, update, frames=10, interval=200, repeat=False)
plt.show()
In this example, we create a random 5×5 matrix and update it every 200 milliseconds to simulate an animated heatmap. The heatmap is displayed with a ‘plasma’ colormap, and the title of the plot changes with each frame.
Conclusion
In this article, we have explored various ways to create and customize heatmaps using the matplotlib library in Python. From basic heatmaps to clustered heatmaps, annotated heatmaps, and interactive heatmaps, there are many possibilities for visualizing data in a matrix form. By experimenting with different parameters, colormaps, and annotations, you can create informative and visually appealing heatmaps to analyze your data effectively. Give these examples a try and see how you can apply heatmaps to your own datasets for better insights.