How to Customize Matplotlib Boxplot Colors: A Comprehensive Guide
Matplotlib boxplot color customization is an essential skill for data visualization enthusiasts. This article will delve deep into the world of matplotlib boxplot color options, providing you with a thorough understanding of how to create visually appealing and informative boxplots using matplotlib. We’ll explore various techniques to modify matplotlib boxplot color schemes, adjust individual components, and create stunning visualizations that effectively communicate your data insights.
Understanding Matplotlib Boxplot Basics
Before we dive into matplotlib boxplot color customization, let’s briefly review the basics of boxplots in matplotlib. A boxplot, also known as a box-and-whisker plot, is a standardized way of displaying the distribution of data based on a five-number summary: minimum, first quartile, median, third quartile, and maximum.
Matplotlib provides a convenient function called boxplot() to create these plots. Here’s a simple example to get us started:
import matplotlib.pyplot as plt
import numpy as np

# Generate sample data
data = np.random.randn(100)

# Create a boxplot
plt.figure(figsize=(8, 6))
plt.boxplot(data)
plt.title('Basic Matplotlib Boxplot - how2matplotlib.com')
plt.show()
Output:
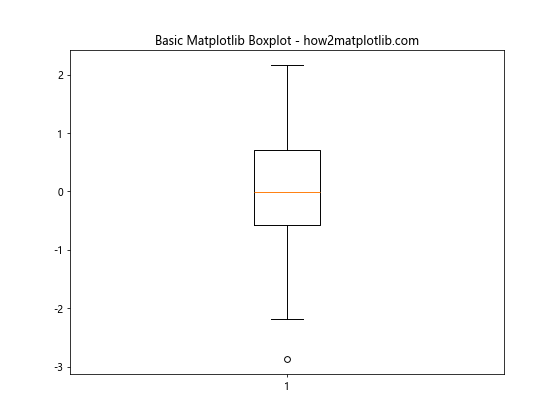
This code creates a basic boxplot using matplotlib. However, the default matplotlib boxplot color scheme may not always suit your needs. Let’s explore how we can customize the colors to make our plots more visually appealing and informative.
Customizing Individual Matplotlib Boxplot Color Components
Matplotlib allows you to customize the color of each boxplot component separately. This level of control is achieved by using a dictionary of properties for different parts of the boxplot.
import matplotlib.pyplot as plt
import numpy as np

# Generate sample data
data = np.random.randn(100)

# Define custom colors
box_colors = {
    'boxes': 'lightblue',
    'whiskers': 'darkblue',
    'medians': 'red',
    'caps': 'black'
}

# Create a boxplot with custom colors
plt.figure(figsize=(8, 6))
plt.boxplot(data, patch_artist=True, boxprops=dict(facecolor=box_colors['boxes']),
            whiskerprops=dict(color=box_colors['whiskers']),
            medianprops=dict(color=box_colors['medians']),
            capprops=dict(color=box_colors['caps']))
plt.title('Custom Color Matplotlib Boxplot - how2matplotlib.com')
plt.show()
Output:
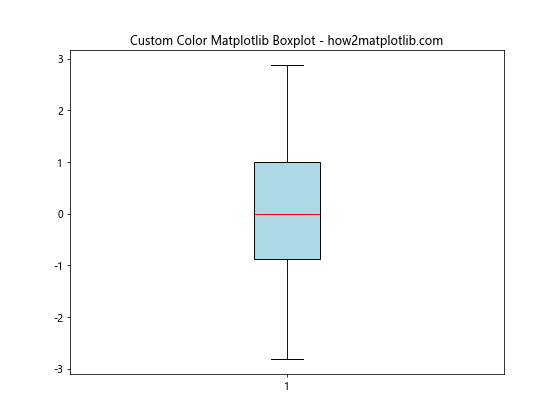
In this example, we’ve customized the matplotlib boxplot color for each component:
- The box is light blue
- The whiskers are dark blue
- The median line is red
- The caps are black
Note the use of patch_artist=True, which allows us to color the face of the box.
Using Matplotlib Boxplot Color Palettes
Instead of manually specifying colors, you can use matplotlib’s built-in color palettes to create visually appealing color schemes for your boxplots.
import matplotlib.pyplot as plt
import numpy as np

# Generate sample data
data = [np.random.randn(100) for _ in range(5)]

# Create a boxplot with a color palette
plt.figure(figsize=(10, 6))
bp = plt.boxplot(data, patch_artist=True)

# Use a color palette
colors = plt.cm.Set3(np.linspace(0, 1, len(data)))
for patch, color in zip(bp['boxes'], colors):
    patch.set_facecolor(color)

plt.title('Matplotlib Boxplot with Color Palette - how2matplotlib.com')
plt.show()
Output:
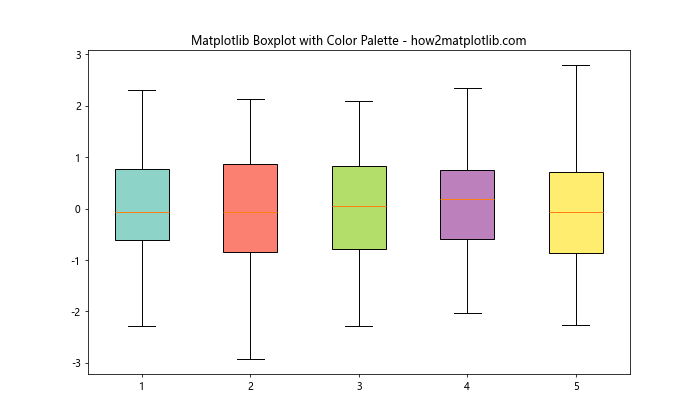
This example uses the ‘Set3’ color palette to assign different colors to each box in the boxplot. You can experiment with different color palettes like ‘viridis’, ‘plasma’, or ‘coolwarm’ to find the one that best suits your data and preferences.
Matplotlib Boxplot Color for Outliers
Outliers are an important part of boxplots, and customizing their appearance can help them stand out. Let’s look at how to change the matplotlib boxplot color for outliers.
import matplotlib.pyplot as plt
import numpy as np

# Generate sample data with outliers
np.random.seed(42)
data = np.concatenate([np.random.normal(0, 1, 100), np.random.normal(0, 1, 10) * 3])

# Create a boxplot with custom outlier color
plt.figure(figsize=(8, 6))
plt.boxplot(data, flierprops=dict(markerfacecolor='red', marker='D', markersize=8))
plt.title('Matplotlib Boxplot with Custom Outlier Color - how2matplotlib.com')
plt.show()
Output:
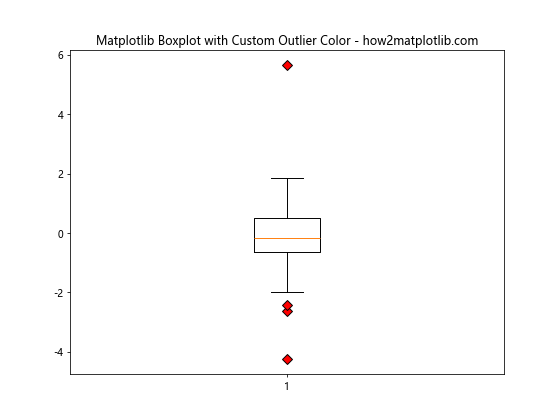
In this example, we’ve customized the outliers to be red diamond shapes. The flierprops parameter allows us to specify properties for the outlier markers.
Creating Grouped Matplotlib Boxplots with Custom Colors
When dealing with multiple categories of data, grouped boxplots can be very informative. Let’s explore how to create grouped boxplots with custom matplotlib boxplot colors.
import matplotlib.pyplot as plt
import numpy as np

# Generate sample data
np.random.seed(42)
data1 = np.random.normal(100, 10, 200)
data2 = np.random.normal(80, 20, 200)
data3 = np.random.normal(90, 15, 200)

# Create grouped boxplot
fig, ax = plt.subplots(figsize=(10, 6))
bp = ax.boxplot([data1, data2, data3], patch_artist=True)

# Define colors for each group
colors = ['lightblue', 'lightgreen', 'lightpink']

# Color the boxes
for patch, color in zip(bp['boxes'], colors):
    patch.set_facecolor(color)

# Customize other elements
for element in ['whiskers', 'fliers', 'means', 'medians', 'caps']:
    plt.setp(bp[element], color='gray')

plt.title('Grouped Matplotlib Boxplot with Custom Colors - how2matplotlib.com')
plt.xticks([1, 2, 3], ['Group A', 'Group B', 'Group C'])
plt.show()
Output:
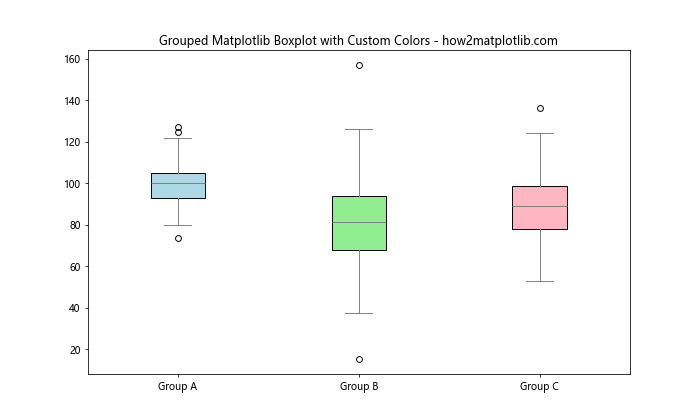
This example creates a grouped boxplot with three different datasets, each represented by a different color. The other elements (whiskers, outliers, etc.) are set to gray for consistency.
Using Matplotlib Boxplot Color to Highlight Specific Data
Sometimes you may want to use color to draw attention to specific data points or groups. Here’s an example of how to do this:
import matplotlib.pyplot as plt
import numpy as np

# Generate sample data
np.random.seed(42)
data = [np.random.normal(0, std, 100) for std in range(1, 4)]

# Create a boxplot
fig, ax = plt.subplots(figsize=(10, 6))
bp = ax.boxplot(data, patch_artist=True)

# Define colors: highlight the middle box
colors = ['lightgray', 'red', 'lightgray']

# Apply colors
for patch, color in zip(bp['boxes'], colors):
    patch.set_facecolor(color)

plt.title('Matplotlib Boxplot with Highlighted Data - how2matplotlib.com')
plt.xticks([1, 2, 3], ['Group A', 'Group B', 'Group C'])
plt.show()
Output:
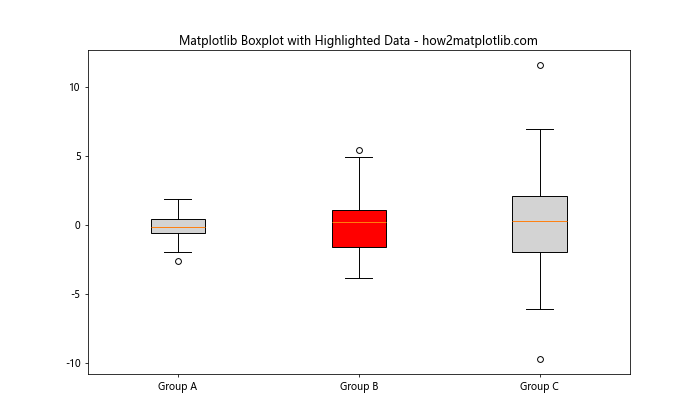
In this example, we’ve highlighted the middle box in red to draw attention to it, while keeping the other boxes in a neutral light gray.
Matplotlib Boxplot Color Gradients
Creating color gradients in your boxplots can be an effective way to visualize trends or patterns in your data. Let’s explore how to implement this using matplotlib.
import matplotlib.pyplot as plt
import numpy as np

# Generate sample data
np.random.seed(42)
data = [np.random.normal(10*i, 10, 100) for i in range(5)]

# Create a boxplot
fig, ax = plt.subplots(figsize=(12, 6))
bp = ax.boxplot(data, patch_artist=True)

# Create a color gradient
colors = plt.cm.YlOrRd(np.linspace(0.2, 0.8, len(data)))

# Apply the gradient to the boxes
for patch, color in zip(bp['boxes'], colors):
    patch.set_facecolor(color)

plt.title('Matplotlib Boxplot with Color Gradient - how2matplotlib.com')
plt.xticks(range(1, len(data)+1), [f'Group {i}' for i in range(1, len(data)+1)])
plt.show()
Output:
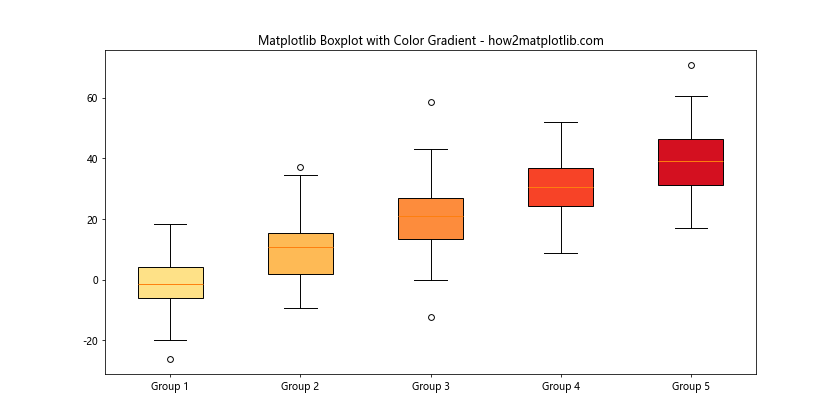
This example uses a yellow-to-red color gradient to color the boxes. The gradient helps to visually represent the increasing trend in the data.
Combining Matplotlib Boxplot Color with Other Plot Elements
Boxplots can be combined with other plot elements to create more informative visualizations. Let’s see how we can combine a boxplot with individual data points.
import matplotlib.pyplot as plt
import numpy as np

# Generate sample data
np.random.seed(42)
data = [np.random.normal(0, std, 100) for std in range(1, 4)]

# Create a figure and axis
fig, ax = plt.subplots(figsize=(12, 6))

# Create a boxplot
bp = ax.boxplot(data, patch_artist=True)

# Customize boxplot colors
colors = ['lightblue', 'lightgreen', 'lightpink']
for patch, color in zip(bp['boxes'], colors):
    patch.set_facecolor(color)

# Add individual points
for i, d in enumerate(data):
    y = d
    x = np.random.normal(i+1, 0.04, len(y))
    ax.plot(x, y, 'r.', alpha=0.2)

plt.title('Matplotlib Boxplot with Individual Points - how2matplotlib.com')
plt.xticks([1, 2, 3], ['Group A', 'Group B', 'Group C'])
plt.show()
Output:
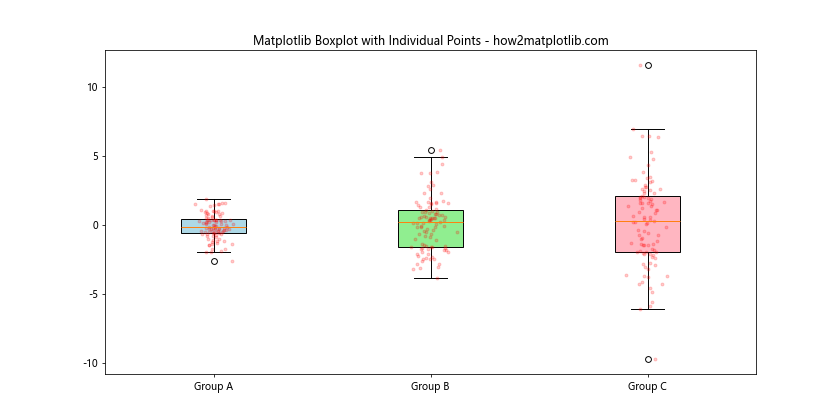
In this example, we’ve added individual data points as red dots on top of our boxplot. This combination provides a more complete picture of the data distribution.
Matplotlib Boxplot Color Schemes for Color-Blind Accessibility
When creating visualizations, it’s important to consider accessibility for color-blind individuals. Let’s explore how to use a color-blind friendly palette for our boxplots.
import matplotlib.pyplot as plt
import numpy as np
import seaborn as sns

# Generate sample data
np.random.seed(42)
data = [np.random.normal(0, std, 100) for std in range(1, 6)]

# Create a boxplot
fig, ax = plt.subplots(figsize=(12, 6))
bp = ax.boxplot(data, patch_artist=True)

# Use a color-blind friendly palette
colors = sns.color_palette("colorblind", n_colors=len(data))

# Apply colors
for patch, color in zip(bp['boxes'], colors):
    patch.set_facecolor(color)

plt.title('Color-Blind Friendly Matplotlib Boxplot - how2matplotlib.com')
plt.xticks(range(1, len(data)+1), [f'Group {i}' for i in range(1, len(data)+1)])
plt.show()
Output:
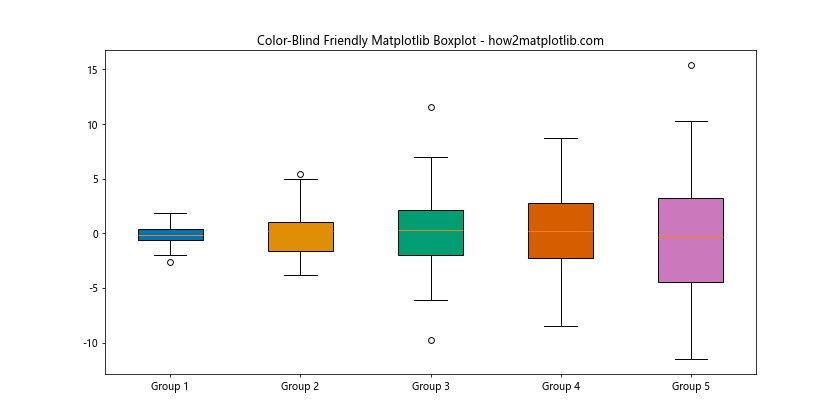
This example uses Seaborn’s colorblind palette to ensure that the boxplot is accessible to individuals with color vision deficiencies.
Animated Matplotlib Boxplot Color Changes
For presentations or interactive visualizations, you might want to create an animated boxplot that changes colors over time. Here’s an example of how to achieve this using matplotlib’s animation functionality.
import matplotlib.pyplot as plt
import matplotlib.animation as animation
import numpy as np

# Generate sample data
np.random.seed(42)
data = [np.random.normal(0, std, 100) for std in range(1, 4)]

# Create a figure and axis
fig, ax = plt.subplots(figsize=(10, 6))

# Create initial boxplot
bp = ax.boxplot(data, patch_artist=True)

# Animation function
def animate(frame):
    colors = plt.cm.viridis(np.linspace(0, 1, len(data)))
    colors = np.roll(colors, frame, axis=0)
    for patch, color in zip(bp['boxes'], colors):
        patch.set_facecolor(color)
    return bp['boxes']

# Create animation
ani = animation.FuncAnimation(fig, animate, frames=60, interval=100, blit=True)

plt.title('Animated Matplotlib Boxplot Colors - how2matplotlib.com')
plt.xticks([1, 2, 3], ['Group A', 'Group B', 'Group C'])
plt.show()
Output:
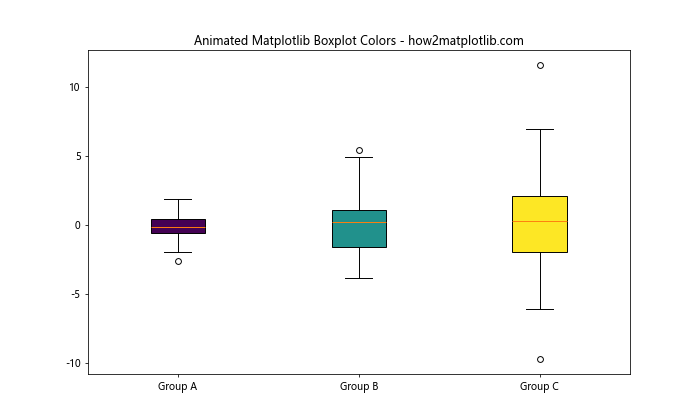
This example creates an animation where the colors of the boxplot cycle through a color palette. The FuncAnimation function is used to create the animation, with the animate function updating the colors in each frame.
Matplotlib Boxplot Color and Style Combinations
Combining different colors and styles can create visually striking boxplots. Let’s explore how to combine colors with different line styles and widths.
import matplotlib.pyplot as plt
import numpy as np

# Generate sample data
np.random.seed(42)
data = [np.random.normal(0, std, 100) for std in range(1, 4)]

# Create a boxplot
fig, ax = plt.subplots(figsize=(10, 6))
bp = ax.boxplot(data, patch_artist=True)

# Customize colors and styles
colors = ['lightblue', 'lightgreen', 'lightpink']
for i, (patch, color) in enumerate(zip(bp['boxes'], colors)):
    patch.set_facecolor(color)
    # Customize median lines
    plt.setp(bp['medians'][i], color='red', linewidth=2)
    # Customize whiskers
    plt.setp(bp['whiskers'][2*i:2*i+2], color='blue', linestyle='--')
    # Customize caps
    plt.setp(bp['caps'][2*i:2*i+2], color='gray', linewidth=2)

plt.title('Matplotlib Boxplot with Custom Colors and Styles - how2matplotlib.com')
plt.xticks([1, 2, 3], ['Group A', 'Group B', 'Group C'])
plt.show()
Output:
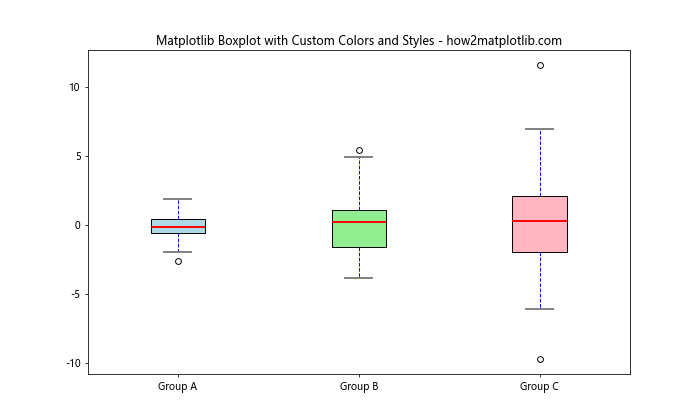
In this example, we’ve combined different colors for the boxes with custom styles for the median lines, whiskers, and caps. This level of customization allows you to create unique and informative boxplots.
Using Matplotlib Boxplot Color to Represent Categories
Colors can be used effectively to represent different categories in your data. Let’s see how we can use color to distinguish between different groups in a multi-category boxplot.
import matplotlib.pyplot as plt
import numpy as np

# Generate sample data
np.random.seed(42)
categories = ['Category A', 'Category B', 'Category C']
groups = ['Group 1', 'Group 2']
data = {cat: {grp: np.random.normal(0, std, 100)
              for grp, std in zip(groups, range(1, 3))}
        for cat in categories}

# Create a boxplot
fig, ax = plt.subplots(figsize=(12, 6))

positions = np.arange(1, len(categories)*3, 3)
colors = ['lightblue', 'lightgreen']

for i, (cat, grp_data) in enumerate(data.items()):
    bp = ax.boxplot([grp_data[grp] for grp in groups],
                    positions=positions[i] + np.array([0, 1]),
                    widths=0.6, patch_artist=True)

    for patch, color in zip(bp['boxes'], colors):
        patch.set_facecolor(color)

plt.title('Multi-Category Matplotlib Boxplot with Colors - how2matplotlib.com')
plt.xticks(positions + 0.5, categories)
plt.legend(handles=[plt.Rectangle((0,0),1,1, fc=c, ec="k") for c in colors],
           labels=groups, loc='upper right')
plt.show()
Output:
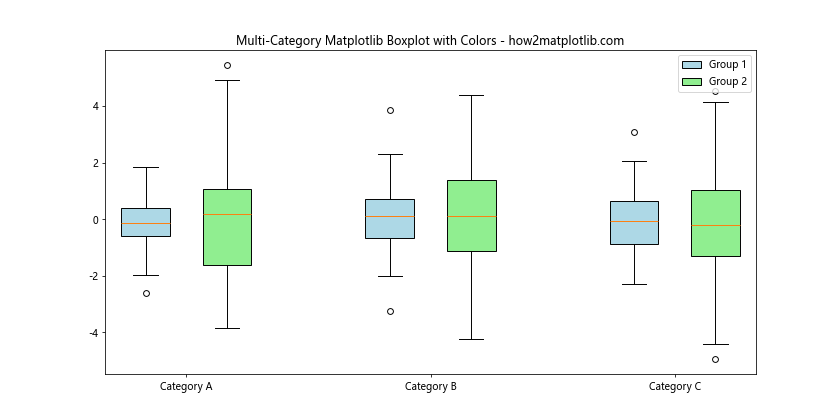
In this example, we’ve used different colors to represent different groups within each category. This makes it easy to compare not only across categories but also between groups within each category.
Combining Matplotlib Boxplot Color with Violin Plots
Boxplots can be combined with violin plots to provide a more comprehensive view of the data distribution. Let’s see how we can use color to enhance this combination.
import matplotlib.pyplot as plt
import numpy as np
import seaborn as sns

# Generate sample data
np.random.seed(42)
data = [np.random.normal(0, std, 1000) for std in range(1, 4)]

# Create a figure and axis
fig, ax = plt.subplots(figsize=(12, 6))

# Create violin plots
parts = ax.violinplot(data, showmeans=False, showmedians=False, showextrema=False)

# Customize violin colors
colors = ['lightblue', 'lightgreen', 'lightpink']
for pc, color in zip(parts['bodies'], colors):
    pc.set_facecolor(color)
    pc.set_edgecolor('black')
    pc.set_alpha(0.7)

# Add box plots
bp = ax.boxplot(data, positions=range(1, len(data)+1), widths=0.15, patch_artist=True,
                showmeans=True, showfliers=False, medianprops={"color": "white", "linewidth": 0.5},
                boxprops={"facecolor": "C0", "edgecolor": "white", "linewidth": 0.5},
                meanprops={"marker": "o", "markeredgecolor": "white", "markerfacecolor": "C0"})

plt.title('Matplotlib Boxplot and Violin Plot Combination - how2matplotlib.com')
plt.xticks(range(1, len(data)+1), [f'Group {i}' for i in range(1, len(data)+1)])
plt.show()
Output:
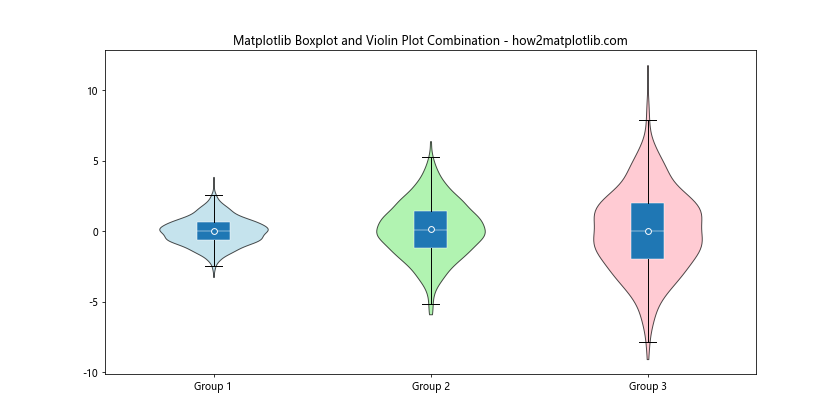
In this example, we’ve combined colored violin plots with boxplots. The violin plots show the full distribution of the data, while the boxplots provide a summary of key statistics. The use of color helps to distinguish between different groups and makes the visualization more appealing.
Matplotlib boxplot color Conclusion
Mastering matplotlib boxplot color customization opens up a world of possibilities for creating informative and visually appealing data visualizations. From simple color changes to complex gradient mappings, the techniques we’ve explored in this article provide you with a comprehensive toolkit for enhancing your boxplots.
Remember, the key to effective data visualization is not just about making things look pretty, but about conveying information clearly and efficiently. Use color purposefully to highlight important aspects of your data, distinguish between categories, or represent additional dimensions of information.