Matplotlib Axes Annotate
Matplotlib is a powerful plotting library for Python that allows you to create professional looking plots with ease. One useful feature of Matplotlib is the ability to annotate your plots with text, arrows, and shapes using the annotate method.
Basic Annotation
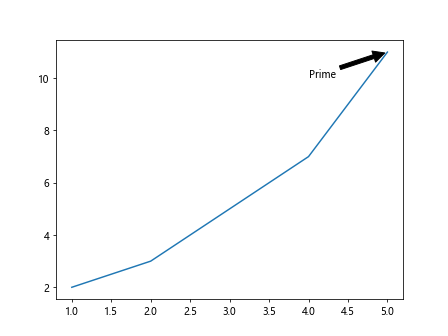
You can add annotations to your plot by using the annotate method of the axes object. Here is a basic example of how to annotate a point on a plot:
import matplotlib.pyplot as plt

x = [1, 2, 3, 4, 5]
y = [2, 3, 5, 7, 11]

plt.plot(x, y)
plt.annotate('Prime', xy=(5, 11), xytext=(4, 10),
             arrowprops=dict(facecolor='black', shrink=0.05))
plt.show()
Output:
Customizing Annotations
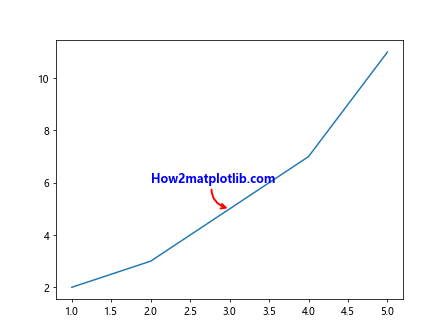
You can customize the appearance of annotations by specifying various parameters such as text color, font size, arrow properties, and more. Here is an example of how to create a custom annotation:
import matplotlib.pyplot as plt

x = [1, 2, 3, 4, 5]
y = [2, 3, 5, 7, 11]

plt.plot(x, y)
plt.annotate('How2matplotlib.com', xy=(3, 5), xytext=(2, 6),
             arrowprops=dict(arrowstyle='->', connectionstyle='arc3,rad=.5', lw=2, color='red'),
             fontsize=12, color='blue', fontweight='bold')
plt.show()
Output:
Text Annotations
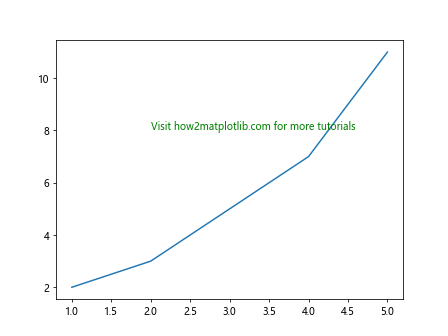
You can add text annotations to your plot using the text method of the axes object. Text annotations do not have arrows connecting them to points on the plot. Here is an example of how to add a text annotation:
import matplotlib.pyplot as plt

x = [1, 2, 3, 4, 5]
y = [2, 3, 5, 7, 11]

plt.plot(x, y)
plt.text(2, 8, 'Visit how2matplotlib.com for more tutorials', fontsize=10, color='green')
plt.show()
Output:
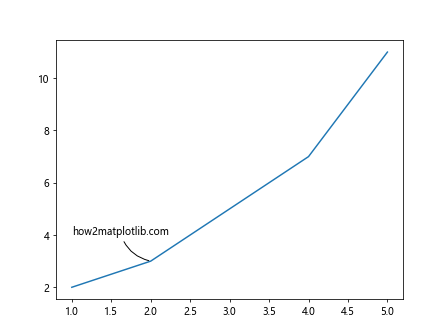
Shorthand Annotation
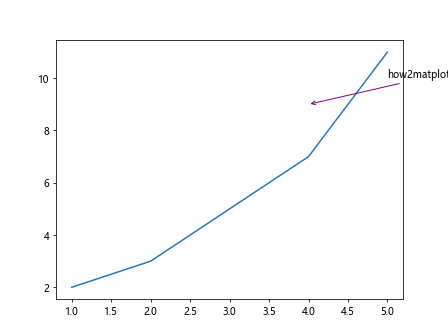
Matplotlib also provides a shorthand method for adding annotations to your plots called plt.annotate. Here is an example of how to use the shorthand method:
import matplotlib.pyplot as plt

x = [1, 2, 3, 4, 5]
y = [2, 3, 5, 7, 11]

plt.plot(x, y)
plt.annotate('how2matplotlib.com', (4, 9), xytext=(5, 10),
             arrowprops=dict(arrowstyle='->', lw=1, color='purple'))
plt.show()
Output:
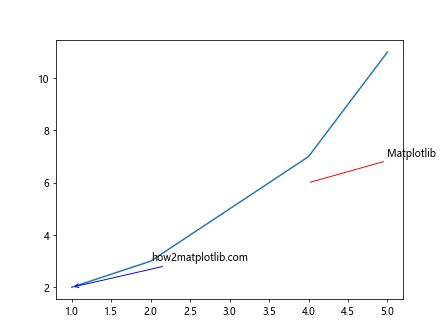
Multiple Annotations
You can add multiple annotations to a single plot by calling the annotate method multiple times. Here is an example of how to add multiple annotations:
import matplotlib.pyplot as plt

x = [1, 2, 3, 4, 5]
y = [2, 3, 5, 7, 11]

plt.plot(x, y)
plt.annotate('how2matplotlib.com', (1, 2), xytext=(2, 3),
             arrowprops=dict(arrowstyle='->', lw=1, color='blue'))

plt.annotate('Matplotlib', (4, 6), xytext=(5, 7),
             arrowprops=dict(arrowstyle='-', lw=1, color='red'))
plt.show()
Output:
Annotation Outside Plot Bounds
Sometimes you may want to add annotations outside the bounds of your plot. You can achieve this by setting the xycoords parameter to 'axes fraction'. Here is an example of how to place an annotation outside the plot bounds:
import matplotlib.pyplot as plt

x = [1, 2, 3, 4, 5]
y = [2, 3, 5, 7, 11]

plt.plot(x, y)
plt.annotate('how2matplotlib.com', xy=(1, 1), xycoords='axes fraction', xytext=(0.5, 0.5),
             arrowprops=dict(arrowstyle='-', lw=1, color='black'))
plt.show()
Output:
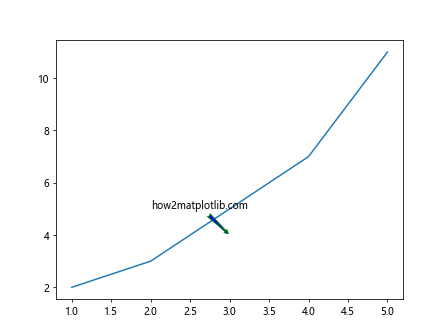
Annotation with Custom Arrow
You can create custom arrow shapes for your annotations by specifying the arrowprops parameter with different values. Here is an example of how to create a custom arrow shape:
import matplotlib.pyplot as plt

x = [1, 2, 3, 4, 5]
y = [2, 3, 5, 7, 11]

plt.plot(x, y)
plt.annotate('how2matplotlib.com', (3, 4), xytext=(2, 5),
             arrowprops=dict(arrowstyle='fancy', fc='blue', ec='green'))
plt.show()
Output:
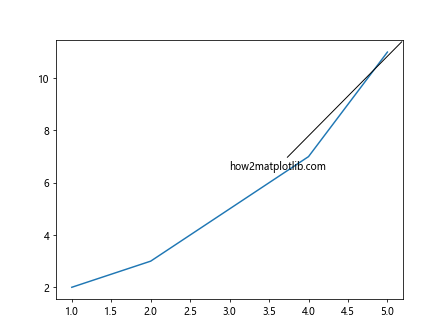
Annotation with Connection Style
You can specify different connection styles for the arrow connecting the annotation to a point on the plot. Here is an example of how to use a connection style:
import matplotlib.pyplot as plt

x = [1, 2, 3, 4, 5]
y = [2, 3, 5, 7, 11]

plt.plot(x, y)
plt.annotate('how2matplotlib.com', xy=(2, 3), xytext=(1, 4),
             arrowprops=dict(arrowstyle='-', connectionstyle='arc3,rad=0.3'))
plt.show()
Output:
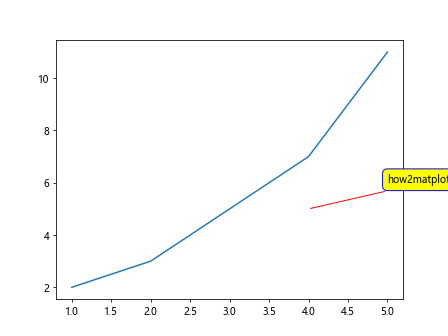
Annotation with Background
You can add a background to your annotations by specifying the bbox parameter with different properties. Here is an example of how to add a background to an annotation:
import matplotlib.pyplot as plt

x = [1, 2, 3, 4, 5]
y = [2, 3, 5, 7, 11]

plt.plot(x, y)
plt.annotate('how2matplotlib.com', (4, 5), xytext=(5, 6),
             arrowprops=dict(arrowstyle='-', lw=1, color='red'),
             bbox=dict(facecolor='yellow', edgecolor='blue', boxstyle='round,pad=0.5'))
plt.show()
Output:
Conclusion
In this article, we have explored the various ways you can add annotations to your plots using Matplotlib. Annotations can be a powerful tool for highlighting important points on your plots and adding additional information for your audience. Experiment with different styles and properties to create annotations that suit your needs. Visit how2matplotlib.com for more tutorials on Matplotlib and other data visualization tools.