Matplotlib Annotations
Matplotlib is a powerful visualization library in Python that allows for the creation of various types of plots. Annotations in matplotlib are a way to add descriptive text or symbols to specific points on a plot, helping to provide additional information or context to the data being displayed. This article will provide a detailed introduction to using annotations in matplotlib with various examples.
Basic Text Annotations
Text annotations in matplotlib are added using the text() function. The following example demonstrates how to add a simple text annotation to a plot:
import matplotlib.pyplot as plt

plt.plot([1, 2, 3, 4], [1, 4, 9, 16], 'ro')
plt.annotate('Example Annotation', xy=(2, 4), xytext=(3, 6),
             arrowprops=dict(facecolor='black', shrink=0.05))
plt.show()
Output:
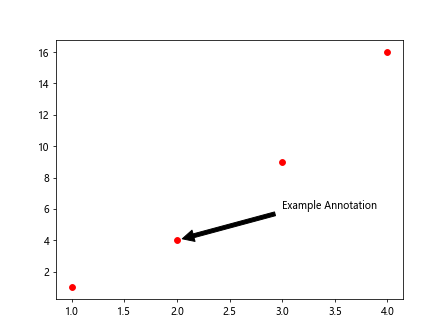
In this example, we first create a simple plot using plt.plot(). We then add a text annotation using the annotate() function. The xy argument specifies the point we want to annotate, while xytext specifies the position of the text. The arrowprops argument allows us to customize the style of the arrow connecting the annotation to the point.
Box Annotations
Box annotations in matplotlib are added using the bbox parameter within the annotate() function. This parameter allows you to create a box around the text annotation, providing emphasis and clarity. The following example demonstrates how to add a box annotation to a plot:
import matplotlib.pyplot as plt

plt.plot([1, 2, 3, 4], [1, 4, 9, 16], 'bo')
plt.annotate('Box Annotation', xy=(3, 9), xytext=(2, 12),
             bbox=dict(boxstyle='round,pad=0.5', fc='yellow', alpha=0.5),
             arrowprops=dict(arrowstyle='->', connectionstyle='arc3,rad=0.5'))
plt.show()
Output:
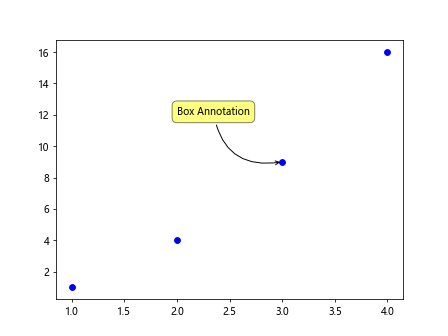
In this example, we use the bbox argument to create a box around the text annotation. The boxstyle parameter allows us to customize the style of the box, while fc specifies the background color of the box. The alpha parameter controls the transparency of the box.
Customizing Annotations
Matplotlib allows for extensive customization of annotations, including the ability to adjust text properties such as font size, style, and color. The following example demonstrates how to customize text annotations in matplotlib:
import matplotlib.pyplot as plt

plt.plot([1, 2, 3, 4], [1, 4, 9, 16], 'go')
plt.annotate('Customized Annotation', xy=(1, 1), xytext=(1.5, 2),
             fontsize=12, fontweight='bold', color='red',
             arrowprops=dict(arrowstyle='->', lw=2, color='blue'))
plt.show()
Output:
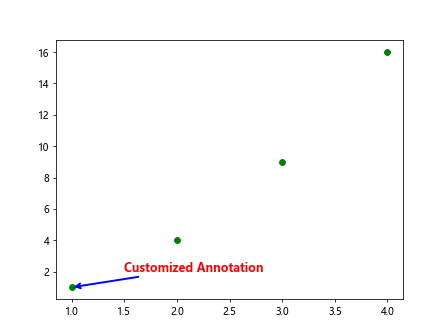
In this example, we customize the text annotation by adjusting the fontsize, fontweight, and color parameters. We can also customize the arrow properties, such as the arrowstyle, lw (line width), and color.
Annotations with Arrows
Arrows in annotations are useful for indicating the relationship between the annotated point and the associated text. The following example demonstrates how to add an arrow to a text annotation in matplotlib:
import matplotlib.pyplot as plt

plt.plot([1, 2, 3, 4], [1, 4, 9, 16], 'yo')
plt.annotate('Arrow Annotation', xy=(4, 16), xytext=(3, 14),
             arrowprops=dict(arrowstyle='-|>', lw=1.5, color='green'))
plt.show()
Output:
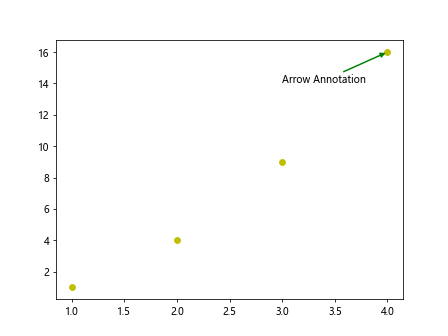
In this example, the arrowprops argument is used to customize the arrow properties. We specify the arrowstyle as -|> to create an arrow with a particular style, adjust the lw parameter to set the line width, and set the arrow color to green.
Annotations with ConnectionStyle
Matplotlib allows for the customization of the connection style between the annotation text and the point being annotated. The connectionstyle parameter within the arrowprops argument controls this style. The following example demonstrates how to use different connection styles:
import matplotlib.pyplot as plt

plt.plot([1, 2, 3, 4], [1, 4, 9, 16], 'mo')
plt.annotate('ConnectionStyle Annotation', xy=(2, 4), xytext=(3, 6),
             arrowprops=dict(arrowstyle='->', connectionstyle='angle,angleA=90,angleB=0,rad=10'))
plt.show()
Output:
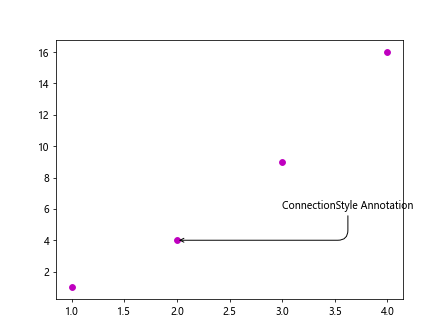
In this example, we use the connectionstyle parameter to specify the angle and radius of the connection line between the annotation text and the point. Different connection styles can be achieved by adjusting the angleA, angleB, and rad parameters.
Annotations with Shrink
The shrink parameter within the arrowprops argument controls the distance between the text annotation and the arrow tip. Adjusting this parameter allows for fine-tuning the appearance of the annotation. The following example demonstrates how to use the shrink parameter:
import matplotlib.pyplot as plt

plt.plot([1, 2, 3, 4], [1, 4, 9, 16], 'co')
plt.annotate('Shrink Annotation', xy=(3, 9), xytext=(2, 12),
             arrowprops=dict(arrowstyle='->', connectionstyle='arc3,rad=0.5', shrink=0.1))
plt.show()
In this example, we set the shrink parameter to 0.1, reducing the distance between the annotation text and the arrow tip. Experimenting with different shrink values allows for precise control over the positioning of annotations.
Annotations with Fancy ArrowPatch
Matplotlib provides the FancyArrowPatch class for creating custom arrows in annotations. This allows for more sophisticated arrow designs, such as curved or double-headed arrows. The following example demonstrates how to use FancyArrowPatch:
import matplotlib.pyplot as plt
from matplotlib.patches import FancyArrowPatch

plt.plot([1, 2, 3, 4], [1, 4, 9, 16], 'ro')
arrow = FancyArrowPatch((2, 4), (3, 6), arrowstyle='fancy', mutation_scale=20,
                        connectionstyle='arc3,rad=0.3', color='purple')
plt.gca().add_patch(arrow)
plt.show()
Output:
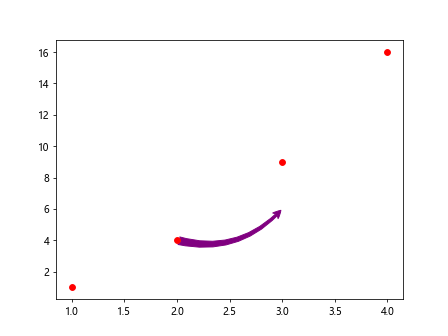
In this example, we create a custom FancyArrowPatch object with a fancy arrow style, a larger mutation_scale value, and a curved connectionstyle. The arrow is then added to the plot using plt.gca().add_patch(arrow).
Annotations with Annotations
Matplotlib annotations can be used in conjunction with other annotations to provide additional context or information on a plot. Multiple annotations can be added to the same plot to highlight various points or features. The following example demonstrates how to use multiple annotations on a plot:
import matplotlib.pyplot as plt

plt.plot([1, 2, 3, 4], [1, 4, 9, 16], 'bo')
plt.annotate('First Annotation', xy=(2, 4), xytext=(3, 6),
             arrowprops=dict(arrowstyle='->', connectionstyle='arc3,rad=0.5'))
plt.annotate('Second Annotation', xy=(4, 16), xytext=(3.5, 14),
             arrowprops=dict(arrowstyle='-|>', lw=1.5, color='green'))
plt.show()
Output:
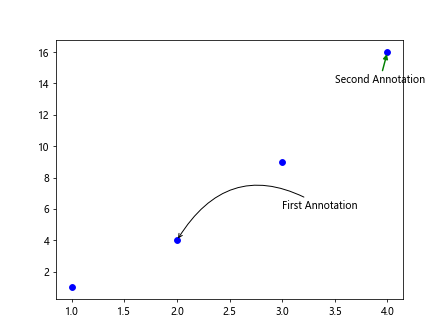
In this example, we add two text annotations to the plot at different points. Each annotation is customized with a unique style, arrow type, and connection style to distinguish between them.
Annotations with Polar Coordinates
Annotations in matplotlib can be applied to polar plots as well, using polar coordinates to specify the position of the annotations. The following example demonstrates how to add annotations to a polar plot:
import matplotlib.pyplot as plt

r = [1, 2, 3, 4]
theta = [0, 45, 90, 135]

ax = plt.subplot(111, polar=True)
ax.plot(theta, r, marker='o')

ax.annotate('Polar Annotation', xy=(45, 2), xytext=(60, 3),
             arrowprops=dict(arrowstyle='->', connectionstyle='arc3,rad=0.5'))
plt.show()
Output:
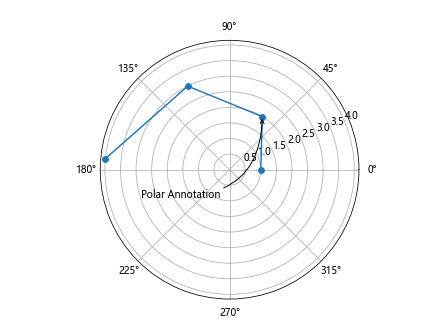
In this example, we create a polar plot using plt.subplot() with polar=True. We then specify the polar coordinates for the points we want to annotate. Using ax.annotate(), we add a text annotation to the polar plot at a specific theta and radius position, along with an arrow connecting the annotation to the point.
Annotations with Annotations in Subplots
Matplotlib allows for annotations to be added to individual subplots within a figure, enabling the customization of annotations for different plots. The following example demonstrates how to add annotations to subplots:
import matplotlib.pyplot as plt

fig, axs = plt.subplots(1, 2)

# First subplot
axs[0].plot([1, 2, 3, 4], [1, 4, 9, 16], 'ro')
axs[0].annotate('First Subplot Annotation', xy=(2, 4), xytext=(3, 6),
                arrowprops=dict(arrowstyle='->', connectionstyle='arc3,rad=0.5'))

# Second subplot
axs[1].plot([1, 3, 5, 7], [2, 4, 6, 8], 'bo')
axs[1].annotate('Second Subplot Annotation', xy=(3, 4), xytext=(4, 5),
                arrowprops=dict(arrowstyle='-|>', lw=1.5, color='green'))

plt.show()
Output:
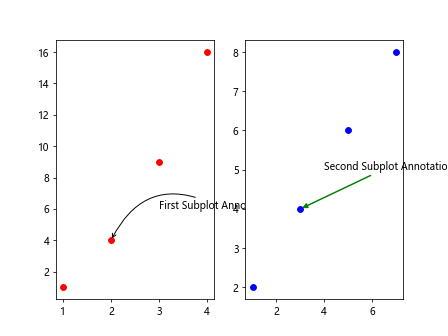
In this example, we create a figure with two subplots using plt.subplots(1, 2). Annotations are added to each subplot individually, allowing for customization of the text and arrow properties for each annotation.
Annotations with Arrow Tail
In matplotlib, the tail of the arrow in an annotation can be positioned at a different point than where the text is displayed. This allows for more flexibility in specifying the connection between the annotation and the data point. The following example demonstrates how to position the tail of the arrow at a different point:
import matplotlib.pyplot as plt

plt.plot([1, 2, 3, 4], [1, 4, 9, 16], 'go')
plt.annotate('Arrow Tail Annotation', xy=(3, 9), xytext=(2, 12),
             arrowprops=dict(arrowstyle='->', connectionstyle='arc3,rad=0.5', tail_width=2, tail_length=3))
plt.show()
In this example, we use the tail_width and tail_length parameters within arrowprops to customize the position of the arrow tail relative to the annotation text. By adjusting these parameters, we can control the length and width of the arrow tail.
Annotations with AnnotationClip
Matplotlib provides the AnnotationClip class for clipping annotations to specified axes or regions, ensuring that annotations are only visible within the specified area. The following example demonstrates how to use AnnotationClip:
import matplotlib.pyplot as plt
from matplotlib.patches import FancyBboxPatch
from matplotlib.offsetbox import AnnotationBbox, OffsetImage

fig, ax = plt.subplots()

# Add an image to the plot
image_path = 'image.png'
imagebox = OffsetImage(plt.imread(image_path), zoom=0.5)
ab = AnnotationBbox(imagebox, (0.5, 0.5), frameon=False)
ax.add_artist(ab)

# Add a clipped annotation to the plot
bbox_props = dict(boxstyle="round,pad=0.3", fc="cyan", ec="b", lw=2)
clipped_ab = AnnotationBbox(ab, (0.5, 0.5), xybox=(0.8, 0.8),
                            xycoords='axes fraction', boxcoords='axes fraction',
                            arrowprops=dict(arrowstyle='->', connectionstyle='arc3,rad=0.5'),
                            bboxprops=bbox_props, clip_box=ax.bbox, clip_on=True)
ax.add_artist(clipped_ab)

plt.show()
In this example, we first add an image to the plot using OffsetImage and AnnotationBbox. We then create a clipped annotation using another AnnotationBbox that clips the annotation to a specified region using clip_box and clip_on. The clipped annotation is added to the plot with customized box and arrow properties.
Conclusion
In conclusion, annotations in matplotlib provide a powerful way to enhance visualizations by adding textual or graphical information to specific points on a plot. By using the various customization options available in matplotlib, such as text properties, arrow styles, connection styles, and clipping techniques, users can create informative and visually appealing annotations tailored to their data and presentation needs. Experimenting with different annotation styles and techniques can significantly improve the clarity and impact of plots, making them more engaging and insightful for viewers.