Matplotlib Annotate Position
Matplotlib is a powerful visualization library in Python that allows users to create a wide range of plots and customize them to suit their needs. One common feature in matplotlib is the ability to annotate specific points on a plot with text or markers. In this article, we will explore how to specify the position of annotations in matplotlib to effectively communicate information in our plots.
Basic Annotation
First, let’s start with a basic example of annotating a point on a plot. In this example, we will annotate the point (3, 7) with the text “How2matplotlib”.
import matplotlib.pyplot as plt

x = [1, 2, 3, 4, 5]
y = [2, 4, 6, 8, 10]

plt.plot(x, y)
plt.annotate('How2matplotlib', (3, 7))
plt.show()
Output:
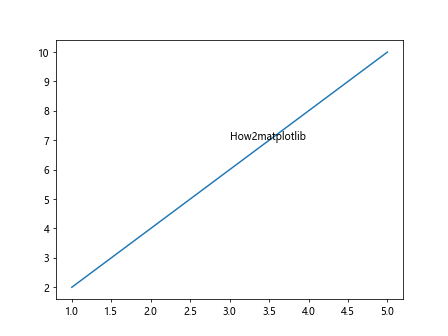
In the code above, the annotate function is used to add the annotation “How2matplotlib” at the point (3, 7) on the plot.
Annotation with Arrow
Sometimes, it’s helpful to include an arrow pointing to the annotated point for better clarity. Here’s an example of annotating a point with an arrow:
import matplotlib.pyplot as plt

x = [1, 2, 3, 4, 5]
y = [2, 4, 6, 8, 10]

plt.plot(x, y)
plt.annotate('How2matplotlib', (3, 7), arrowprops=dict(arrowstyle='->'))
plt.show()
Output:
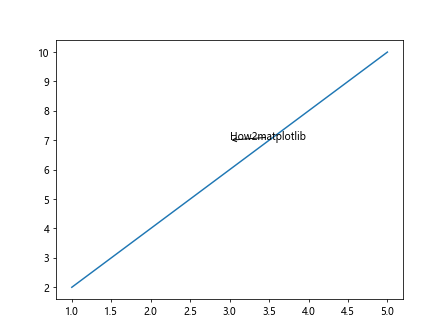
In this code snippet, we added the arrowprops argument to the annotate function to include an arrow pointing to the annotation.
Annotation with Custom Text and Arrow Properties
You can also customize the text and arrow properties of annotations to enhance the visual representation. Here’s an example:
import matplotlib.pyplot as plt

x = [1, 2, 3, 4, 5]
y = [2, 4, 6, 8, 10]

plt.plot(x, y)
plt.annotate('How2matplotlib', (3, 7),
             fontsize=12,
             fontweight='bold',
             color='red',
             arrowprops=dict(arrowstyle='->', color='blue', linewidth=2))
plt.show()
Output:
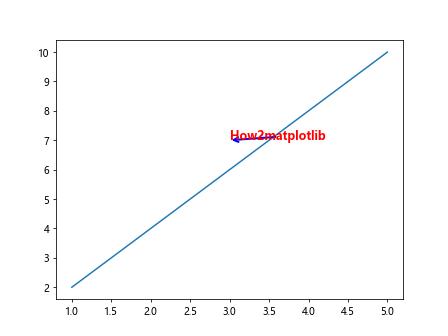
In this code snippet, we specified the font size, weight, and color of the text, as well as the color and linewidth of the arrow.
Annotation with Text Alignment
You can control the alignment of the annotation text with respect to the annotated point using the horizontalalignment and verticalalignment parameters. Here’s an example:
import matplotlib.pyplot as plt

x = [1, 2, 3, 4, 5]
y = [2, 4, 6, 8, 10]

plt.plot(x, y)
plt.annotate('How2matplotlib', (3, 7),
             fontsize=12,
             fontweight='bold',
             color='red',
             horizontalalignment='right',
             verticalalignment='top',
             arrowprops=dict(arrowstyle='->', color='blue', linewidth=2))
plt.show()
Output:
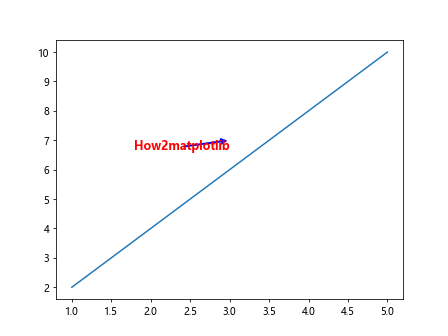
In this code snippet, we aligned the text to the right and top of the annotation point.
Annotation with Custom Offset
You can specify a custom offset from the annotated point using the xytext parameter. Here’s an example:
import matplotlib.pyplot as plt

x = [1, 2, 3, 4, 5]
y = [2, 4, 6, 8, 10]

plt.plot(x, y)
plt.annotate('How2matplotlib', (3, 7),
             fontsize=12,
             fontweight='bold',
             color='red',
             horizontalalignment='right',
             verticalalignment='top',
             arrowprops=dict(arrowstyle='->', color='blue', linewidth=2),
             xytext=(3, 9))
plt.show()
Output:
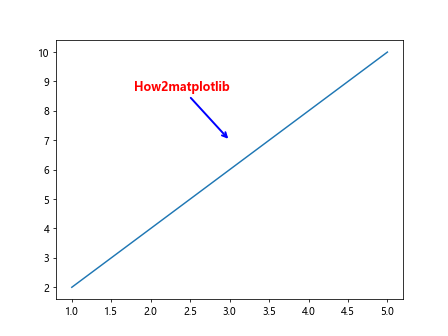
In this code snippet, we specified an offset of (0, 2) from the annotated point.
Annotation with Connection Style
You can customize the style of the connection between the text and the arrow using the connectionstyle parameter. Here’s an example:
import matplotlib.pyplot as plt

x = [1, 2, 3, 4, 5]
y = [2, 4, 6, 8, 10]

plt.plot(x, y)
plt.annotate('How2matplotlib', (3, 7),
             fontsize=12,
             fontweight='bold',
             color='red',
             horizontalalignment='right',
             verticalalignment='top',
             arrowprops=dict(arrowstyle='->', color='blue', linewidth=2),
             xytext=(3, 9),
             connectionstyle='angle,angleA=90,angleB=0,rad=10')
plt.show()
In this code snippet, we specified a custom connection style with an angle.
Annotation with Bbox Property
You can add a bounding box around the annotation text using the bbox parameter. Here’s an example:
import matplotlib.pyplot as plt

x = [1, 2, 3, 4, 5]
y = [2, 4, 6, 8, 10]

plt.plot(x, y)
plt.annotate('How2matplotlib', (3, 7),
             fontsize=12,
             fontweight='bold',
             color='red',
             horizontalalignment='right',
             verticalalignment='top',
             arrowprops=dict(arrowstyle='->', color='blue', linewidth=2),
             xytext=(3, 9),
             bbox=dict(facecolor='yellow', alpha=0.5))
plt.show()
Output:
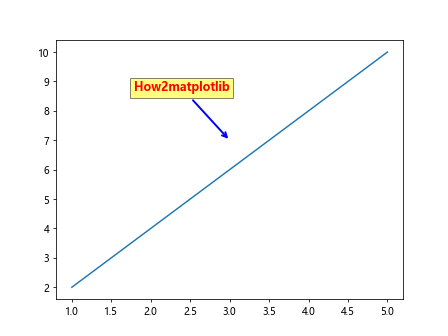
In this code snippet, we added a yellow bounding box with 50% transparency around the annotation text.
Annotation with Rotation
You can rotate the annotation text using the rotation parameter. Here’s an example:
import matplotlib.pyplot as plt

x = [1, 2, 3, 4, 5]
y = [2, 4, 6, 8, 10]

plt.plot(x, y)
plt.annotate('How2matplotlib', (3, 7),
             fontsize=12,
             fontweight='bold',
             color='red',
             horizontalalignment='right',
             verticalalignment='top',
             arrowprops=dict(arrowstyle='->', color='blue', linewidth=2),
             xytext=(3, 9),
             rotation=45)
plt.show()
Output:
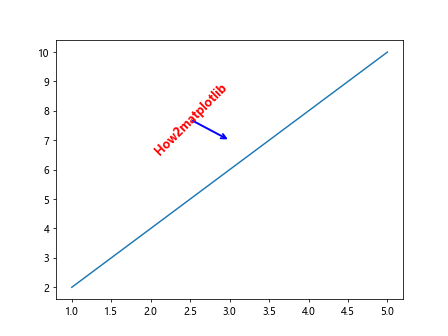
In this code snippet, we rotated the annotation text by 45 degrees.
Annotation with Text Transform
You can apply transformations to the annotation text using the transform parameter. Here’s an example:
from matplotlib.transforms import offset_copy
import matplotlib.pyplot as plt

x = [1, 2, 3, 4, 5]
y = [2, 4, 6, 8, 10]

plt.plot(x, y)
plt.annotate('How2matplotlib', (3, 7),
             fontsize=12,
             fontweight='bold',
             color='red',
             horizontalalignment='right',
             verticalalignment='top',
             arrowprops=dict(arrowstyle='->', color='blue', linewidth=2),
             xytext=(3, 9),
             transform=offset_copy(plt.gca().transData, x=5, y=5, units='points'))
plt.show()
In this code snippet, we applied an offset transformation to the annotation text.
Annotation with Conditional Formatting
You can conditionally format annotations based on specific criteria. Here’s an example:
import matplotlib.pyplot as plt

x = [1, 2, 3, 4, 5]
y = [2, 4, 6, 8, 10]

for i, (x_val, y_val) in enumerate(zip(x, y)):
    if x_val > 2:
        plt.annotate(f'Point {i+1} - how2matplotlib', (x_val, y_val))
plt.show()
Output:
In this code snippet, we added annotations only to points where the x-value is greater than 2.
Conclusion
In this article, we explored various ways to specify the position of annotations in matplotlib plots. Annotations are a powerful tool for highlighting important points in your visualizations and effectively communicating information to your audience. By customizing the position, alignment, appearance, and behavior of annotations, you can create more informative and visually appealing plots in matplotlib. Experiment with the examples provided here and try different combinations to enhance your data visualization projects.