How to Master Matplotlib Legend Title: A Comprehensive Guide
Matplotlib legend title is an essential component of data visualization in Python. This article will provide an in-depth exploration of how to create, customize, and optimize legend titles using Matplotlib. We’ll cover various aspects of legend titles, from basic implementation to advanced techniques, ensuring you have a thorough understanding of this crucial feature.
Understanding the Basics of Matplotlib Legend Title
The matplotlib legend title is a text element that appears above the legend in a plot. It provides a concise description of what the legend represents, making it easier for viewers to interpret the data. To create a legend title, we use the title parameter of the legend() function in Matplotlib.
Let’s start with a simple example to illustrate how to add a legend title:
import matplotlib.pyplot as plt

# Create some sample data
x = [1, 2, 3, 4, 5]
y1 = [2, 4, 6, 8, 10]
y2 = [1, 3, 5, 7, 9]

# Create the plot
plt.plot(x, y1, label='Line 1')
plt.plot(x, y2, label='Line 2')

# Add a legend with a title
plt.legend(title='How2Matplotlib.com Legend')

# Show the plot
plt.show()
Output:
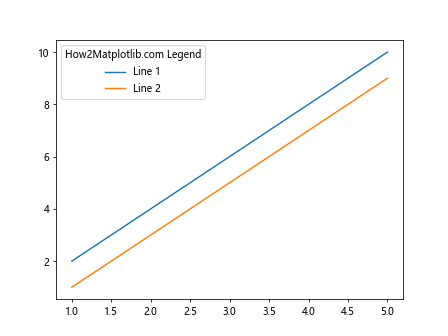
In this example, we’ve created a simple line plot with two lines and added a legend with a title. The title parameter in the legend() function sets the matplotlib legend title.
Customizing Matplotlib Legend Title Appearance
One of the key advantages of using matplotlib legend title is the ability to customize its appearance. You can modify various attributes such as font size, color, and style to make the legend title stand out or blend with your plot’s overall design.
Here’s an example demonstrating how to customize the matplotlib legend title:
import matplotlib.pyplot as plt

# Create some sample data
categories = ['A', 'B', 'C', 'D']
values1 = [4, 7, 2, 5]
values2 = [3, 6, 1, 4]

# Create the plot
plt.bar(categories, values1, label='Group 1')
plt.bar(categories, values2, bottom=values1, label='Group 2')

# Add a legend with a customized title
legend = plt.legend(title='How2Matplotlib.com Data')
plt.setp(legend.get_title(), fontsize='14', color='red', fontweight='bold')

# Show the plot
plt.show()
Output:
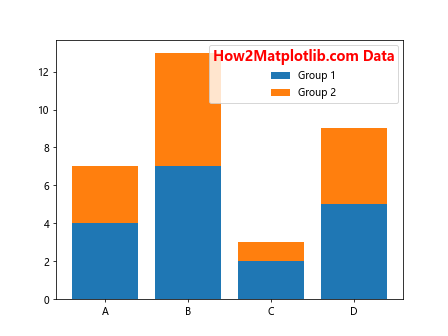
In this example, we’ve created a stacked bar chart and added a legend with a customized title. We’ve used plt.setp() to modify the font size, color, and weight of the matplotlib legend title.
Positioning the Matplotlib Legend Title
The position of the matplotlib legend title can significantly impact the readability and overall aesthetics of your plot. Matplotlib offers various options to control the legend’s location, which in turn affects the position of the legend title.
Let’s explore how to position the legend and its title:
import matplotlib.pyplot as plt

# Create some sample data
x = [1, 2, 3, 4, 5]
y1 = [2, 4, 6, 8, 10]
y2 = [1, 3, 5, 7, 9]

# Create the plot
plt.plot(x, y1, label='Series 1')
plt.plot(x, y2, label='Series 2')

# Add a legend with a title and position it outside the plot
plt.legend(title='How2Matplotlib.com Data', loc='center left', bbox_to_anchor=(1, 0.5))

# Adjust the layout to prevent clipping
plt.tight_layout()

# Show the plot
plt.show()
Output:
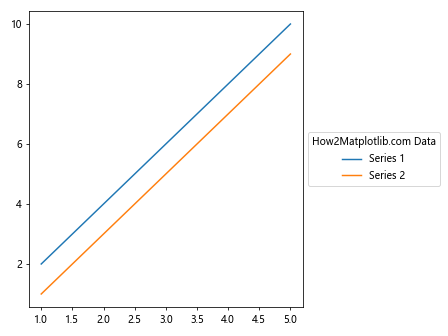
In this example, we’ve positioned the legend (and consequently its title) outside the plot area. The loc parameter specifies the anchor point of the legend, while bbox_to_anchor defines where this anchor point should be placed relative to the figure.
Using Multiple Legends with Titles in Matplotlib
Sometimes, you may need to use multiple legends in a single plot, each with its own title. This can be particularly useful when dealing with complex datasets or when you want to group different types of information separately.
Here’s an example of how to create multiple legends with titles using matplotlib:
import matplotlib.pyplot as plt

# Create some sample data
x = [1, 2, 3, 4, 5]
y1 = [2, 4, 6, 8, 10]
y2 = [1, 3, 5, 7, 9]
y3 = [1, 2, 3, 4, 5]
y4 = [5, 4, 3, 2, 1]

# Create the plot
fig, ax = plt.subplots()
line1, = ax.plot(x, y1, 'r-', label='Line 1')
line2, = ax.plot(x, y2, 'b-', label='Line 2')
line3, = ax.plot(x, y3, 'g--', label='Line 3')
line4, = ax.plot(x, y4, 'm--', label='Line 4')

# Create the first legend
legend1 = ax.legend(handles=[line1, line2], title='How2Matplotlib.com Solid Lines', loc='upper left')

# Add the first legend manually to the axis
ax.add_artist(legend1)

# Create the second legend
ax.legend(handles=[line3, line4], title='How2Matplotlib.com Dashed Lines', loc='lower right')

# Show the plot
plt.show()
Output:
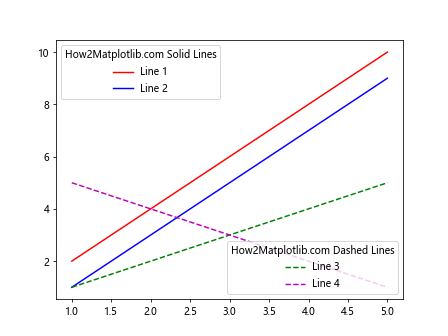
In this example, we’ve created two separate legends, each with its own title. We use ax.add_artist() to manually add the first legend to the axis, allowing us to create a second legend without overwriting the first one.
Matplotlib Legend Title in Subplots
When working with subplots in Matplotlib, you might want to add legend titles to each subplot individually. This can help distinguish between different datasets or highlight specific aspects of your data visualization.
Here’s an example of how to add matplotlib legend titles to subplots:
import matplotlib.pyplot as plt

# Create some sample data
x = [1, 2, 3, 4, 5]
y1 = [2, 4, 6, 8, 10]
y2 = [1, 3, 5, 7, 9]

# Create a figure with two subplots
fig, (ax1, ax2) = plt.subplots(1, 2, figsize=(12, 5))

# Plot data on the first subplot
ax1.plot(x, y1, label='Series A')
ax1.plot(x, y2, label='Series B')
ax1.legend(title='How2Matplotlib.com Subplot 1')

# Plot data on the second subplot
ax2.scatter(x, y1, label='Points A')
ax2.scatter(x, y2, label='Points B')
ax2.legend(title='How2Matplotlib.com Subplot 2')

# Adjust the layout and show the plot
plt.tight_layout()
plt.show()
Output:
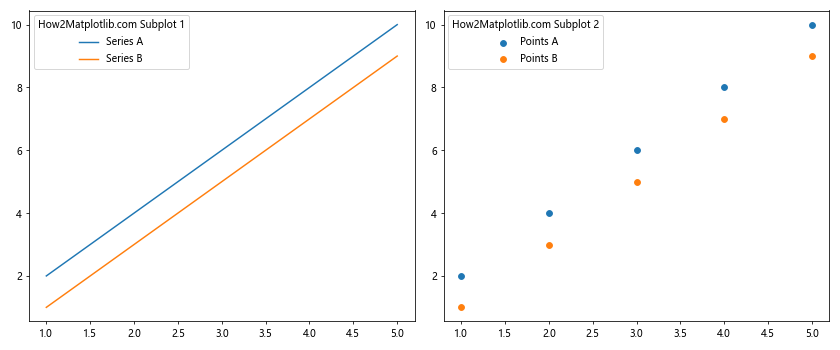
In this example, we’ve created two subplots side by side. Each subplot has its own legend with a unique title, allowing us to provide context for the data in each subplot independently.
Styling Matplotlib Legend Title with Different Fonts
The font used for your matplotlib legend title can significantly impact the overall look of your visualization. Matplotlib allows you to use different fonts for your legend title, giving you the flexibility to match your plot’s style or make the title stand out.
Here’s an example of how to use different fonts for your matplotlib legend title:
import matplotlib.pyplot as plt
from matplotlib import font_manager

# Create some sample data
categories = ['A', 'B', 'C', 'D']
values = [4, 7, 2, 5]

# Create the plot
plt.bar(categories, values)

# Define a custom font
custom_font = font_manager.FontProperties(family='serif', style='italic', size=16)

# Add a legend with a custom font title
plt.legend(['How2Matplotlib.com Data'], title='Custom Font Title', title_fontproperties=custom_font)

# Show the plot
plt.show()
Output:
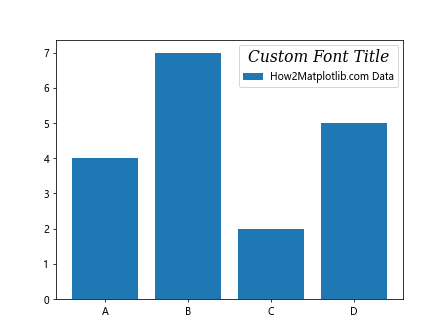
In this example, we’ve used the FontProperties class to define a custom font for our legend title. The title_fontproperties parameter in the legend() function allows us to apply this custom font to the title.
Aligning Matplotlib Legend Title
The alignment of your matplotlib legend title can affect the overall balance and readability of your plot. Matplotlib provides options to align the legend title to the left, center, or right of the legend box.
Here’s an example demonstrating how to align the matplotlib legend title:
import matplotlib.pyplot as plt

# Create some sample data
x = [1, 2, 3, 4, 5]
y1 = [2, 4, 6, 8, 10]
y2 = [1, 3, 5, 7, 9]

# Create the plot
plt.plot(x, y1, label='Series 1')
plt.plot(x, y2, label='Series 2')

# Add a legend with a right-aligned title
legend = plt.legend(title='How2Matplotlib.com Data')
legend._loc = 2  # Place legend in upper left
plt.setp(legend.get_title(), ha='right')  # Align title to the right

# Show the plot
plt.show()
Output:
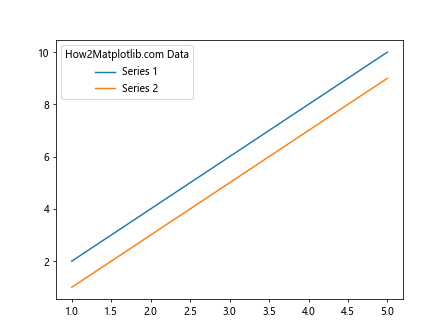
In this example, we’ve used plt.setp() to set the horizontal alignment (ha) of the legend title to ‘right’. You can also use ‘left’ or ‘center’ for different alignments.
Using Matplotlib Legend Title with Colorbar
When working with colormaps in Matplotlib, you might want to add a title to the colorbar legend. This can provide additional context for the color-coded data in your visualization.
Here’s an example of how to add a title to a colorbar legend:
import matplotlib.pyplot as plt
import numpy as np

# Create some sample data
x = np.linspace(0, 10, 100)
y = np.linspace(0, 10, 100)
X, Y = np.meshgrid(x, y)
Z = np.sin(X) * np.cos(Y)

# Create the plot
plt.figure(figsize=(10, 8))
c = plt.pcolormesh(X, Y, Z, cmap='viridis')

# Add a colorbar with a title
cbar = plt.colorbar()
cbar.set_label('How2Matplotlib.com Color Scale', rotation=270, labelpad=15)

# Show the plot
plt.show()
Output:
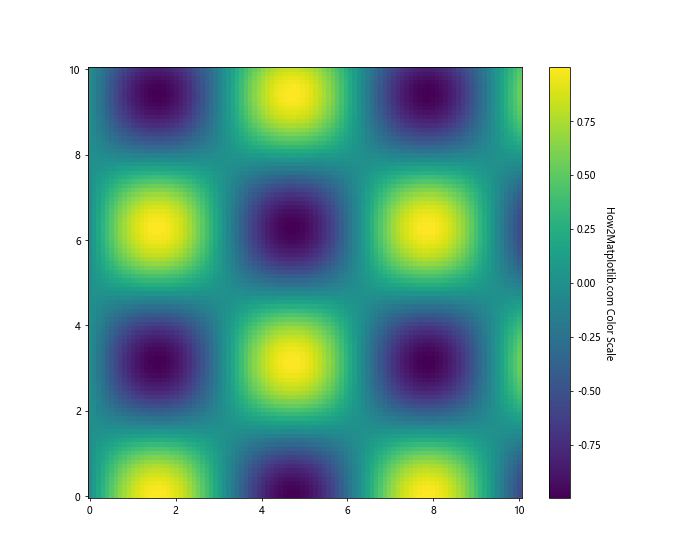
In this example, we’ve created a 2D color plot and added a colorbar. The set_label() method is used to add a title to the colorbar, effectively serving as a legend title for the color-coded data.
Matplotlib Legend Title in 3D Plots
When creating 3D plots with Matplotlib, you can still use legend titles to provide context for your data. The process is similar to 2D plots, but there are some considerations specific to 3D visualizations.
Here’s an example of how to add a legend title to a 3D plot:
import matplotlib.pyplot as plt
import numpy as np

# Create some sample data
x = np.linspace(-5, 5, 100)
y = np.linspace(-5, 5, 100)
X, Y = np.meshgrid(x, y)
Z1 = np.sin(np.sqrt(X**2 + Y**2))
Z2 = np.cos(np.sqrt(X**2 + Y**2))

# Create the 3D plot
fig = plt.figure(figsize=(10, 8))
ax = fig.add_subplot(111, projection='3d')

# Plot the surfaces
surf1 = ax.plot_surface(X, Y, Z1, cmap='viridis', alpha=0.7)
surf2 = ax.plot_surface(X, Y, Z2, cmap='plasma', alpha=0.7)

# Add a legend with a title
ax.legend([surf1, surf2], ['Sin', 'Cos'], title='How2Matplotlib.com 3D Functions')

# Show the plot
plt.show()
Output:
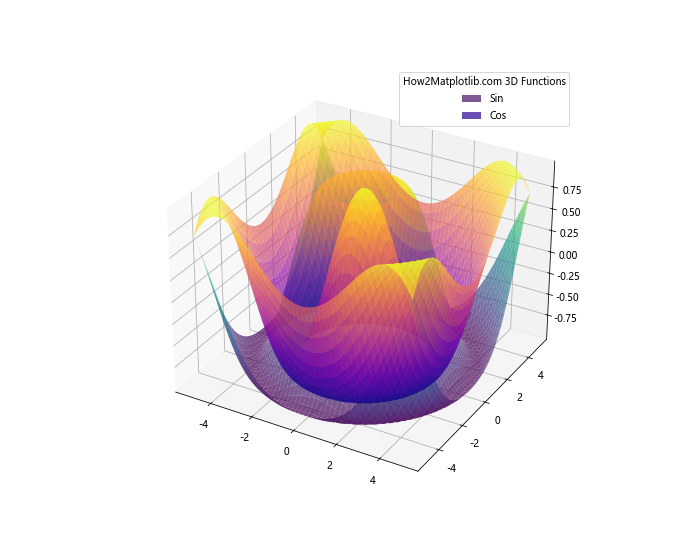
In this example, we’ve created two 3D surfaces and added a legend with a title. Note that in 3D plots, the legend entries are often proxy artists that represent the surfaces or other 3D elements.
Using HTML in Matplotlib Legend Title
Matplotlib allows you to use HTML-like text in your legend titles, giving you more flexibility in formatting and styling. This can be particularly useful when you need to include special characters, subscripts, or superscripts in your legend title.
Here’s an example of how to use HTML in a matplotlib legend title:
import matplotlib.pyplot as plt

# Create some sample data
x = [1, 2, 3, 4, 5]
y1 = [2, 4, 6, 8, 10]
y2 = [1, 3, 5, 7, 9]

# Create the plot
plt.plot(x, y1, label='Series 1')
plt.plot(x, y2, label='Series 2')

# Add a legend with an HTML-formatted title
plt.legend(title='How2Matplotlib.com
Data Series')

# Enable HTML support
plt.rcParams['legend.title_fontsize'] = 'large'
plt.rcParams['legend.fontsize'] = 'medium'

# Show the plot
plt.show()
Output:
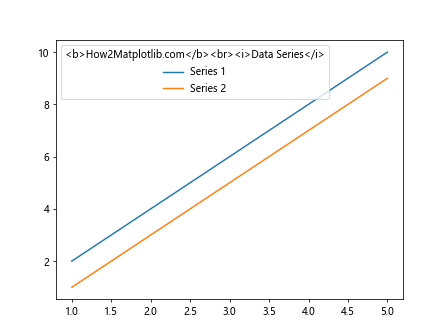
In this example, we’ve used HTML tags in the legend title to make part of the text bold and another part italic. Note that you need to enable HTML support by setting the appropriate rcParams.
Matplotlib Legend Title in Polar Plots
When working with polar plots in Matplotlib, you can still add legend titles to provide context for your data. The process is similar to Cartesian plots, but there are some considerations specific to polar visualizations.
Here’s an example of how to add a legend title to a polar plot:
import matplotlib.pyplot as plt
import numpy as np

# Create some sample data
theta = np.linspace(0, 2*np.pi, 100)
r1 = np.abs(np.sin(2*theta))
r2 = np.abs(np.cos(3*theta))

# Create the polar plot
fig, ax = plt.subplots(subplot_kw=dict(projection='polar'))
ax.plot(theta, r1, label='Sin(2θ)')
ax.plot(theta, r2, label='Cos(3θ)')

# Add a legend with a title
ax.legend(title='How2Matplotlib.com Polar Functions')

# Show the plot
plt.show()
Output:
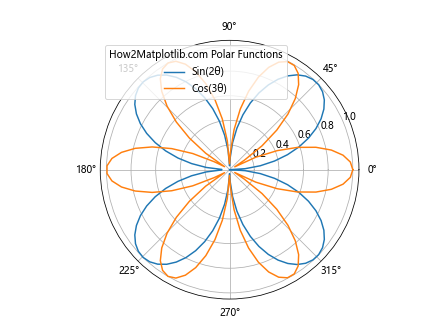
In this example, we’ve created a polar plot with two functions and added a legend with a title. The legend title provides a description of the data represented inthe polar plot.
Matplotlib Legend Title with Custom Markers
When your plot uses custom markers, you might want to reflect these in your legend. Matplotlib allows you to customize the legend markers and include them in the legend title for a more comprehensive description of your data.
Here’s an example of how to use custom markers in a matplotlib legend title:
import matplotlib.pyplot as plt

# Create some sample data
x = [1, 2, 3, 4, 5]
y1 = [2, 4, 6, 8, 10]
y2 = [1, 3, 5, 7, 9]

# Create the plot with custom markers
plt.plot(x, y1, 'ro-', label='Series 1')
plt.plot(x, y2, 'bs-', label='Series 2')

# Create a legend with custom markers in the title
legend = plt.legend(title='How2Matplotlib.com Data\n$\\bullet$ Red  $\\blacksquare$ Blue')

# Adjust the title position
plt.setp(legend.get_title(), multialignment='center')

# Show the plot
plt.show()
Output:
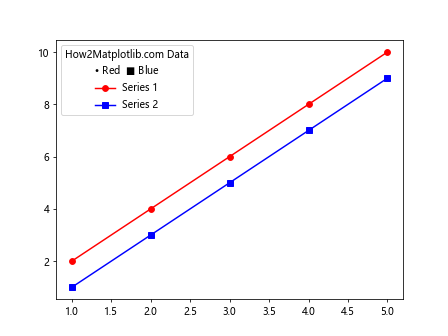
In this example, we’ve included custom markers (a red circle and a blue square) in the legend title using LaTeX syntax. This provides a visual reference for the markers used in the plot directly in the legend title.
Matplotlib Legend Title in Logarithmic Plots
When working with logarithmic scales in Matplotlib, you might want to reflect this in your legend title. This can help viewers quickly understand the scale of your data.
Here’s an example of how to add a legend title to a logarithmic plot:
import matplotlib.pyplot as plt
import numpy as np

# Create some sample data
x = np.logspace(0, 5, 100)
y1 = x**2
y2 = x**1.5

# Create the logarithmic plot
plt.loglog(x, y1, label='y = x^2')
plt.loglog(x, y2, label='y = x^1.5')

# Add a legend with a title indicating the logarithmic scale
plt.legend(title='How2Matplotlib.com\nLogarithmic Scale')

# Show the plot
plt.show()
Output:
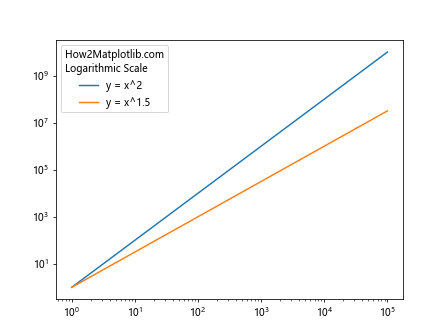
In this example, we’ve created a log-log plot and added a legend with a title that explicitly mentions the logarithmic scale. This helps viewers interpret the data correctly.
Using Matplotlib Legend Title with Hatches
Hatches are patterns used to fill plot elements like bars or regions. When using hatches in your plot, you might want to include this information in your legend title for clarity.
Here’s an example of how to use hatches and reflect them in the matplotlib legend title:
import matplotlib.pyplot as plt
import numpy as np

# Create some sample data
categories = ['A', 'B', 'C', 'D']
values1 = [4, 7, 2, 5]
values2 = [3, 6, 1, 4]

# Create the plot with hatches
fig, ax = plt.subplots()
ax.bar(categories, values1, label='Group 1', hatch='/')
ax.bar(categories, values2, bottom=values1, label='Group 2', hatch='\\')

# Add a legend with a title describing the hatches
ax.legend(title='How2Matplotlib.com Data\n/ Group 1  \\ Group 2')

# Show the plot
plt.show()
Output:
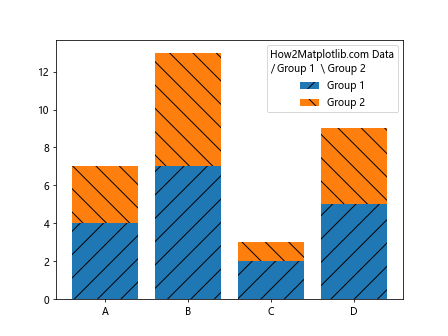
In this example, we’ve created a stacked bar chart with different hatch patterns for each group. The legend title includes a description of these hatch patterns, providing a clear reference for interpreting the plot.
Matplotlib Legend Title in Pie Charts
Pie charts in Matplotlib can also benefit from legend titles. These titles can provide context for the data represented in the pie slices.
Here’s an example of how to add a legend title to a pie chart:
import matplotlib.pyplot as plt

# Create some sample data
sizes = [30, 20, 25, 15, 10]
labels = ['A', 'B', 'C', 'D', 'E']
colors = ['red', 'green', 'blue', 'yellow', 'orange']

# Create the pie chart
plt.pie(sizes, labels=labels, colors=colors, autopct='%1.1f%%', startangle=90)

# Add a legend with a title
plt.legend(title='How2Matplotlib.com\nPie Chart Categories', loc='center left', bbox_to_anchor=(1, 0.5))

# Ensure the pie chart is circular
plt.axis('equal')

# Show the plot
plt.show()
Output:
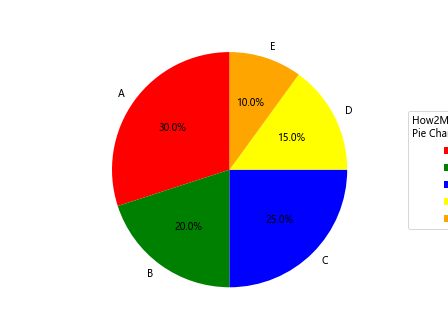
In this example, we’ve created a pie chart and added a legend with a title. The legend is positioned to the right of the pie chart for better visibility.
Matplotlib Legend Title with LaTeX
For scientific or mathematical plots, you might want to use LaTeX in your matplotlib legend title to display equations or special symbols correctly.
Here’s an example of how to use LaTeX in a matplotlib legend title:
import matplotlib.pyplot as plt
import numpy as np

# Create some sample data
x = np.linspace(0, 2*np.pi, 100)
y1 = np.sin(x)
y2 = np.cos(x)

# Create the plot
plt.plot(x, y1, label='sin(x)')
plt.plot(x, y2, label='cos(x)')

# Add a legend with a LaTeX title
plt.legend(title=r'$\mathbf{How2Matplotlib.com}$' + '\n' + r'$f(x) = \sin(x), \cos(x)$')

# Enable LaTeX rendering
plt.rcParams['text.usetex'] = True

# Show the plot
plt.show()
Output:
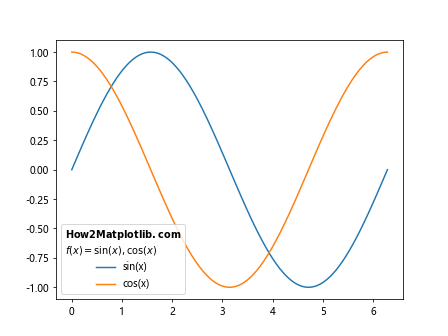
In this example, we’ve used LaTeX syntax in the legend title to display bold text and mathematical equations. Note that you need to enable LaTeX rendering by setting plt.rcParams['text.usetex'] = True.
Matplotlib legend title Conclusion
Mastering the matplotlib legend title is crucial for creating informative and visually appealing data visualizations. Throughout this comprehensive guide, we’ve explored various aspects of working with legend titles in Matplotlib, from basic implementation to advanced techniques.
We’ve covered topics such as customizing the appearance of legend titles, positioning them effectively, using multiple legends, working with subplots, and applying different fonts and styles. We’ve also delved into more specialized areas like using legend titles in 3D plots, animating them, incorporating HTML and LaTeX, and adapting them for different types of plots such as polar, logarithmic, and pie charts.
By understanding and applying these techniques, you can significantly enhance the clarity and impact of your data visualizations. Remember that the key to effective use of matplotlib legend title is to provide context that helps viewers interpret your data accurately and efficiently.