Lineplot Marker Size
In this article, we will explore how to customize the size of markers in a line plot using Matplotlib.
Basic Lineplot with Default Marker Size
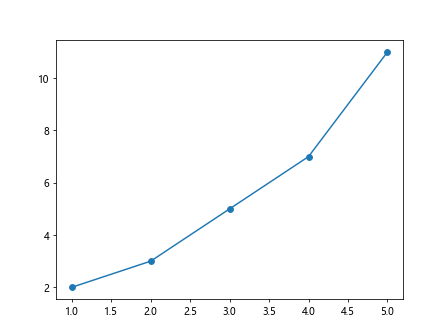
Let’s start by creating a basic line plot with default marker size. In this example, we will plot a simple line plot with markers.
import matplotlib.pyplot as plt

x = [1, 2, 3, 4, 5]
y = [2, 3, 5, 7, 11]

plt.plot(x, y, marker='o')
plt.show()
Output:
Setting Marker Size
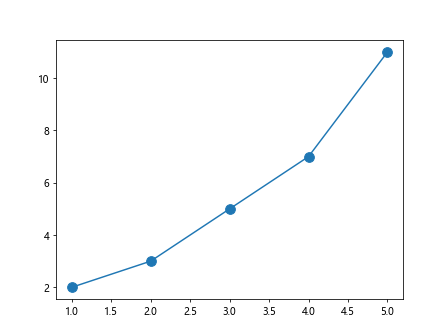
You can easily customize the size of markers in a line plot by using the markersize parameter. Let’s see an example of how to set the marker size to 10.
import matplotlib.pyplot as plt

x = [1, 2, 3, 4, 5]
y = [2, 3, 5, 7, 11]

plt.plot(x, y, marker='o', markersize=10)
plt.show()
Output:
Marker Size using Scatter Plot
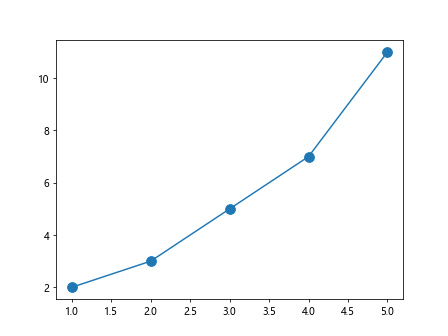
You can also create a line plot with markers using the scatter function in Matplotlib. Let’s see an example of how to create a line plot with markers using scatter.
import matplotlib.pyplot as plt

x = [1, 2, 3, 4, 5]
y = [2, 3, 5, 7, 11]

plt.scatter(x, y, marker='o', s=100)
plt.plot(x, y)
plt.show()
Output:
Variable Marker Size
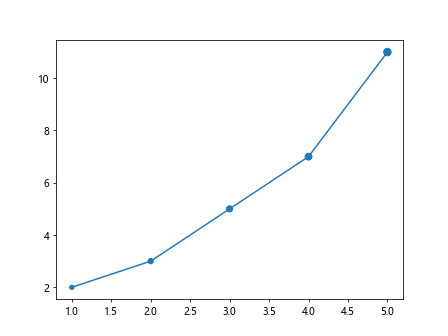
You can even set variable marker sizes for each data point in a line plot. Let’s see an example of how to set variable marker sizes based on a list of sizes.
import matplotlib.pyplot as plt

x = [1, 2, 3, 4, 5]
y = [2, 3, 5, 7, 11]

sizes = [20, 30, 40, 50, 60]

plt.scatter(x, y, marker='o', s=sizes)
plt.plot(x, y)
plt.show()
Output:
Using Size as a Data Point
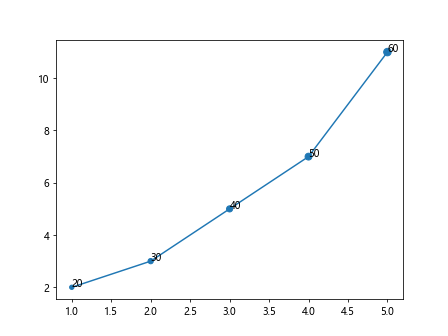
In some cases, you may want to use the marker size as another data point in your dataset. Let’s see an example of how to use the marker size as a data point in a line plot.
import matplotlib.pyplot as plt

x = [1, 2, 3, 4, 5]
y = [2, 3, 5, 7, 11]

sizes = [20, 30, 40, 50, 60]

plt.scatter(x, y, marker='o', s=sizes)
plt.plot(x, y)
for i, txt in enumerate(sizes):
    plt.annotate(txt, (x[i], y[i]))
plt.show()
Output:
Customizing Marker Size with Colormap
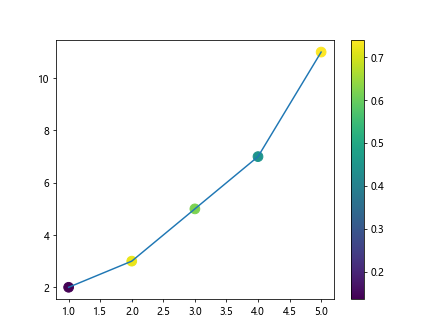
You can also customize the marker size based on a colormap in Matplotlib. Let’s see an example of how to customize the marker size using a colormap.
import numpy as np
import matplotlib.pyplot as plt

x = [1, 2, 3, 4, 5]
y = [2, 3, 5, 7, 11]

colors = np.random.rand(5)
plt.scatter(x, y, c=colors, cmap='viridis', s=100)
plt.plot(x, y)
plt.colorbar()
plt.show()
Output:
Varying Marker Size with Data Point
You can even vary the marker size based on another data point in your dataset. Let’s see an example of how to vary the marker size based on another data point.
import matplotlib.pyplot as plt

x = [1, 2, 3, 4, 5]
y = [2, 3, 5, 7, 11]

sizes = np.array([20, 30, 40, 50, 60])
z = [1, 2, 3, 4, 5]

plt.scatter(x, y, c=z, s=sizes*10, cmap='viridis')
plt.plot(x, y)
plt.colorbar()
plt.show()
Customizing Marker Size in Subplots
You can also customize the marker size in subplots. Let’s see an example of how to create subplots with custom marker sizes.
import matplotlib.pyplot as plt

x = [1, 2, 3, 4, 5]
y = [2, 3, 5, 7, 11]

fig, axs = plt.subplots(2)
fig.suptitle('Custom Marker Sizes in Subplots')

axs[0].scatter(x, y, marker='o', s=100)
axs[0].plot(x, y)

axs[1].scatter(x, np.array(y)*2, marker='o', s=200)
axs[1].plot(x, np.array(y)*2)

plt.show()
Conclusion
In this article, we have explored how to customize the size of markers in a line plot using Matplotlib. We have seen examples of setting marker size, using variable marker sizes, customizing marker size with colormaps, and more. Experiment with these examples to create visually appealing line plots with custom marker sizes.