Matplotlib Marker Line Width
Matplotlib is a popular data visualization library in Python that provides a variety of options for customizing the appearance of your plots. One such option is the marker line width, which allows you to adjust the thickness of the lines outlining markers in your plot. In this article, we will explore how to control the marker line width in Matplotlib with detailed examples.
Setting Marker Line Width
You can set the marker line width in Matplotlib by using the linewidth or lw parameter in the plot() function. The line width value is a float that specifies the thickness of the marker outline. Let’s look at some examples:
import matplotlib.pyplot as plt

plt.plot([1, 2, 3, 4], [1, 4, 9, 16], marker='o', markersize=10, linewidth=2)
plt.show()
Output:
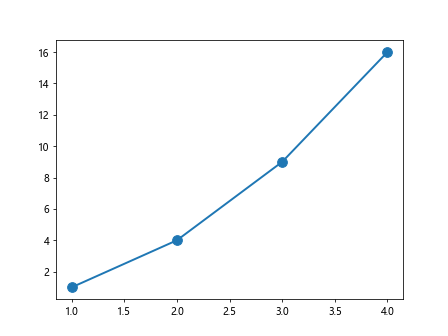
In the above example, we have set the marker line width to 2 using the linewidth parameter.
Customizing Marker Line Width
You can also customize the marker line width based on certain conditions or data values. For example, you can create a scatter plot where the marker line width varies based on the data points. Let’s see how you can achieve this:
import matplotlib.pyplot as plt
import numpy as np

# Generate random data
x = np.random.rand(50)
y = np.random.rand(50)
sizes = np.random.randint(1, 10, 50)
linewidths = np.random.rand(50) * 5

plt.scatter(x, y, s=sizes, linewidths=linewidths)
plt.show()
Output:
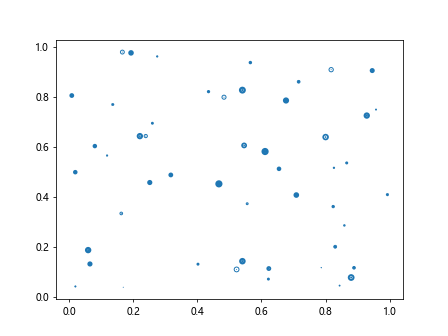
In the above example, we have specified different marker line widths for each data point based on the linewidths array.
Using Marker Line Width with Different Markers
You can combine marker line width with different marker types to create customized plots. Let’s look at an example where we use different markers with varying line widths:
import matplotlib.pyplot as plt

plt.plot([1, 2, 3, 4], [1, 4, 9, 16], marker='o', markersize=10, linewidth=2)
plt.plot([1, 2, 3, 4], [2, 5, 10, 17], marker='s', markersize=10, linewidth=3)
plt.plot([1, 2, 3, 4], [3, 6, 11, 18], marker='*', markersize=10, linewidth=4)
plt.show()
Output:
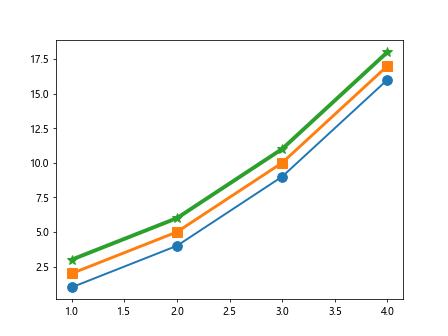
In this example, we have used three different markers (o, s, *) with varying line widths.
Changing Marker Line Width in Scatter Plots
You can also adjust the marker line width in scatter plots using the scatter() function. The linewidth parameter in the scatter() function allows you to control the thickness of the marker outlines. Let’s see an example:
import matplotlib.pyplot as plt
import numpy as np

# Generate random data
x = np.random.rand(50)
y = np.random.rand(50)
sizes = np.random.randint(1, 10, 50)
linewidths = np.random.rand(50) * 5

plt.scatter(x, y, s=sizes, linewidth=linewidths)
plt.show()
Output:

In this example, we have set the marker line widths based on the linewidths array in a scatter plot.
Controlling Marker Line Width in Bar Plots
You can even adjust the marker line width in bar plots in Matplotlib. By specifying the linewidth parameter in the bar() function, you can customize the thickness of the marker outlines for each bar. Let’s look at an example:
import matplotlib.pyplot as plt

height = [3, 12, 5, 18, 7]
bars = ('A', 'B', 'C', 'D', 'E')
linewidths = [1, 2, 3, 4, 5]

plt.bar(bars, height, linewidth=linewidths)
plt.show()
Output:
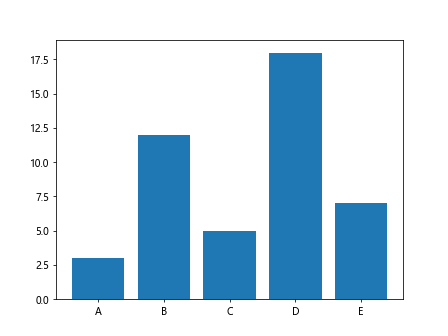
In this example, we have set different marker line widths for each bar in a bar plot.
Highlighting Specific Data Points with Marker Line Width
You can use marker line width to highlight specific data points in your plot. By increasing the line width for certain markers, you can draw attention to important elements in your visualization. Let’s see an example:
import matplotlib.pyplot as plt

x = [1, 2, 3, 4, 5]
y = [2, 3, 5, 7, 11]
colors = ['red' if val > 5 else 'blue' for val in y]
linewidths = [3 if val > 5 else 1 for val in y]

plt.scatter(x, y, color=colors, linewidths=linewidths)
plt.show()
Output:
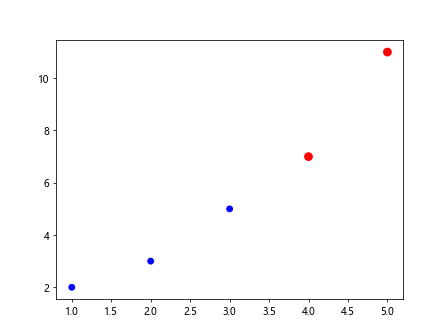
In this example, we have increased the marker line width for data points with values greater than 5 to highlight them in the scatter plot.
Adjusting Marker Line Width with Legends
You can also adjust the marker line width in plots with legends to differentiate between different data series. By setting the line width for each marker, you can easily identify which data points belong to each series. Let’s look at an example with legends:
import matplotlib.pyplot as plt

x = [1, 2, 3, 4]
y1 = [1, 4, 9, 16]
y2 = [1, 3, 6, 10]

plt.plot(x, y1, marker='o', markersize=10, linewidth=2, label='Series 1')
plt.plot(x, y2, marker='s', markersize=10, linewidth=2, label='Series 2')
plt.legend()
plt.show()
Output:
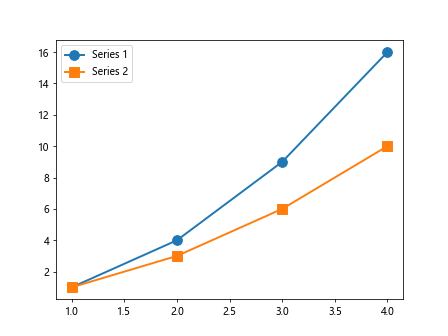
In this example, we have set the same marker line width for both data series and added a legend to differentiate between them in the plot.
Combining Marker Line Width with Line Plots
You can combine marker line width with line plots to enhance the appearance of your visualization. By adjusting the line width and marker size, you can create a visually appealing plot that effectively communicates your data. Let’s see an example:
import matplotlib.pyplot as plt

x = [1, 2, 3, 4, 5]
y = [2, 4, 6, 8, 10]

plt.plot(x, y, marker='o', markersize=10, linewidth=2)
plt.show()
Output:
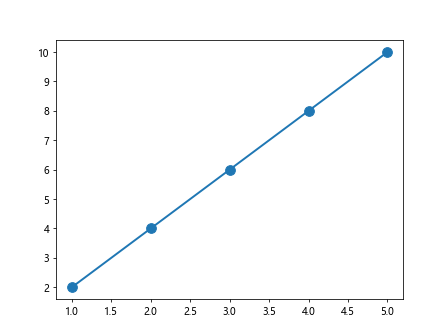
In this example, we have set the marker line width and size for a line plot to create a distinctive visual effect.
Conclusion
In this article, we have explored how to adjust the marker line width in Matplotlib plots with various examples. By customizing the thickness of the marker outlines, you can enhance the appearance of your visualizations and draw attention to specific data points. Experiment with different line widths and marker types to create visually compelling plots that effectively convey your data insights. Visit how2matplotlib.com for more tutorials and resources on Matplotlib customization.