Matplotlib Multiple Plots on Same Figure
When working with data visualization using Matplotlib, it is often necessary to create multiple plots on the same figure in order to compare different datasets, visualize multiple dimensions of data, or show different aspects of the same data.
In this tutorial, we will explore various methods to create multiple plots on the same figure in Matplotlib. We will cover techniques like using subplots, adding multiple axes to a figure, and overlaying plots on the same set of axes.
1. Using Subplots
One common way to create multiple plots on the same figure is to use the subplot function in Matplotlib. Subplots allow you to divide the figure into a grid of rows and columns and create plots within each cell of the grid.
import matplotlib.pyplot as plt

# Create a figure and a set of subplots
fig, axs = plt.subplots(2, 2)

# Plot on the first subplot
axs[0, 0].plot([1, 2, 3, 4], [1, 4, 9, 16])

# Plot on the second subplot
axs[0, 1].plot([1, 2, 3, 4], [1, 2, 3, 4])

# Plot on the third subplot
axs[1, 0].plot([1, 2, 3, 4], [4, 3, 2, 1])

# Plot on the fourth subplot
axs[1, 1].plot([1, 2, 3, 4], [1, 3, 5, 7])

plt.show()
Output:
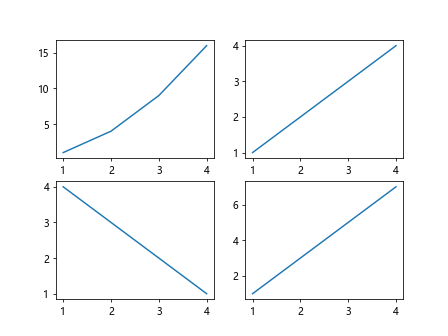
In this example, we create a 2×2 grid of subplots and plot different datasets in each subplot.
2. Adding Multiple Axes to a Figure
Another way to create multiple plots on the same figure is to add multiple axes to a single figure. This allows you to have full control over the layout and positioning of each plot.
import matplotlib.pyplot as plt

# Create a figure and axis
fig, ax1 = plt.subplots()

# Create a second axis that shares the same x-axis with the first axis
ax2 = ax1.twinx()

# Plot on the first axis
ax1.plot([1, 2, 3, 4], [1, 4, 9, 16], 'r-')

# Plot on the second axis
ax2.plot([1, 2, 3, 4], [1, 2, 3, 4], 'b-')

plt.show()
Output:
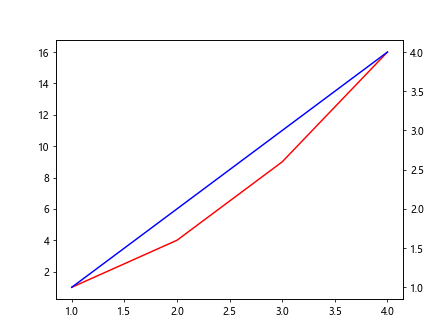
In this example, we create two axes on the same figure and plot different datasets on each axis. The twinx function allows the second axis to share the x-axis with the first axis.
3. Overlaying Plots on the Same Axes
You can also overlay multiple plots on the same set of axes by calling the plot function multiple times within the same code block.
import matplotlib.pyplot as plt

# Create a figure and axis
fig, ax = plt.subplots()

# Plot the first dataset
ax.plot([1, 2, 3, 4], [1, 4, 9, 16], 'r-')

# Plot the second dataset
ax.plot([1, 2, 3, 4], [1, 2, 3, 4], 'b-')

plt.show()
Output:
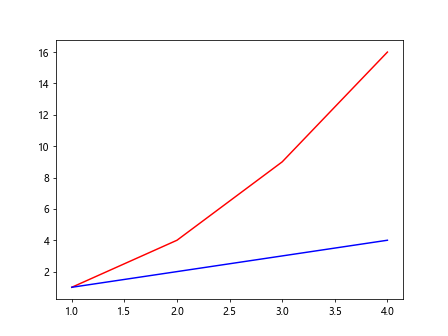
In this example, we plot two datasets on the same set of axes by calling the plot function twice. Each call to plot adds a new line plot to the existing axes.
4. Customizing Multiple Plots
When creating multiple plots on the same figure, it is often necessary to customize the appearance of each plot to distinguish between them. This can be done by specifying different colors, line styles, markers, and labels for each plot.
import matplotlib.pyplot as plt

# Create a figure and axis
fig, ax = plt.subplots()

# Plot the first dataset with a red dotted line and circle markers
ax.plot([1, 2, 3, 4], [1, 4, 9, 16], 'r--o', label='Dataset 1')

# Plot the second dataset with a blue dashed line and square markers
ax.plot([1, 2, 3, 4], [1, 2, 3, 4], 'b--s', label='Dataset 2')

# Add a legend to the plot
ax.legend()

plt.show()
Output:
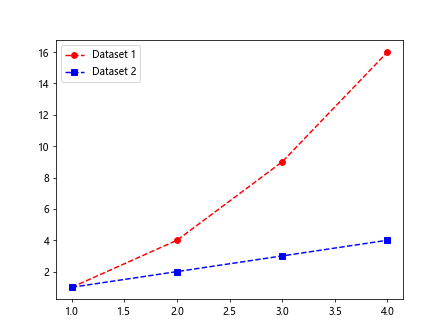
In this example, we customize the appearance of each plot by specifying different line styles (--), markers (o, s), and colors (red and blue). We also add labels to each plot and create a legend to distinguish between them.
5. Combining Subplots and Overlaying Plots
You can also combine the techniques of using subplots and overlaying plots to create complex figures with multiple plots.
import matplotlib.pyplot as plt

# Create a figure and a set of subplots
fig, axs = plt.subplots(2, 1)

# Plot on the first subplot
axs[0].plot([1, 2, 3, 4], [1, 4, 9, 16], 'r-')

# Plot on the second subplot
axs[1].plot([1, 2, 3, 4], [1, 2, 3, 4], 'b-')

# Overlay a new plot on the first subplot
axs[0].plot([1, 2, 3, 4], [4, 3, 2, 1], 'g--')

plt.show()
Output:
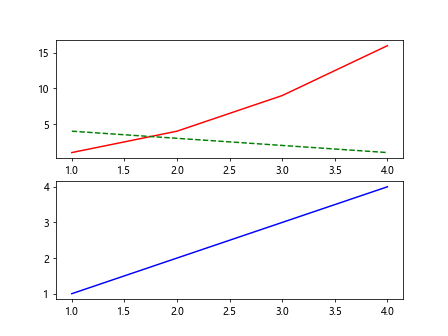
In this example, we create a 2×1 grid of subplots and plot different datasets in each subplot. Additionally, we overlay a new plot on the first subplot to show multiple plots on the same set of axes.
Conclusion
In this tutorial, we have explored various methods to create multiple plots on the same figure in Matplotlib. We have covered techniques like using subplots, adding multiple axes to a figure, overlaying plots on the same set of axes, and customizing multiple plots.
By mastering these techniques, you can create complex and informative visualizations that allow you to compare different datasets, visualize multiple dimensions of data, and show different aspects of the same data. Experiment with the code examples provided and explore the full range of possibilities that Matplotlib offers for creating multiple plots on the same figure.