Matplotlib Axis Label Font Size
Matplotlib is a widely used Python library for creating visualizations. When creating plots using Matplotlib, it is important to properly format the axis labels to ensure the plot is easy to read and understand. One aspect of formatting axis labels is adjusting the font size. In this article, we will explore how to change the font size of axis labels in Matplotlib.
Setting the Font Size of Axis Labels
To set the font size of axis labels in Matplotlib, we can use the fontsize parameter in the xlabel() and ylabel() functions. This parameter allows us to specify the font size in points. Let’s see how this works with some examples:
import matplotlib.pyplot as plt

# Create a sample plot
plt.plot([1, 2, 3, 4], [1, 4, 9, 16])

# Set the font size of the x-axis label to 12
plt.xlabel('X Axis Label', fontsize=12)

# Set the font size of the y-axis label to 14
plt.ylabel('Y Axis Label', fontsize=14)

plt.show()
Output:
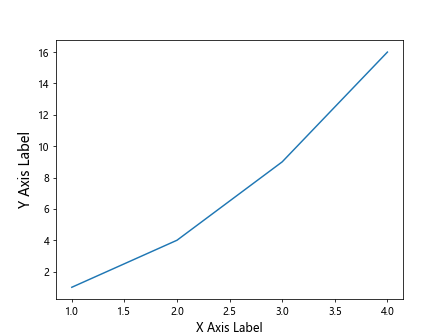
In the code above, we use the fontsize parameter to set the font size of the x-axis label to 12 points and the y-axis label to 14 points. By adjusting these values, we can customize the appearance of our plot’s axis labels.
Changing the Font Size of Tick Labels
In addition to the axis labels, we may also want to adjust the font size of the tick labels on the axes. We can do this by setting the xticks() and yticks() functions with the fontsize parameter. Let’s take a look at an example:
import matplotlib.pyplot as plt

# Create a sample plot
plt.plot([1, 2, 3, 4], [1, 4, 9, 16])

# Set the font size of the x-axis tick labels to 10
plt.xticks(fontsize=10)

# Set the font size of the y-axis tick labels to 12
plt.yticks(fontsize=12)

plt.show()
Output:
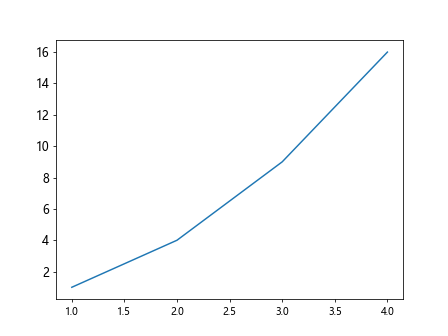
In the code snippet above, we use the fontsize parameter within the xticks() and yticks() functions to adjust the font size of the x-axis and y-axis tick labels, respectively.
Adjusting the Font Size of Tick Label Rotation
We can also control the rotation of the tick labels on the axes in Matplotlib. The rotation parameter allows us to specify the rotation angle of the tick labels. Let’s see how to adjust the font size and rotation of tick labels with an example:
import matplotlib.pyplot as plt

# Create a sample plot
plt.plot([1, 2, 3, 4], [1, 4, 9, 16])

# Set the font size of the x-axis tick labels to 12 and rotate them by 45 degrees
plt.xticks(fontsize=12, rotation=45)

# Set the font size of the y-axis tick labels to 10 and rotate them by -30 degrees
plt.yticks(fontsize=10, rotation=-30)

plt.show()
Output:
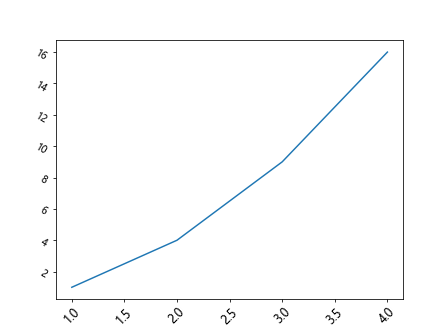
In the code snippet above, we adjust the font size of the x-axis and y-axis tick labels with the fontsize parameter and rotate them using the rotation parameter.
Adding a Title with Custom Font Size
In addition to the axis labels and tick labels, we may also want to customize the font size of the plot title. We can use the title() function in Matplotlib to add a title to the plot. Let’s see how to set a custom font size for the plot title with an example:
import matplotlib.pyplot as plt

# Create a sample plot
plt.plot([1, 2, 3, 4], [1, 4, 9, 16])

# Add a title to the plot with a font size of 16
plt.title('Sample Plot', fontsize=16)

plt.show()
Output:
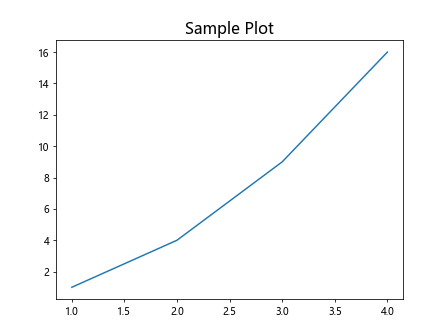
In the code snippet above, we use the fontsize parameter within the title() function to set the font size of the plot title to 16 points.
Changing the Font Size of Axis Labels in Subplots
When working with subplots in Matplotlib, it is important to be able to adjust the font size of axis labels for each individual subplot. We can accomplish this by iterating through each subplot and setting the font size of the axis labels. Let’s see how to do this with an example:
import matplotlib.pyplot as plt

# Create two subplots
fig, (ax1, ax2) = plt.subplots(1, 2)

# Plot on the first subplot
ax1.plot([1, 2, 3, 4], [1, 4, 9, 16])
ax1.set_xlabel('X Axis Label Subplot 1', fontsize=12)
ax1.set_ylabel('Y Axis Label Subplot 1', fontsize=10)

# Plot on the second subplot
ax2.plot([1, 4, 9, 16], [1, 2, 3, 4])
ax2.set_xlabel('X Axis Label Subplot 2', fontsize=14)
ax2.set_ylabel('Y Axis Label Subplot 2', fontsize=16)

plt.show()
Output:
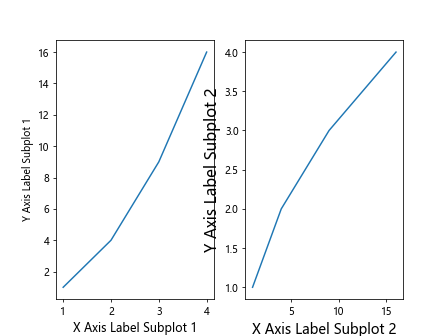
In the code above, we create two subplots and set the font size of the axis labels for each subplot individually by using the set_xlabel() and set_ylabel() functions.
Adjusting the Font Size of Axis Labels in Polar Plots
Polar plots are a special type of plot in Matplotlib that display data in polar coordinates. To change the font size of the axis labels in polar plots, we can use the fontsize parameter within the set_xlabel() and set_ylabel() functions. Let’s see how this works with an example:
import matplotlib.pyplot as plt
import numpy as np

# Create a polar plot
r = np.arange(0, 2, 0.01)
theta = 2 * np.pi * r

fig, ax = plt.subplots(subplot_kw={'projection': 'polar'})
ax.plot(theta, r)
ax.set_xlabel('Theta Axis Label', fontsize=12)
ax.set_ylabel('R Axis Label', fontsize=14)

plt.show()
Output:
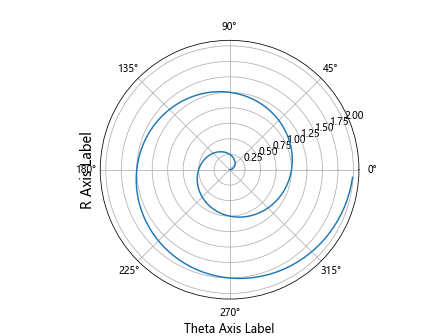
In the code snippet above, we create a polar plot and adjust the font size of the theta axis label to 12 points and the r axis label to 14 points using the set_xlabel() and set_ylabel() functions.
Changing the Font Size of Colorbar Labels
In some plots, such as heatmaps or contour plots, we may need to adjust the font size of the colorbar labels. We can do this by using the cbar.ax.tick_params() function in Matplotlib with the labelsize parameter. Let’s see how to change the font size of colorbar labels with an example:
import matplotlib.pyplot as plt
import numpy as np

# Create a heatmap
data = np.random.rand(10, 10)
plt.imshow(data, cmap='hot', interpolation='nearest')

# Add a colorbar
cbar = plt.colorbar()
cbar.ax.tick_params(labelsize=12)

plt.show()
Output:
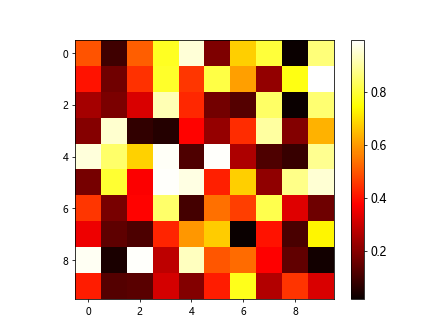
In the code above, we generate a random heatmap and adjust the font size of the colorbar labels to 12 points using the cbar.ax.tick_params() function.
Customizing the Font Size of Legend Labels
When adding a legend to a plot in Matplotlib, we may want to adjust the font size of the legend labels. We can do this by using the fontsize parameter within the legend() function. Let’s see how to customize the font size of legend labels with an example:
import matplotlib.pyplot as plt

# Create a sample plot
x = [1, 2, 3, 4]
y1 = [1, 2, 3, 4]
y2 = [4, 3, 2, 1]

plt.plot(x, y1, label='Line 1')
plt.plot(x, y2, label='Line 2')

# Add a legend with a font size of 14
plt.legend(fontsize=14)

plt.show()
Output:
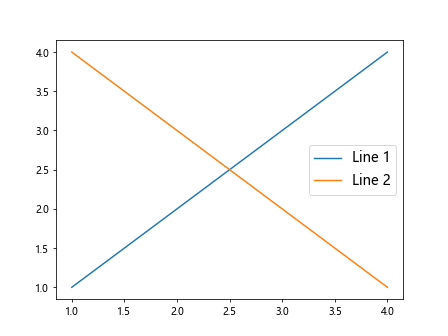
In the code snippet above, we use the fontsize parameter within the legend() function to set the font size of the legend labels to 14 points.
Wrapping Up
In this article, we have explored how to change the font size of axis labels in Matplotlib. We have covered setting thefont size of axis labels, tick labels, plot titles, and other elements in various types of plots, including subplots, polar plots, colorbar labels, and legend labels. By adjusting the font size of these elements, we can enhance the readability and appearance of our plots.
Throughout the examples provided, we have demonstrated how to use the fontsize parameter in conjunction with relevant functions to customize the font size of different plot elements. By experimenting with different font sizes, rotations, and styling options, we can create visually appealing plots tailored to our specific needs.
Remember that adjusting the font size is just one aspect of customizing the appearance of plots in Matplotlib. There are many other formatting options available, such as changing font styles, colors, and alignments, that can further enhance the visual presentation of your plots.
As you continue to work with Matplotlib and create data visualizations, consider exploring additional customization options to fine-tune the appearance of your plots. Experiment with different settings, styles, and parameters to create plots that effectively communicate your data and insights.