Matplotlib Annotate Text
Matplotlib is a powerful data visualization library in Python that allows you to create a wide variety of plots. One common feature in matplotlib is the ability to annotate text on plots. In this article, we will explore how to use the annotate function in matplotlib to add text annotations to your plots.
Basic Syntax
The basic syntax for annotating text in matplotlib is as follows:
import matplotlib.pyplot as plt

plt.plot([1, 2, 3, 4])
plt.annotate('Text to annotate', (2, 2))
plt.show()
Output:
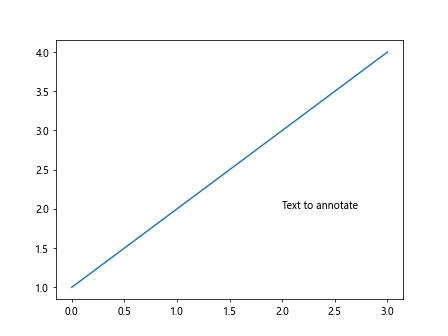
In this example, we are adding the text ‘Text to annotate’ at the point (2, 2) on the plot.
Annotating with Arrows
You can also add an arrow to your annotation to point to a specific location on the plot. Here’s an example:
import matplotlib.pyplot as plt

plt.plot([1, 2, 3, 4])
plt.annotate('Annotated text with arrow', (3, 3), arrowprops=dict(arrowstyle='->'))
plt.show()
Output:
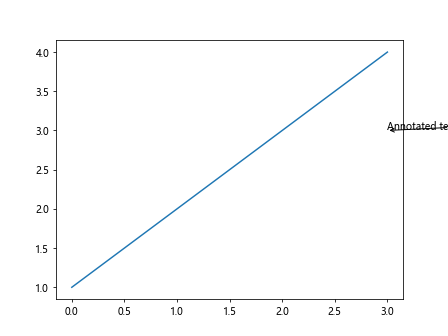
In this example, the annotation ‘Annotated text with arrow’ will be displayed at the point (3, 3) with an arrow pointing to it.
Customizing Annotations
You can customize the appearance of your annotations by specifying various properties such as the text color, text size, and arrow style. Here’s an example:
import matplotlib.pyplot as plt

plt.plot([1, 2, 3, 4])
plt.annotate('Customized annotation', (1, 1), color='red', fontsize=12, arrowprops=dict(arrowstyle='->', color='blue'))
plt.show()
Output:
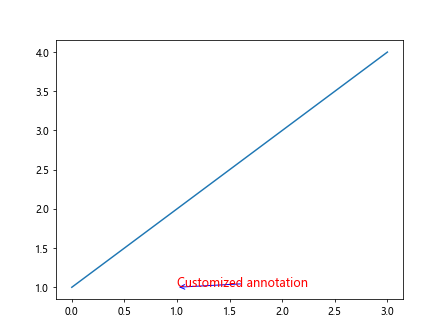
In this example, the annotation text will be displayed in red with a font size of 12, and the arrow pointing to it will be blue.
Annotation with Rotated Text
You can also rotate the annotation text to a specific angle. Here’s an example:
import matplotlib.pyplot as plt

plt.plot([1, 2, 3, 4])
plt.annotate('Rotated text', (2, 2), rotation=45)
plt.show()
Output:
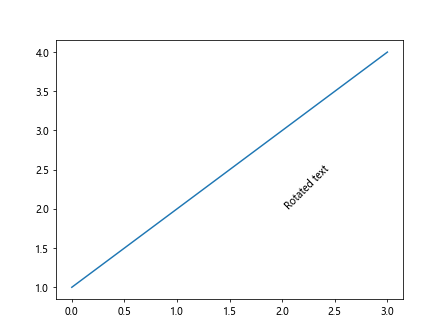
In this example, the text ‘Rotated text’ will be displayed at the point (2, 2) with a rotation angle of 45 degrees.
Annotating with a Box
You can add a bounding box around your annotation text to make it stand out. Here’s an example:
import matplotlib.pyplot as plt

plt.plot([1, 2, 3, 4])
plt.annotate('Text with box', (3, 3), bbox=dict(boxstyle='round,pad=1', fc='yellow', ec='red'))
plt.show()
Output:
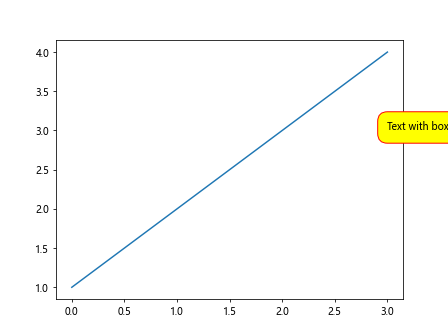
In this example, the text ‘Text with box’ will be displayed at the point (3, 3) with a yellow background and a red border around the bounding box.
Annotation with Connection Patch
You can connect your annotation text to a specific point on the plot using a ConnectionPatch. Here’s an example:
from matplotlib.patches import ConnectionPatch
import matplotlib.pyplot as plt

fig, ax = plt.subplots()
ax.plot([1, 2, 3, 4])
annot = ax.annotate('Annotated with connection patch', xy=(2, 2), xytext=(3, 3), arrowprops=dict(arrowstyle='->'))
connection_patch = ConnectionPatch(xyA=(3, 3), xyB=(2, 2), coordsA='data', coordsB='data', arrowstyle='-|>', linestyle='--', color='green')
ax.add_artist(connection_patch)
plt.show()
Output:
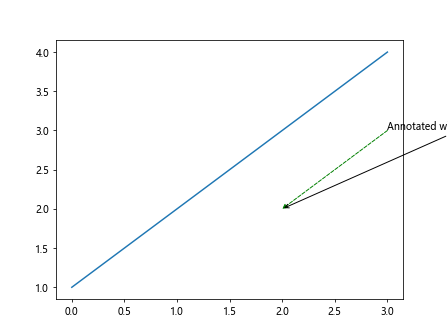
In this example, the text ‘Annotated with connection patch’ will be displayed at the point (2, 2) with an arrow pointing to the point (3, 3) on the plot.
Annotating Multiple Points
You can annotate multiple points on a plot with different text annotations. Here’s an example:
import matplotlib.pyplot as plt

plt.plot([1, 2, 3, 4])
plt.annotate('Point 1', (1, 1))
plt.annotate('Point 2', (2, 2))
plt.annotate('Point 3', (3, 3))
plt.annotate('Point 4', (4, 4))
plt.show()
Output:
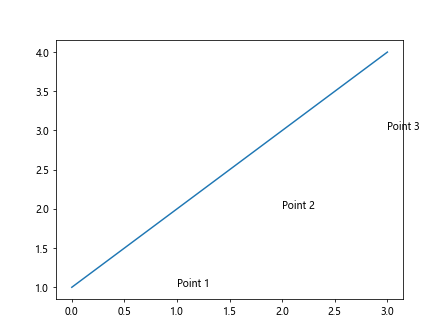
In this example, we are annotating four different points on the plot with the text ‘Point 1’, ‘Point 2’, ‘Point 3’, and ‘Point 4’.
Annotation with Math Text
You can also use math text in your annotations by enclosing the text in dollar signs. Here’s an example:
import matplotlib.pyplot as plt

plt.plot([1, 2, 3, 4])
plt.annotate(r'$\sum_{i=1}^{4}x_i$', (2, 2))
plt.show()
Output:
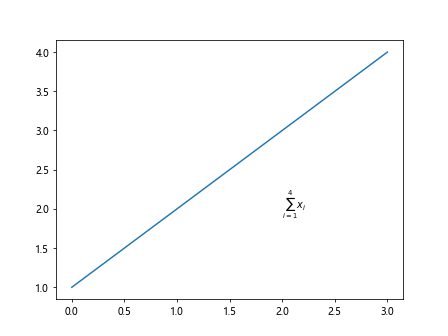
In this example, the math expression for the sum of x_i from 1 to 4 will be displayed at the point (2, 2) on the plot.
Annotation with Text Alignment
You can align the text within the annotation box using the ha and va parameters. Here’s an example:
import matplotlib.pyplot as plt

plt.plot([1, 2, 3, 4])
plt.annotate('Annotated text', (2, 2), ha='center', va='top')
plt.show()
Output:
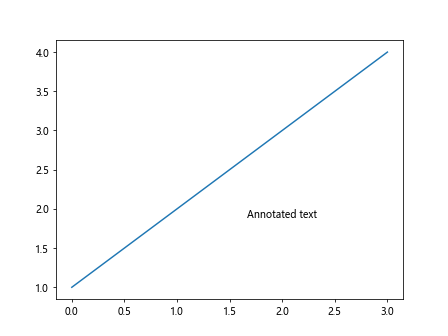
In this example, the text ‘Annotated text’ will be displayed at the point (2, 2) with center horizontal alignment and top vertical alignment within the annotation box.
Removing Annotations
You can remove annotations from a plot by using the remove() function. Here’s an example:
import matplotlib.pyplot as plt

plt.plot([1, 2, 3, 4])
annot = plt.annotate('Text to remove', (2, 2))
plt.show()

# Removing the annotation
annot.remove()
plt.show()
In this example, the text annotation ‘Text to remove’ at the point (2, 2) will be removed from the plot.
Conclusion
In this article, we have explored how to annotate text in matplotlib plots using the annotate function. We have covered various topics such as adding arrows to annotations, customizing annotations, rotating text, adding bounding boxes, connecting annotations with patches, annotating multiple points, using math text, aligning text, and removing annotations. By utilizing these techniques, you can enhance the readability and visual appeal of your plots. Experiment with different options and parameters to create informative and visually appealing annotations in your matplotlib plots.