How to add grid in Matplotlib
Matplotlib is a popular plotting library in Python that provides a wide variety of customizable plots. Adding grid lines to your plots can help in better understanding the data and improving the overall readability of the plot. In this article, we will explore different methods to add grid lines in Matplotlib.
Adding a simple grid to a plot
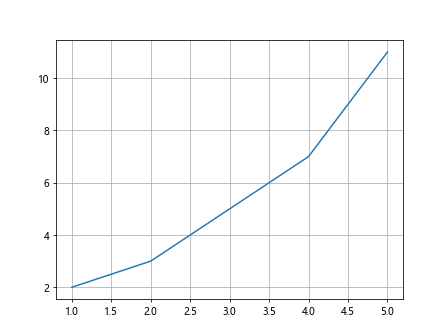
You can easily add grid lines to a plot using the grid method. By default, the grid lines will be added to both the x and y-axes.
import matplotlib.pyplot as plt

x = [1, 2, 3, 4, 5]
y = [2, 3, 5, 7, 11]

plt.plot(x, y)
plt.grid(True)
plt.show()
Output:
Changing the grid color and linestyle
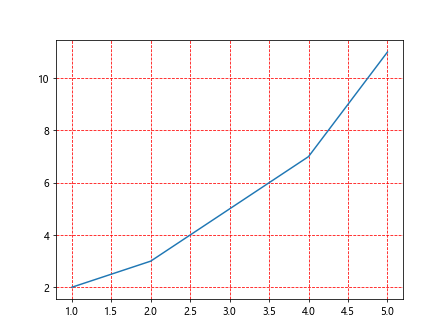
You can customize the color and linestyle of the grid lines by passing additional arguments to the grid method.
import matplotlib.pyplot as plt

x = [1, 2, 3, 4, 5]
y = [2, 3, 5, 7, 11]

plt.plot(x, y)
plt.grid(True, color='r', linestyle='--')
plt.show()
Output:
Adding grid only to specific axes
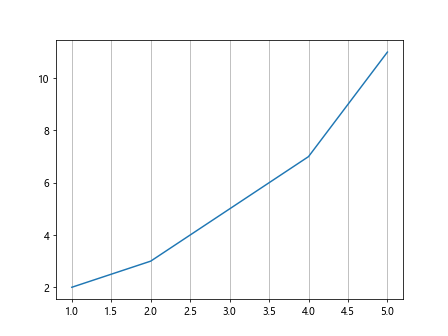
If you want to add grid lines to only the x-axis or y-axis, you can do so by specifying the axis parameter in the grid method.
import matplotlib.pyplot as plt

x = [1, 2, 3, 4, 5]
y = [2, 3, 5, 7, 11]

plt.plot(x, y)
plt.grid(True, axis='x')
plt.show()
Output:
Changing the transparency of the grid lines
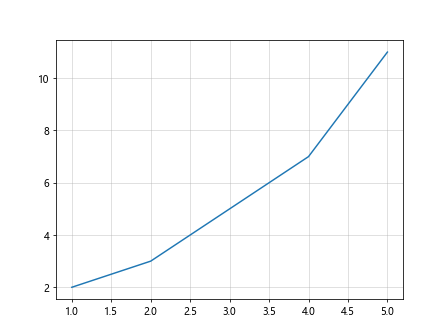
You can control the transparency of the grid lines by setting the alpha parameter in the grid method.
import matplotlib.pyplot as plt

x = [1, 2, 3, 4, 5]
y = [2, 3, 5, 7, 11]

plt.plot(x, y)
plt.grid(True, alpha=0.5)
plt.show()
Output:
Changing the grid line width
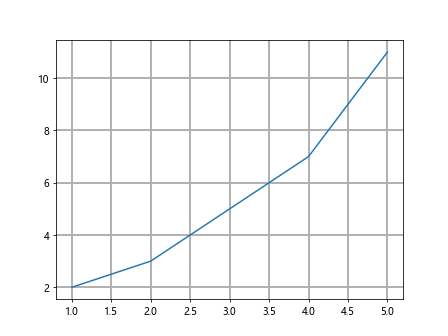
You can adjust the width of the grid lines by setting the linewidth parameter in the grid method.
import matplotlib.pyplot as plt

x = [1, 2, 3, 4, 5]
y = [2, 3, 5, 7, 11]

plt.plot(x, y)
plt.grid(True, linewidth=2)
plt.show()
Output:
Customizing the grid for subplots
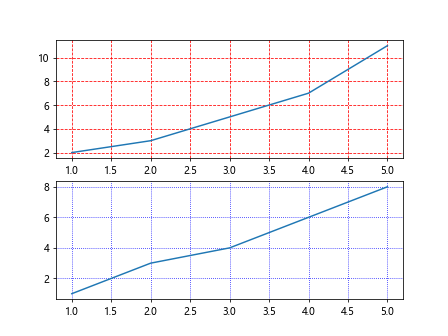
If you have subplots in your figure, you can customize the grid lines for each subplot individually using the grid method.
import matplotlib.pyplot as plt

x = [1, 2, 3, 4, 5]
y1 = [2, 3, 5, 7, 11]
y2 = [1, 3, 4, 6, 8]

fig, axs = plt.subplots(2)
axs[0].plot(x, y1)
axs[1].plot(x, y2)

axs[0].grid(True, color='r', linestyle='--')
axs[1].grid(True, color='b', linestyle=':')
plt.show()
Output:
Specifying grid properties using rcParams
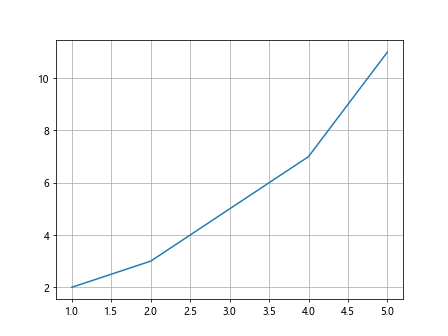
You can set the global grid properties for all plots in your script using the rcParams configuration.
import matplotlib.pyplot as plt
import matplotlib as mpl

x = [1, 2, 3, 4, 5]
y = [2, 3, 5, 7, 11]

plt.plot(x, y)

mpl.rcParams['grid.color'] = 'g'
mpl.rcParams['grid.linestyle'] = ':'
mpl.rcParams['grid.linewidth'] = 1
plt.grid(True)
plt.show()
Output:
Removing grid lines
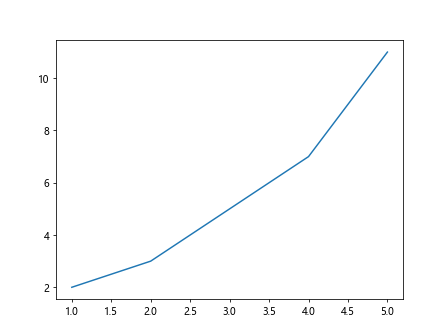
If you want to remove grid lines from a plot, you can do so by setting the grid method to False.
import matplotlib.pyplot as plt

x = [1, 2, 3, 4, 5]
y = [2, 3, 5, 7, 11]

plt.plot(x, y)
plt.grid(False)
plt.show()
Output:
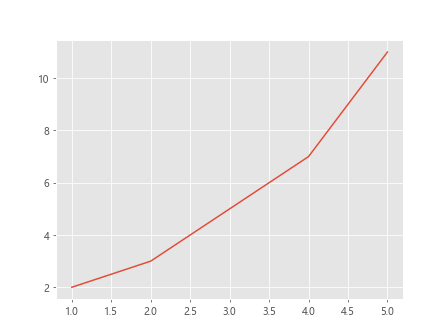
Customizing grid appearance using style sheets
You can use Matplotlib style sheets to easily customize the appearance of grid lines along with other plot elements.
import matplotlib.pyplot as plt

x = [1, 2, 3, 4, 5]
y = [2, 3, 5, 7, 11]

plt.style.use('ggplot')

plt.plot(x, y)
plt.grid(True)
plt.show()
Output:
Adding grid to a polar plot
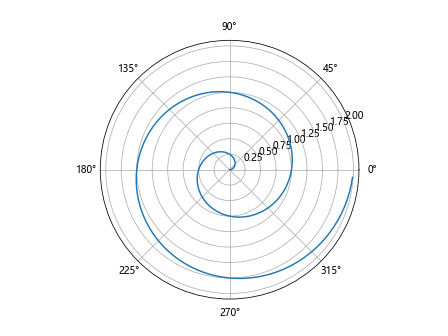
You can add grid lines to a polar plot by using the grid method along with setting the polar parameter to True.
import matplotlib.pyplot as plt
import numpy as np

r = np.arange(0, 2, 0.01)
theta = 2 * np.pi * r

plt.figure()
ax = plt.subplot(111, projection='polar')
ax.plot(theta, r)
ax.grid(True)
plt.show()
Output:
Adding grid lines to 3D plots
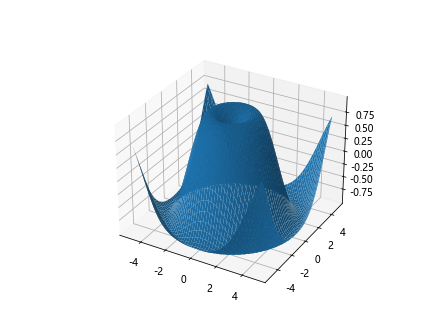
You can add grid lines to 3D plots in Matplotlib by setting the grid method to True for the respective axes.
import matplotlib.pyplot as plt
import numpy as np
from mpl_toolkits.mplot3d import Axes3D

x = np.linspace(-5, 5, 100)
y = np.linspace(-5, 5, 100)
X, Y = np.meshgrid(x, y)
Z = np.sin(np.sqrt(X**2 + Y**2))

fig = plt.figure()
ax = fig.add_subplot(111, projection='3d')
surf = ax.plot_surface(X, Y, Z)

ax.grid(True)
plt.show()
Output:
Conclusion
In this article, we have explored various methods to add grid lines in Matplotlib plots. You can customize the appearance of grid lines by changing their color, linestyle, width, transparency, and applying different properties to individual subplots. Using Matplotlib style sheets and setting global configuration with rcParams allows you to apply consistent grid styles to all plots in your script. Adding grid lines to polar plots and 3D plots is also straightforward with the grid method. By incorporating grid lines in your plots, you can enhance the visual clarity and interpretation of your data.