How to Change the Position of Legend in Matplotlib
Matplotlib is a popular Python library for creating static, animated, and interactive visualizations in Python. Legends in Matplotlib are used to identify the different elements of a plot. By default, the legend is placed in the upper-right corner of the plot. However, you can easily change the position of the legend to suit your needs.
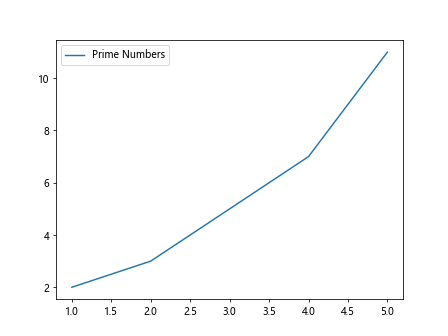
1. Changing the Legend Position to the Upper Left Corner
You can change the position of the legend by using the
loc parameter in the legend() function. Setting loc='upper left' will move the legend to the upper left corner of the plot.
import matplotlib.pyplot as plt

x = [1, 2, 3, 4, 5]
y = [2, 3, 5, 7, 11]

plt.plot(x, y, label='Prime Numbers')
plt.legend(loc='upper left')
plt.show()
Output:
2. Changing the Legend Position to the Lower Right Corner
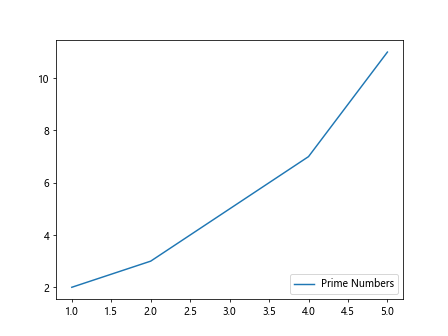
Similarly, you can move the legend to the lower right corner of the plot by setting
loc='lower right'.
import matplotlib.pyplot as plt

x = [1, 2, 3, 4, 5]
y = [2, 3, 5, 7, 11]

plt.plot(x, y, label='Prime Numbers')
plt.legend(loc='lower right')
plt.show()
Output:
3. Changing the Legend Position to the Lower Left Corner
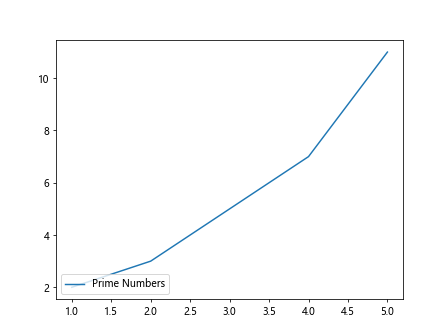
To place the legend in the lower left corner of the plot, you can set
loc='lower left'.
import matplotlib.pyplot as plt

x = [1, 2, 3, 4, 5]
y = [2, 3, 5, 7, 11]

plt.plot(x, y, label='Prime Numbers')
plt.legend(loc='lower left')
plt.show()
Output:
4. Moving the Legend Inside the Plot Area
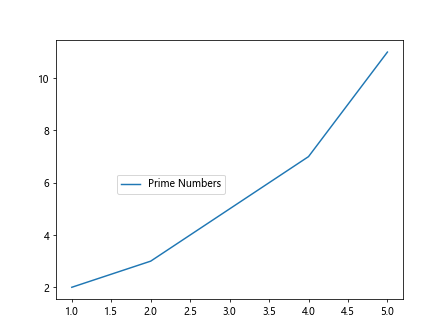
If you want to move the legend inside the plot area, you can use the
bbox_to_anchor parameter to specify the position of the legend relative to the plot. For example, setting bbox_to_anchor=(0.5, 0.5) will place the legend at the center of the plot.
import matplotlib.pyplot as plt

x = [1, 2, 3, 4, 5]
y = [2, 3, 5, 7, 11]

plt.plot(x, y, label='Prime Numbers')
plt.legend(loc='upper right', bbox_to_anchor=(0.5, 0.5))
plt.show()
Output:
5. Changing Legend Position with Custom Coordinates
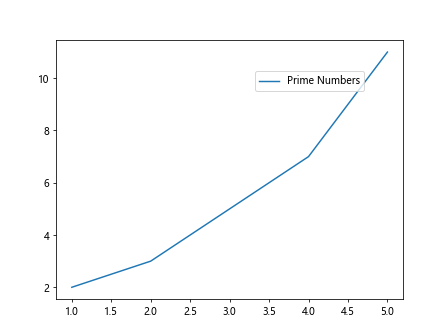
You can also specify the exact coordinates of the legend using the
bbox_to_anchor parameter. For example, setting bbox_to_anchor=(0.9, 0.9) will place the legend at the top-right corner of the plot, but slightly inside the plot area.
import matplotlib.pyplot as plt

x = [1, 2, 3, 4, 5]
y = [2, 3, 5, 7, 11]

plt.plot(x, y, label='Prime Numbers')
plt.legend(loc='upper right', bbox_to_anchor=(0.9, 0.9))
plt.show()
Output:
6. Placing the Legend Outside the Plot Area
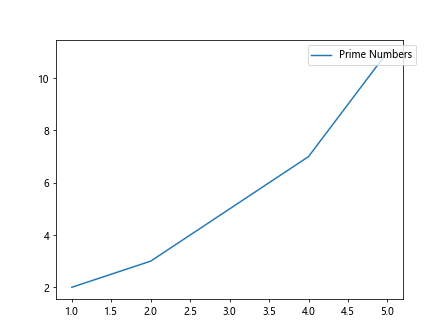
If you want to move the legend outside the plot area, you can adjust the
bbox_to_anchor position accordingly. Setting bbox_to_anchor=(1.05, 1) will move the legend to the right of the plot.
import matplotlib.pyplot as plt

x = [1, 2, 3, 4, 5]
y = [2, 3, 5, 7, 11]

plt.plot(x, y, label='Prime Numbers')
plt.legend(loc='upper right', bbox_to_anchor=(1.05, 1))
plt.show()
Output:
7. Customizing Legend Position with Offset
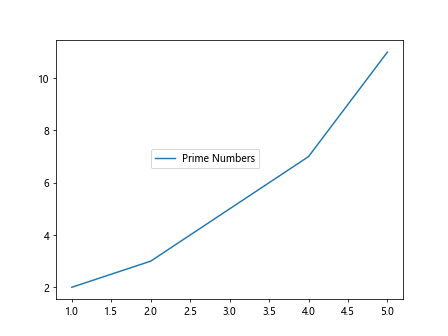
You can further customize the position of the legend by adding an offset to the coordinates specified in
bbox_to_anchor. Setting bbox_to_anchor=(0.5, 0.5, 0.5, 0.5) will move the legend slightly to the right and down inside the plot area.
import matplotlib.pyplot as plt

x = [1, 2, 3, 4, 5]
y = [2, 3, 5, 7, 11]

plt.plot(x, y, label='Prime Numbers')
plt.legend(loc='upper right', bbox_to_anchor=(0.5, 0.5, 0.1, 0.1))
plt.show()
Output:
8. Moving the Legend Relative to the Axes
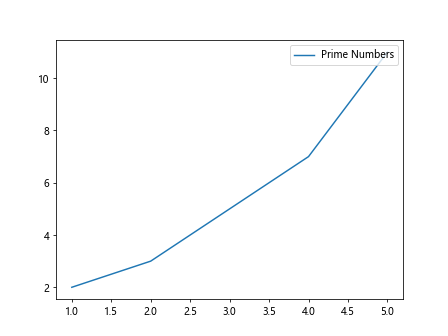
You can also specify the position of the legend relative to the axes rather than the plot area by setting
bbox_transform=plt.gca().transAxes. This will ensure that the legend moves with the axes if the plot is resized.
import matplotlib.pyplot as plt

x = [1, 2, 3, 4, 5]
y = [2, 3, 5, 7, 11]

plt.plot(x, y, label='Prime Numbers')
plt.legend(loc='upper right', bbox_to_anchor=(1, 1), bbox_transform=plt.gca().transAxes)
plt.show()
Output:
9. Changing Legend Alignment
In addition to changing the position of the legend, you can also adjust the alignment of the text within the legend. For example, setting
align='left' will align the text to the left.
import matplotlib.pyplot as plt

x = [1, 2, 3, 4, 5]
y = [2, 3, 5, 7, 11]

plt.plot(x, y, label='Prime Numbers')
plt.legend(loc='upper right', align='left')
plt.show()
10. Customizing Legend Font Properties
You can customize the font properties of the legend text using the
prop parameter. This allows you to change the font size, style, and weight of the text displayed in the legend.
import matplotlib.pyplot as plt
from matplotlib.font_manager import FontProperties

x = [1, 2, 3, 4, 5]
y = [2, 3, 5, 7, 11]

fontP = FontProperties()
fontP.set_size('small')
fontP.set_style('italic')

plt.plot(x, y, label='Prime Numbers')
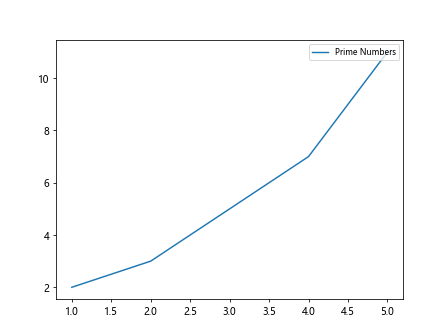
plt.legend(loc='upper right', prop=fontP)
plt.show()
Output:
Conclusion
In this article, we have explored various ways to change the position of the legend in Matplotlib. By using the
legend() function parameters such as loc, bbox_to_anchor, bbox_transform, align, and prop, you can easily customize the position, alignment, and font properties of the legend to enhance the clarity and visual appeal of your plots. Experiment with these techniques to create professional-looking visualizations in Matplotlib.