How to Create a Stacked Bar Plot in Matplotlib
Create a stacked bar plot in Matplotlib to effectively visualize and compare data across multiple categories and subcategories. Stacked bar plots are an excellent way to display the composition of different groups and their relative proportions. In this comprehensive guide, we’ll explore various techniques and customizations to create stunning stacked bar plots using Matplotlib.
Understanding Stacked Bar Plots
Before we dive into creating a stacked bar plot in Matplotlib, let’s first understand what they are and why they’re useful. A stacked bar plot is a type of bar chart where each bar is divided into segments representing different subcategories. The height of each segment corresponds to its value, and the total height of the bar represents the sum of all subcategories.
Stacked bar plots are particularly useful when you want to:
- Compare total values across categories
- Show the composition of each category
- Visualize changes in composition over time or across different groups
Now, let’s create a stacked bar plot in Matplotlib using a simple example:
import matplotlib.pyplot as plt
import numpy as np

categories = ['Category A', 'Category B', 'Category C']
values1 = [10, 15, 12]
values2 = [5, 8, 7]
values3 = [3, 4, 5]

fig, ax = plt.subplots(figsize=(10, 6))

ax.bar(categories, values1, label='Group 1')
ax.bar(categories, values2, bottom=values1, label='Group 2')
ax.bar(categories, values3, bottom=np.array(values1) + np.array(values2), label='Group 3')

ax.set_ylabel('Values')
ax.set_title('How to Create a Stacked Bar Plot in Matplotlib')
ax.legend()

plt.text(0.5, -0.1, 'how2matplotlib.com', ha='center', va='center', transform=ax.transAxes)
plt.show()
Output:
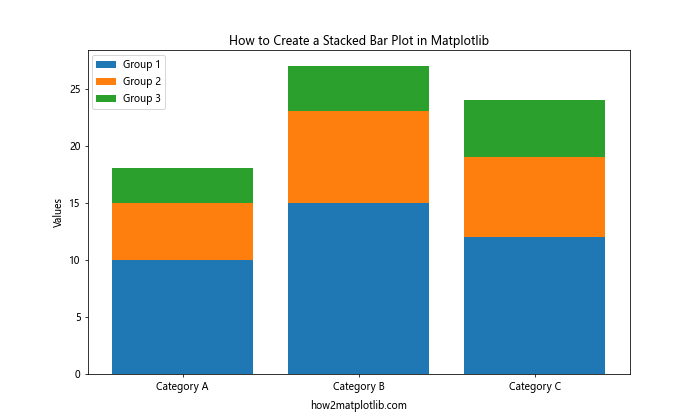
In this example, we create a stacked bar plot in Matplotlib with three categories and three groups. The ax.bar() function is used multiple times to stack the bars on top of each other. The bottom parameter is used to specify the starting point for each subsequent group.
Customizing Colors and Styles
When you create a stacked bar plot in Matplotlib, you can customize the colors and styles to make your visualization more appealing and informative. Let’s explore some customization options:
import matplotlib.pyplot as plt
import numpy as np

categories = ['A', 'B', 'C', 'D']
values1 = [10, 15, 12, 8]
values2 = [5, 8, 7, 6]
values3 = [3, 4, 5, 2]

fig, ax = plt.subplots(figsize=(10, 6))

ax.bar(categories, values1, label='Group 1', color='#FF9999', edgecolor='black', linewidth=1.5)
ax.bar(categories, values2, bottom=values1, label='Group 2', color='#66B2FF', edgecolor='black', linewidth=1.5)
ax.bar(categories, values3, bottom=np.array(values1) + np.array(values2), label='Group 3', color='#99FF99', edgecolor='black', linewidth=1.5)

ax.set_ylabel('Values')
ax.set_title('Customized Stacked Bar Plot in Matplotlib')
ax.legend()

plt.text(0.5, -0.1, 'how2matplotlib.com', ha='center', va='center', transform=ax.transAxes)
plt.show()
Output:
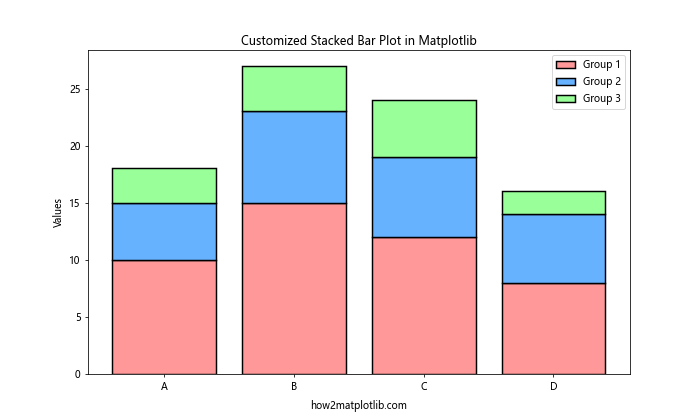
In this example, we create a stacked bar plot in Matplotlib with custom colors and added edge lines. The color parameter is used to set the fill color of each bar segment, while edgecolor and linewidth are used to add and customize the border of each segment.
Adding Data Labels
To make your stacked bar plot more informative, you can add data labels to each segment. Here’s how to create a stacked bar plot in Matplotlib with data labels:
import matplotlib.pyplot as plt
import numpy as np

categories = ['Category 1', 'Category 2', 'Category 3']
values1 = [10, 15, 12]
values2 = [5, 8, 7]
values3 = [3, 4, 5]

fig, ax = plt.subplots(figsize=(10, 6))

ax.bar(categories, values1, label='Group 1')
ax.bar(categories, values2, bottom=values1, label='Group 2')
ax.bar(categories, values3, bottom=np.array(values1) + np.array(values2), label='Group 3')

ax.set_ylabel('Values')
ax.set_title('Stacked Bar Plot with Data Labels in Matplotlib')
ax.legend()

for i, category in enumerate(categories):
    total = values1[i] + values2[i] + values3[i]
    ax.text(i, total + 0.5, str(total), ha='center', va='bottom')

    ax.text(i, values1[i]/2, str(values1[i]), ha='center', va='center')
    ax.text(i, values1[i] + values2[i]/2, str(values2[i]), ha='center', va='center')
    ax.text(i, values1[i] + values2[i] + values3[i]/2, str(values3[i]), ha='center', va='center')

plt.text(0.5, -0.1, 'how2matplotlib.com', ha='center', va='center', transform=ax.transAxes)
plt.show()
Output:
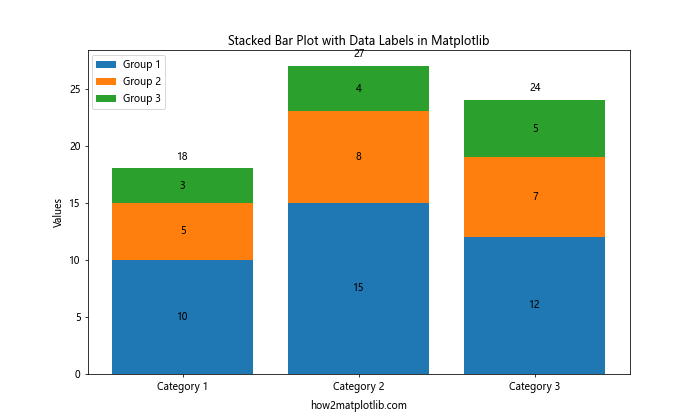
In this example, we create a stacked bar plot in Matplotlib and add data labels to each segment and the total value for each category. The ax.text() function is used to add text annotations at specific positions on the plot.
Creating Horizontal Stacked Bar Plots
While vertical stacked bar plots are common, you can also create horizontal stacked bar plots in Matplotlib. This can be particularly useful when you have long category names or want to emphasize the comparison between categories. Here’s how to create a horizontal stacked bar plot in Matplotlib:
import matplotlib.pyplot as plt
import numpy as np

categories = ['Long Category Name 1', 'Long Category Name 2', 'Long Category Name 3', 'Long Category Name 4']
values1 = [10, 15, 12, 8]
values2 = [5, 8, 7, 6]
values3 = [3, 4, 5, 2]

fig, ax = plt.subplots(figsize=(10, 6))

ax.barh(categories, values1, label='Group 1')
ax.barh(categories, values2, left=values1, label='Group 2')
ax.barh(categories, values3, left=np.array(values1) + np.array(values2), label='Group 3')

ax.set_xlabel('Values')
ax.set_title('Horizontal Stacked Bar Plot in Matplotlib')
ax.legend(loc='lower right')

plt.text(0.5, -0.1, 'how2matplotlib.com', ha='center', va='center', transform=ax.transAxes)
plt.tight_layout()
plt.show()
Output:
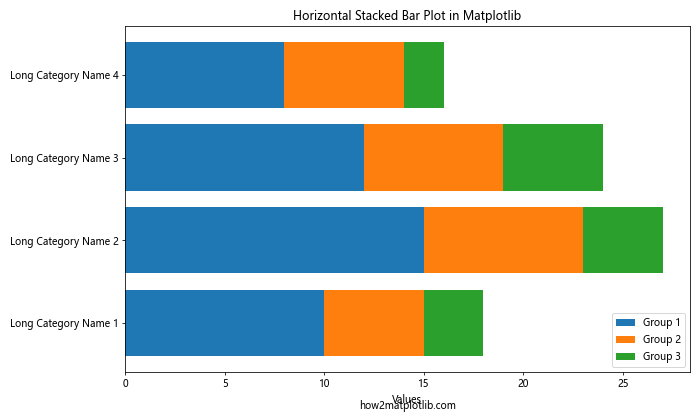
In this example, we create a horizontal stacked bar plot in Matplotlib using the ax.barh() function instead of ax.bar(). The left parameter is used to specify the starting point for each subsequent group, similar to the bottom parameter in vertical stacked bar plots.
Percentage Stacked Bar Plots
Sometimes, you may want to show the relative proportions of each group within categories rather than absolute values. In this case, you can create a percentage stacked bar plot in Matplotlib. Here’s how:
import matplotlib.pyplot as plt
import numpy as np

categories = ['A', 'B', 'C', 'D']
values1 = [10, 15, 12, 8]
values2 = [5, 8, 7, 6]
values3 = [3, 4, 5, 2]

totals = np.array(values1) + np.array(values2) + np.array(values3)
percentages1 = np.array(values1) / totals * 100
percentages2 = np.array(values2) / totals * 100
percentages3 = np.array(values3) / totals * 100

fig, ax = plt.subplots(figsize=(10, 6))

ax.bar(categories, percentages1, label='Group 1')
ax.bar(categories, percentages2, bottom=percentages1, label='Group 2')
ax.bar(categories, percentages3, bottom=percentages1 + percentages2, label='Group 3')

ax.set_ylabel('Percentage')
ax.set_title('Percentage Stacked Bar Plot in Matplotlib')
ax.legend()

for i, category in enumerate(categories):
    ax.text(i, 50, f'{totals[i]}', ha='center', va='center', fontweight='bold')

plt.text(0.5, -0.1, 'how2matplotlib.com', ha='center', va='center', transform=ax.transAxes)
plt.show()
Output:
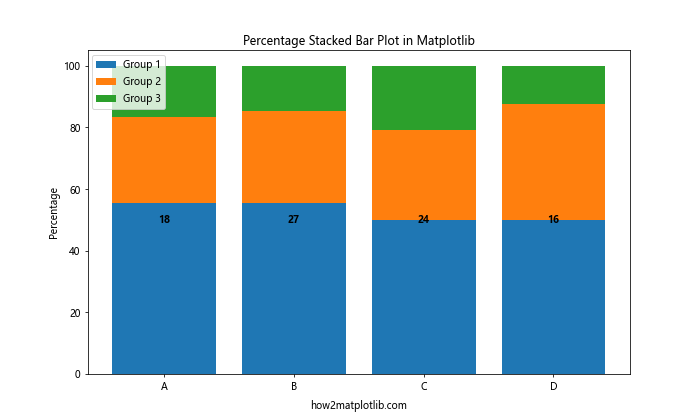
In this example, we create a percentage stacked bar plot in Matplotlib by calculating the percentage of each group within each category. The total value for each category is displayed in the middle of each bar for reference.
Multi-Series Stacked Bar Plots
You can create more complex visualizations by combining multiple series of stacked bars. This is useful when you want to compare stacked data across different dimensions. Here’s how to create a multi-series stacked bar plot in Matplotlib:
import matplotlib.pyplot as plt
import numpy as np

categories = ['A', 'B', 'C']
series1 = {'Group 1': [10, 15, 12], 'Group 2': [5, 8, 7], 'Group 3': [3, 4, 5]}
series2 = {'Group 1': [8, 12, 10], 'Group 2': [6, 9, 8], 'Group 3': [4, 5, 6]}

x = np.arange(len(categories))
width = 0.35

fig, ax = plt.subplots(figsize=(12, 6))

bottom1 = np.zeros(len(categories))
bottom2 = np.zeros(len(categories))

for group, values in series1.items():
    ax.bar(x - width/2, values, width, label=f'{group} (Series 1)', bottom=bottom1)
    bottom1 += values

for group, values in series2.items():
    ax.bar(x + width/2, values, width, label=f'{group} (Series 2)', bottom=bottom2)
    bottom2 += values

ax.set_ylabel('Values')
ax.set_title('Multi-Series Stacked Bar Plot in Matplotlib')
ax.set_xticks(x)
ax.set_xticklabels(categories)
ax.legend(loc='upper left', bbox_to_anchor=(1, 1))

plt.text(0.5, -0.1, 'how2matplotlib.com', ha='center', va='center', transform=ax.transAxes)
plt.tight_layout()
plt.show()
Output:
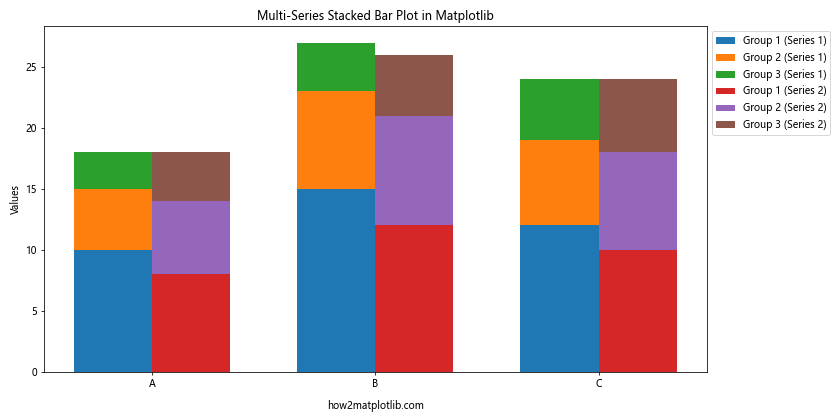
In this example, we create a multi-series stacked bar plot in Matplotlib by using two separate series of data. The bars for each series are placed side by side using the width parameter and adjusting the x-coordinates.
Diverging Stacked Bar Plots
Diverging stacked bar plots are useful for visualizing data with positive and negative values or for comparing two different aspects of the same categories. Here’s how to create a diverging stacked bar plot in Matplotlib:
import matplotlib.pyplot as plt
import numpy as np

categories = ['A', 'B', 'C', 'D', 'E']
positive_values = [10, 15, 12, 8, 14]
negative_values = [-5, -8, -7, -6, -9]

fig, ax = plt.subplots(figsize=(10, 6))

ax.bar(categories, positive_values, label='Positive', color='#66B2FF')
ax.bar(categories, negative_values, label='Negative', color='#FF9999')

ax.set_ylabel('Values')
ax.set_title('Diverging Stacked Bar Plot in Matplotlib')
ax.legend()

ax.axhline(y=0, color='black', linestyle='-', linewidth=0.5)

for i, (pos, neg) in enumerate(zip(positive_values, negative_values)):
    ax.text(i, pos, f'+{pos}', ha='center', va='bottom')
    ax.text(i, neg, f'{neg}', ha='center', va='top')

plt.text(0.5, -0.1, 'how2matplotlib.com', ha='center', va='center', transform=ax.transAxes)
plt.show()
Output:
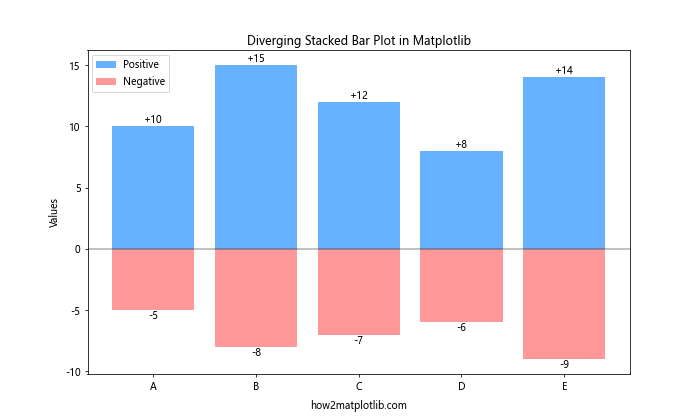
In this example, we create a diverging stacked bar plot in Matplotlib by using positive and negative values. The bars are centered around the y-axis, with positive values extending upwards and negative values extending downwards.
Stacked Bar Plots with Error Bars
Adding error bars to your stacked bar plot can provide additional information about the uncertainty or variability of your data. Here’s how to create a stacked bar plot with error bars in Matplotlib:
import matplotlib.pyplot as plt
import numpy as np

categories = ['A', 'B', 'C', 'D']
values1 = [10, 15, 12, 8]
values2 = [5, 8, 7, 6]
values3 = [3, 4, 5, 2]
errors1 = [1, 1.5, 1.2, 0.8]
errors2 = [0.5, 0.8, 0.7, 0.6]
errors3 = [0.3, 0.4, 0.5, 0.2]

fig, ax = plt.subplots(figsize=(10, 6))

ax.bar(categories, values1, yerr=errors1, label='Group 1', capsize=5)
ax.bar(categories, values2, yerr=errors2, bottom=values1, label='Group 2', capsize=5)
ax.bar(categories, values3, yerr=errors3, bottom=np.array(values1) + np.array(values2), label='Group 3', capsize=5)

ax.set_ylabel('Values')
ax.set_title('Stacked Bar Plot with Error Bars in Matplotlib')
ax.legend()

plt.text(0.5, -0.1, 'how2matplotlib.com', ha='center', va='center', transform=ax.transAxes)
plt.show()
Output:
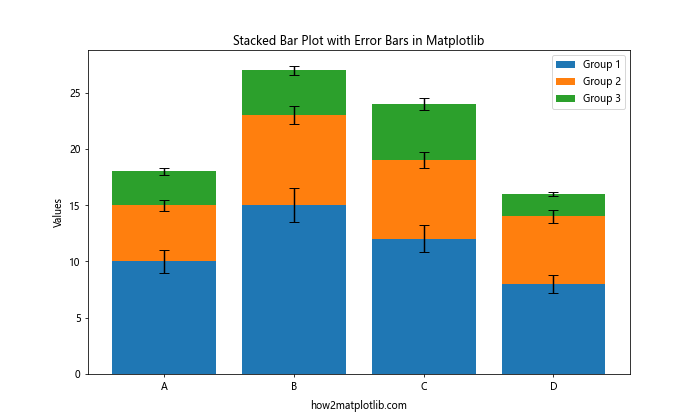
In this example, we create a stacked bar plot with error bars in Matplotlib by adding the yerr parameter to each ax.bar() call. The capsize parameter is used to add caps to the error bars for better visibility.
Grouped Stacked Bar Plots
Grouped stacked bar plots combine the features of grouped bar charts and stacked bar charts, allowing you to compare multiple categories and subcategories simultaneously. Here’s how to create a grouped stacked bar plot in Matplotlib:
import matplotlib.pyplot as plt
import numpy as np

categories = ['A', 'B', 'C']
groups = ['Group 1', 'Group 2']
subgroups = ['Subgroup 1', 'Subgroup 2', 'Subgroup 3']

data = np.array([
    [[10, 5, 3], [8, 6, 4]],
    [[15, 8, 4], [12, 9, 5]],
    [[12, 7, 5], [10, 8, 6]]
])

fig, ax = plt.subplots(figsize=(12, 6))

x = np.arange(len(categories))
width = 0.35
multiplier = 0

for group_index, group in enumerate(groups):
    bottom = np.zeros(len(categories))
    for subgroup_index, subgroup in enumerate(subgroups):
        values = data[:, group_index, subgroup_index]
        offset = width * multiplier
        rects = ax.bar(x + offset, values, width, bottom=bottom, label=f'{group} - {subgroup}')
        bottom += values
    multiplier += 1

ax.set_ylabel('Values')
ax.set_title('Grouped Stacked Bar Plot in Matplotlib')
ax.set_xticks(x + width / 2)
ax.set_xticklabels(categories)
ax.legend(loc='upper left', bbox_to_anchor=(1, 1))

plt.text(0.5, -0.1, 'how2matplotlib.com', ha='center', va='center', transform=ax.transAxes)
plt.tight_layout()
plt.show()
Output:
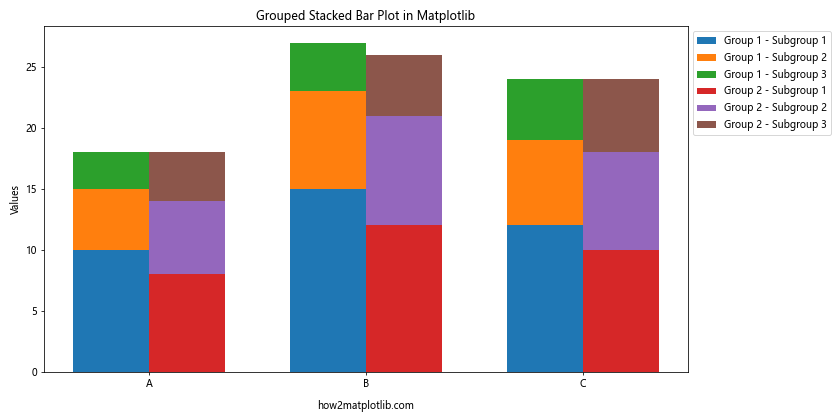
In this example, we create a grouped stacked bar plot in Matplotlib by using a 3D numpy array to store the data for multiple groups, categories, and subgroups. The bars are positioned using the width parameter and adjusting the x-coordinates.
Stacked Bar Plots with Patterns
Adding patterns to your stacked bar plot can help differentiate between groups, especially when printing in black and white or for colorblind-friendly visualizations. Here’s how to create a stacked bar plot with patterns in Matplotlib:
import matplotlib.pyplot as plt
import numpy as np

categories = ['A', 'B', 'C', 'D']
values1 = [10, 15, 12, 8]
values2 = [5, 8, 7, 6]
values3 = [3, 4, 5, 2]

patterns = ['/', '\\', 'o', '*']

fig, ax = plt.subplots(figsize=(10, 6))

ax.bar(categories, values1, label='Group 1', hatch=patterns[0])
ax.bar(categories, values2, bottom=values1, label='Group 2', hatch=patterns[1])
ax.bar(categories, values3, bottom=np.array(values1) + np.array(values2), label='Group 3', hatch=patterns[2])

ax.set_ylabel('Values')
ax.set_title('Stacked Bar Plot with Patterns in Matplotlib')
ax.legend()

plt.text(0.5, -0.1, 'how2matplotlib.com', ha='center', va='center', transform=ax.transAxes)
plt.show()
Output:
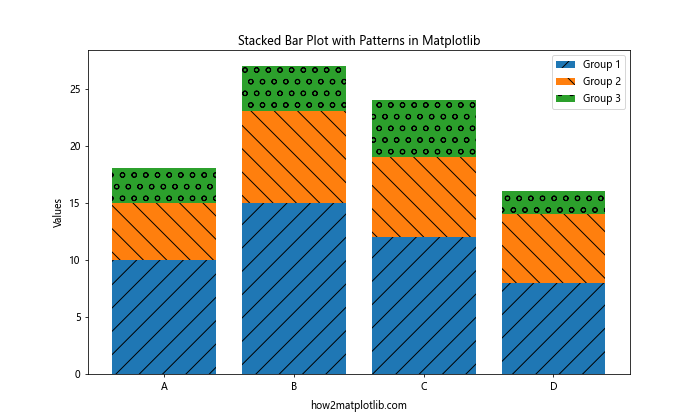
In this example, we create a stacked bar plot with patterns in Matplotlib by using the hatch parameter in the ax.bar() function. Different patterns are assigned to each group to make them visually distinct.
Stacked Bar Plots with Gradient Colors
To make your stacked bar plot more visually appealing, you can use gradient colors for each group. Here’s how to create a stacked bar plot with gradient colors in Matplotlib:
import matplotlib.pyplot as plt
import numpy as np
from matplotlib.colors import LinearSegmentedColormap

categories = ['A', 'B', 'C', 'D']
values1 = [10, 15, 12, 8]
values2 = [5, 8, 7, 6]
values3 = [3, 4, 5, 2]

fig, ax = plt.subplots(figsize=(10, 6))

cmap1 = LinearSegmentedColormap.from_list("", ["#FF9999", "#FF0000"])
cmap2 = LinearSegmentedColormap.from_list("", ["#99FF99", "#00FF00"])
cmap3 = LinearSegmentedColormap.from_list("", ["#9999FF", "#0000FF"])

ax.bar(categories, values1, label='Group 1', color=cmap1(np.linspace(0.2, 0.8, len(categories))))
ax.bar(categories, values2, bottom=values1, label='Group 2', color=cmap2(np.linspace(0.2, 0.8, len(categories))))
ax.bar(categories, values3, bottom=np.array(values1) + np.array(values2), label='Group 3', color=cmap3(np.linspace(0.2, 0.8, len(categories))))

ax.set_ylabel('Values')
ax.set_title('Stacked Bar Plot with Gradient Colors in Matplotlib')
ax.legend()

plt.text(0.5, -0.1, 'how2matplotlib.com', ha='center', va='center', transform=ax.transAxes)
plt.show()
Output:
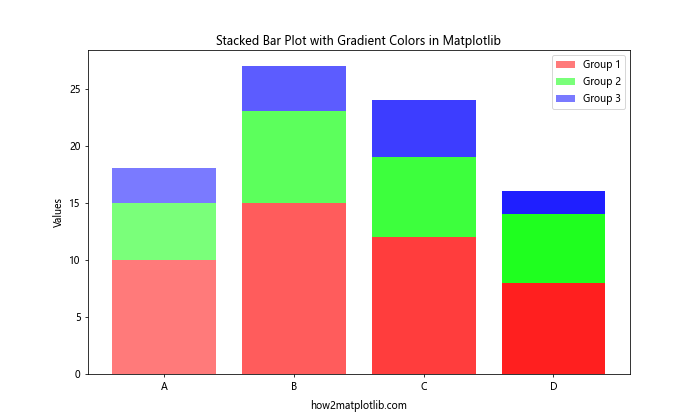
In this example, we create a stacked bar plot with gradient colors in Matplotlib by using LinearSegmentedColormap to create custom color gradients for each group. The np.linspace() function is used to generate evenly spaced color values along the gradient.
Stacked Bar Plots with Annotations
Adding annotations to your stacked bar plot can provide additional context or highlight specific data points. Here’s how to create a stacked bar plot with annotations in Matplotlib:
import matplotlib.pyplot as plt
import numpy as np

categories = ['A', 'B', 'C', 'D']
values1 = [10, 15, 12, 8]
values2 = [5, 8, 7, 6]
values3 = [3, 4, 5, 2]

fig, ax = plt.subplots(figsize=(10, 6))

ax.bar(categories, values1, label='Group 1')
ax.bar(categories, values2, bottom=values1, label='Group 2')
ax.bar(categories, values3, bottom=np.array(values1) + np.array(values2), label='Group 3')

ax.set_ylabel('Values')
ax.set_title('Stacked Bar Plot with Annotations in Matplotlib')
ax.legend()

for i, category in enumerate(categories):
    total = values1[i] + values2[i] + values3[i]
    ax.annotate(f'Total: {total}', xy=(i, total), xytext=(0, 5),
                textcoords='offset points', ha='center', va='bottom',
                bbox=dict(boxstyle='round,pad=0.5', fc='yellow', alpha=0.5),
                arrowprops=dict(arrowstyle='->', connectionstyle='arc3,rad=0'))

plt.text(0.5, -0.1, 'how2matplotlib.com', ha='center', va='center', transform=ax.transAxes)
plt.show()
Output:
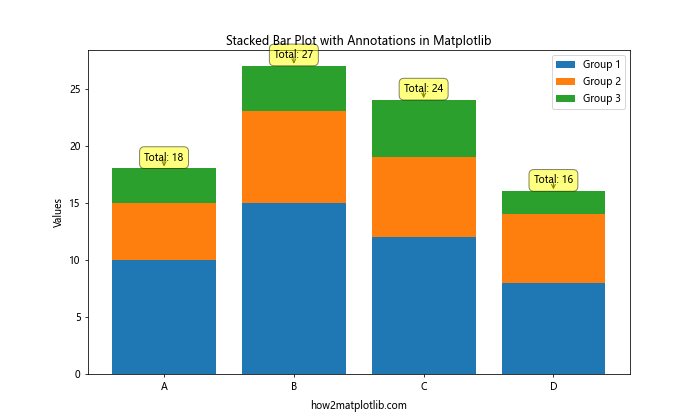
In this example, we create a stacked bar plot with annotations in Matplotlib by using the ax.annotate() function. Annotations are added to show the total value for each category, with custom text boxes and arrow styles.
Stacked Bar Plots with Subplots
You can create multiple stacked bar plots side by side using subplots to compare different datasets or time periods. Here’s how to create stacked bar plots with subplots in Matplotlib:
import matplotlib.pyplot as plt
import numpy as np

categories = ['A', 'B', 'C', 'D']
values1 = [10, 15, 12, 8]
values2 = [5, 8, 7, 6]
values3 = [3, 4, 5, 2]

values1_2 = [12, 14, 10, 9]
values2_2 = [6, 7, 8, 5]
values3_2 = [4, 3, 6, 3]

fig, (ax1, ax2) = plt.subplots(1, 2, figsize=(15, 6))

ax1.bar(categories, values1, label='Group 1')
ax1.bar(categories, values2, bottom=values1, label='Group 2')
ax1.bar(categories, values3, bottom=np.array(values1) + np.array(values2), label='Group 3')

ax1.set_ylabel('Values')
ax1.set_title('Stacked Bar Plot 1')
ax1.legend()

ax2.bar(categories, values1_2, label='Group 1')
ax2.bar(categories, values2_2, bottom=values1_2, label='Group 2')
ax2.bar(categories, values3_2, bottom=np.array(values1_2) + np.array(values2_2), label='Group 3')

ax2.set_ylabel('Values')
ax2.set_title('Stacked Bar Plot 2')
ax2.legend()

plt.suptitle('Comparison of Stacked Bar Plots in Matplotlib', fontsize=16)
plt.text(0.5, -0.05, 'how2matplotlib.com', ha='center', va='center', transform=fig.transFigure)
plt.tight_layout()
plt.show()
Output:
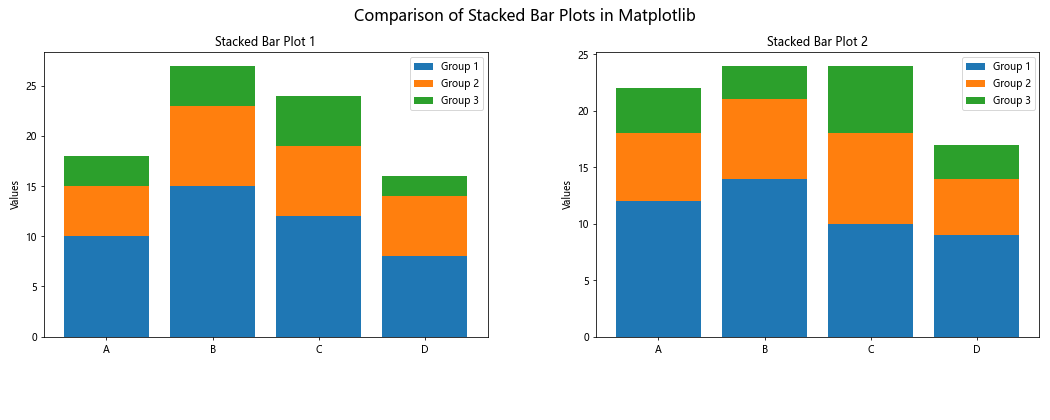
In this example, we create two stacked bar plots side by side using subplots in Matplotlib. This allows for easy comparison between two different datasets or time periods.
Conclusion
Creating a stacked bar plot in Matplotlib is a powerful way to visualize complex data with multiple categories and subcategories. By following the examples and techniques presented in this guide, you can create informative and visually appealing stacked bar plots for your data analysis and presentation needs.
Remember to experiment with different customization options, such as colors, patterns, and annotations, to make your stacked bar plots more effective and tailored to your specific data and audience. With Matplotlib’s flexibility, you can create a wide range of stacked bar plot variations to suit your visualization requirements.