How to Change the Vertical Spacing Between Legend Entries in Matplotlib
How to change the vertical spacing between legend entries in Matplotlib is an essential skill for data visualization enthusiasts. Matplotlib, a powerful plotting library in Python, offers various ways to customize legends, including adjusting the vertical spacing between legend entries. In this comprehensive guide, we’ll explore different methods and techniques to change the vertical spacing between legend entries in Matplotlib, providing you with the knowledge and tools to create visually appealing and informative plots.
Understanding Legend Entries and Vertical Spacing in Matplotlib
Before diving into the specifics of how to change the vertical spacing between legend entries in Matplotlib, it’s crucial to understand what legend entries are and why vertical spacing matters. In Matplotlib, a legend is a key component of a plot that helps viewers interpret the data by associating plot elements with their corresponding labels. Legend entries are the individual items within a legend, typically consisting of a marker or line style and a descriptive label.
The vertical spacing between legend entries refers to the amount of space between each entry in the legend. Proper spacing is essential for readability and aesthetics, especially when dealing with plots that have multiple legend entries. By learning how to change the vertical spacing between legend entries in Matplotlib, you can create more visually appealing and easier-to-read plots.
Let’s start with a basic example to illustrate a plot with a legend:
import matplotlib.pyplot as plt

# Create a simple plot
plt.figure(figsize=(8, 6))
plt.plot([1, 2, 3, 4], [1, 4, 2, 3], label='Line 1')
plt.plot([1, 2, 3, 4], [2, 3, 4, 1], label='Line 2')
plt.title('How to Change Vertical Spacing in Legend - how2matplotlib.com')
plt.xlabel('X-axis')
plt.ylabel('Y-axis')
plt.legend()
plt.show()
Output:
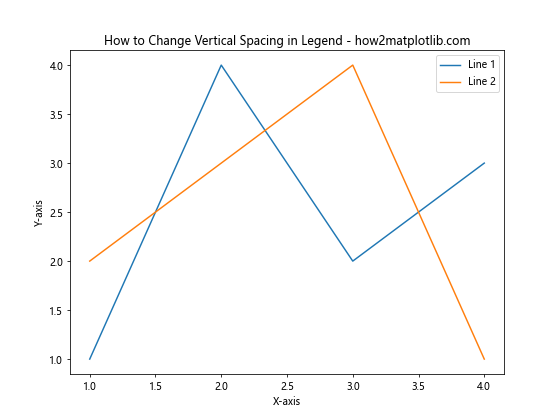
In this example, we create a simple plot with two lines and a default legend. The vertical spacing between legend entries is set to the default value. Now, let’s explore how to change the vertical spacing between legend entries in Matplotlib.
Method 1: Using labelspacing Parameter
One of the simplest ways to change the vertical spacing between legend entries in Matplotlib is by using the labelspacing parameter when creating the legend. This parameter controls the vertical space between legend entries, measured in font-size units.
Here’s an example of how to change the vertical spacing between legend entries in Matplotlib using the labelspacing parameter:
import matplotlib.pyplot as plt

plt.figure(figsize=(8, 6))
plt.plot([1, 2, 3, 4], [1, 4, 2, 3], label='Line 1')
plt.plot([1, 2, 3, 4], [2, 3, 4, 1], label='Line 2')
plt.title('How to Change Vertical Spacing in Legend - how2matplotlib.com')
plt.xlabel('X-axis')
plt.ylabel('Y-axis')
plt.legend(labelspacing=2)  # Increase vertical spacing
plt.show()
Output:
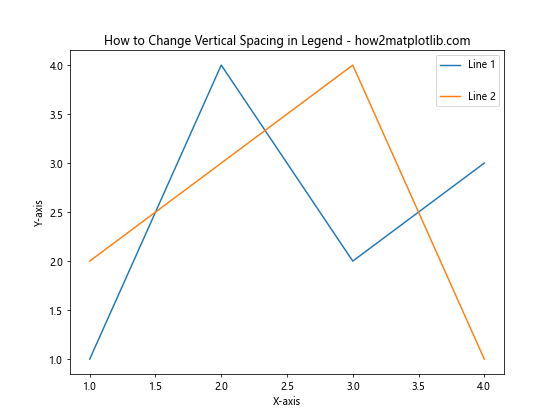
In this example, we set labelspacing=2 when creating the legend. This increases the vertical spacing between legend entries to twice the default value. You can adjust this value to achieve the desired spacing for your plot.
Method 2: Using rcParams to Set Default Spacing
If you want to change the vertical spacing between legend entries in Matplotlib for all plots in your script or notebook, you can use the rcParams dictionary to set a default value. This approach is useful when you want to maintain consistent legend spacing across multiple plots.
Here’s how to change the vertical spacing between legend entries in Matplotlib using rcParams:
import matplotlib.pyplot as plt

# Set default labelspacing for all legends
plt.rcParams['legend.labelspacing'] = 1.5

# Create multiple plots with consistent legend spacing
fig, (ax1, ax2) = plt.subplots(1, 2, figsize=(12, 5))

ax1.plot([1, 2, 3, 4], [1, 4, 2, 3], label='Line 1')
ax1.plot([1, 2, 3, 4], [2, 3, 4, 1], label='Line 2')
ax1.set_title('Plot 1 - how2matplotlib.com')
ax1.legend()

ax2.plot([1, 2, 3, 4], [3, 1, 4, 2], label='Line A')
ax2.plot([1, 2, 3, 4], [4, 2, 1, 3], label='Line B')
ax2.set_title('Plot 2 - how2matplotlib.com')
ax2.legend()

plt.tight_layout()
plt.show()
Output:
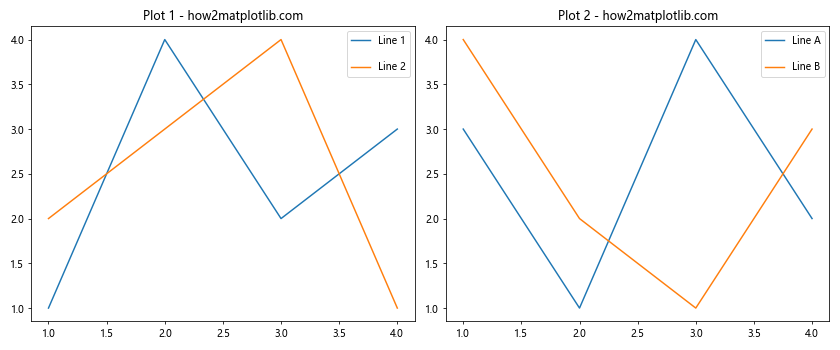
In this example, we set the default labelspacing to 1.5 using plt.rcParams['legend.labelspacing'] = 1.5. This ensures that all legends in the script will have the same vertical spacing between entries unless explicitly overridden.
Method 3: Adjusting Legend Box Properties
Another way to change the vertical spacing between legend entries in Matplotlib is by adjusting the legend box properties. This method gives you more control over the legend’s appearance and allows you to fine-tune the spacing.
Here’s an example of how to change the vertical spacing between legend entries in Matplotlib by adjusting the legend box properties:
import matplotlib.pyplot as plt

plt.figure(figsize=(8, 6))
plt.plot([1, 2, 3, 4], [1, 4, 2, 3], label='Line 1')
plt.plot([1, 2, 3, 4], [2, 3, 4, 1], label='Line 2')
plt.title('How to Change Vertical Spacing in Legend - how2matplotlib.com')
plt.xlabel('X-axis')
plt.ylabel('Y-axis')

# Create legend and adjust box properties
legend = plt.legend()
legend._loc = 2  # Place legend in upper left
legend.set_bbox_to_anchor((0.05, 0.95))  # Adjust legend position
plt.setp(legend.get_texts(), lineheight=2)  # Increase line height

plt.show()
In this example, we create the legend and then adjust its properties. We set the legend location, adjust its position using set_bbox_to_anchor(), and increase the line height of the legend text using plt.setp(). This method allows for more precise control over the legend’s appearance and spacing.
Method 4: Using columnspacing for Multi-column Legends
When dealing with plots that have many legend entries, you might want to create a multi-column legend to save space. In such cases, you can use the columnspacing parameter to adjust the horizontal spacing between columns, which indirectly affects the vertical spacing of entries.
Here’s how to change the vertical spacing between legend entries in Matplotlib using a multi-column legend:
import matplotlib.pyplot as plt

plt.figure(figsize=(10, 6))
for i in range(6):
    plt.plot([1, 2, 3, 4], [i+1, i+2, i+3, i+4], label=f'Line {i+1}')

plt.title('Multi-column Legend - how2matplotlib.com')
plt.xlabel('X-axis')
plt.ylabel('Y-axis')
plt.legend(ncol=3, columnspacing=1.5, labelspacing=1.2)
plt.show()
Output:
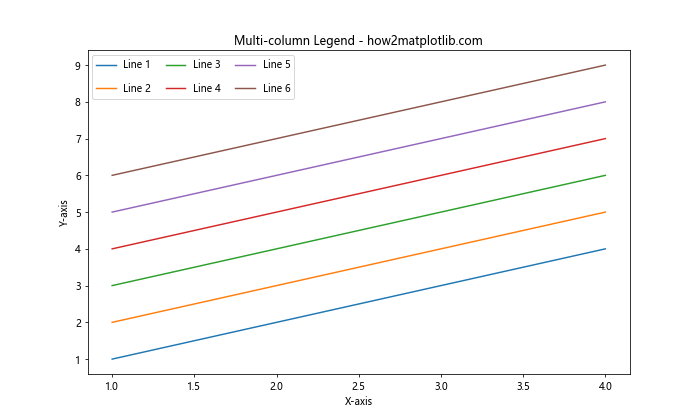
In this example, we create a plot with six lines and use a multi-column legend. We set ncol=3 to create three columns, columnspacing=1.5 to adjust the horizontal spacing between columns, and labelspacing=1.2 to fine-tune the vertical spacing between entries within each column.
Method 5: Custom Legend Placement with bbox_to_anchor
For more advanced control over legend placement and spacing, you can use the bbox_to_anchor parameter in combination with other legend properties. This method allows you to precisely position the legend and adjust its size, which can indirectly affect the vertical spacing between entries.
Here’s an example of how to change the vertical spacing between legend entries in Matplotlib using custom legend placement:
import matplotlib.pyplot as plt

plt.figure(figsize=(8, 6))
plt.plot([1, 2, 3, 4], [1, 4, 2, 3], label='Line 1')
plt.plot([1, 2, 3, 4], [2, 3, 4, 1], label='Line 2')
plt.title('Custom Legend Placement - how2matplotlib.com')
plt.xlabel('X-axis')
plt.ylabel('Y-axis')

plt.legend(bbox_to_anchor=(1.05, 1), loc='upper left', borderaxespad=0.,
           labelspacing=1.5, handlelength=3)
plt.tight_layout()
plt.show()
Output:
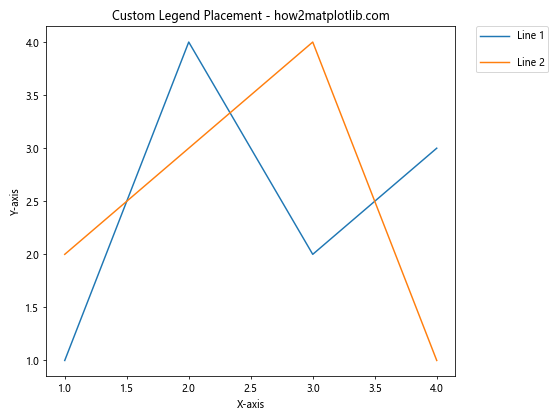
In this example, we use bbox_to_anchor=(1.05, 1) to position the legend outside the plot area, loc='upper left' to align it with the upper-left corner of the bounding box, and borderaxespad=0. to remove padding between the legend and the axes. We also set labelspacing=1.5 to increase the vertical spacing between entries and handlelength=3 to make the legend markers longer.
Method 6: Using figlegend for Figure-level Legends
When working with subplots, you might want to create a single legend for the entire figure rather than individual legends for each subplot. In such cases, you can use figlegend() and adjust its properties to change the vertical spacing between legend entries in Matplotlib.
Here’s an example of how to change the vertical spacing between legend entries in Matplotlib using a figure-level legend:
import matplotlib.pyplot as plt

fig, (ax1, ax2) = plt.subplots(1, 2, figsize=(12, 5))

line1, = ax1.plot([1, 2, 3, 4], [1, 4, 2, 3], label='Line 1')
line2, = ax1.plot([1, 2, 3, 4], [2, 3, 4, 1], label='Line 2')
ax1.set_title('Subplot 1 - how2matplotlib.com')

line3, = ax2.plot([1, 2, 3, 4], [3, 1, 4, 2], label='Line 3')
line4, = ax2.plot([1, 2, 3, 4], [4, 2, 1, 3], label='Line 4')
ax2.set_title('Subplot 2 - how2matplotlib.com')

fig.legend([line1, line2, line3, line4], ['Line 1', 'Line 2', 'Line 3', 'Line 4'],
           loc='lower center', ncol=4, labelspacing=1.5, columnspacing=2)

plt.tight_layout()
plt.subplots_adjust(bottom=0.2)  # Make room for the legend
plt.show()
Output:
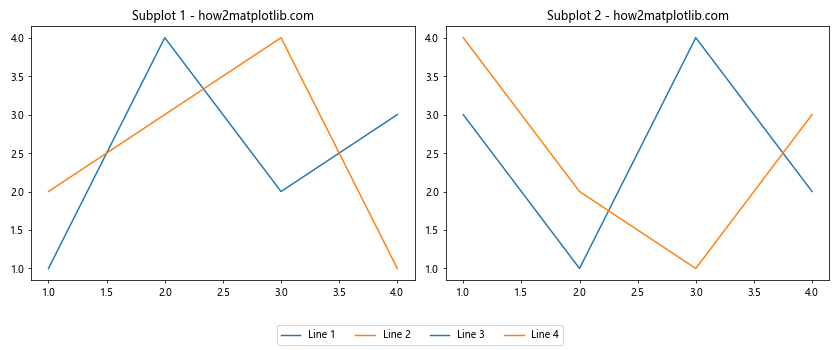
In this example, we create two subplots and use fig.legend() to create a single legend for the entire figure. We set labelspacing=1.5 to increase the vertical spacing between entries and columnspacing=2 to adjust the horizontal spacing between columns. We also use plt.subplots_adjust(bottom=0.2) to make room for the legend at the bottom of the figure.
Method 7: Dynamic Spacing Based on Number of Entries
Sometimes, you may want to adjust the vertical spacing between legend entries in Matplotlib dynamically based on the number of entries. This can be useful when dealing with plots that have a variable number of legend items.
Here’s an example of how to change the vertical spacing between legend entries in Matplotlib dynamically:
import matplotlib.pyplot as plt
import numpy as np

def plot_with_dynamic_legend_spacing(num_lines):
    plt.figure(figsize=(8, 6))
    for i in range(num_lines):
        plt.plot(np.random.rand(10), label=f'Line {i+1}')

    plt.title(f'Dynamic Legend Spacing ({num_lines} lines) - how2matplotlib.com')
    plt.xlabel('X-axis')
    plt.ylabel('Y-axis')

    # Calculate dynamic labelspacing
    labelspacing = max(0.5, 2 - 0.1 * num_lines)
    plt.legend(labelspacing=labelspacing)
    plt.show()

# Example usage
plot_with_dynamic_legend_spacing(3)
plot_with_dynamic_legend_spacing(8)
In this example, we define a function plot_with_dynamic_legend_spacing() that takes the number of lines as an argument. It creates a plot with the specified number of lines and calculates a dynamic labelspacing value based on the number of entries. The spacing decreases as the number of entries increases, ensuring that the legend remains compact for plots with many items.
Method 8: Using HandlerBase for Custom Legend Entries
For more advanced customization of legend entries and their spacing, you can create a custom HandlerBase class. This approach allows you to have full control over how legend entries are drawn, including their vertical spacing.
Here’s an example of how to change the vertical spacing between legend entries in Matplotlib using a custom HandlerBase:
import matplotlib.pyplot as plt
from matplotlib.legend_handler import HandlerBase

class CustomHandler(HandlerBase):
    def __init__(self, height=0.5, spacing=0.2, *args, **kwargs):
        self.height = height
        self.spacing = spacing
        super().__init__(*args, **kwargs)

    def create_artists(self, legend, orig_handle, xdescent, ydescent, width, height, fontsize, trans):
        line = plt.Line2D([0], [0], color=orig_handle.get_color())
        y = ydescent - self.height / 2. - self.spacing
        return [line]

plt.figure(figsize=(8, 6))
plt.plot([1, 2, 3, 4], [1, 4, 2, 3], label='Line 1')
plt.plot([1, 2, 3, 4], [2, 3, 4, 1], label='Line 2')
plt.title('Custom Legend Handler - how2matplotlib.com')
plt.xlabel('X-axis')
plt.ylabel('Y-axis')

plt.legend(handler_map={plt.Line2D: CustomHandler(height=0.8, spacing=0.5)})
plt.show()
Output:
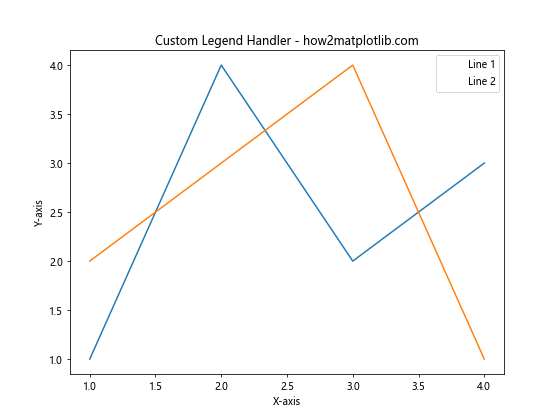
In this example, we define a CustomHandler class that inherits from HandlerBase. This custom handler allows us to control the height of each legend entry and the spacing between them. We then use this custom handler in the handler_map argument when creating the legend.
Method 9: Adjusting Legend Text Properties
Another way to change the vertical spacing between legend entries in Matplotlib is by adjusting the text properties of the legend labels. By modifying the font size or line height, you can indirectly affect the spacing between entries.
Here’s an example of how to change the vertical spacing between legend entries in Matplotlib by adjusting text properties:
import matplotlib.pyplot as plt

plt.figure(figsize=(8, 6))
plt.plot([1, 2, 3, 4], [1, 4, 2, 3], label='Line 1')
plt.plot([1, 2, 3, 4], [2, 3, 4, 1], label='Line 2')
plt.title('Adjusted Legend Text Properties - how2matplotlib.com')
plt.xlabel('X-axis')
plt.ylabel('Y-axis')

legend = plt.legend()
for text in legend.get_texts():
    text.set_fontsize(12)  # Adjust font size
    text.set_linespacing(1.5)  # Adjust line spacing

plt.show()
Output:
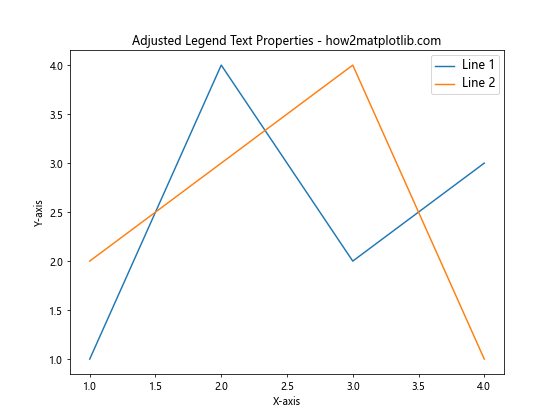
In this example, we create the legend and then iterate through its text elements. We adjust the font size using set_fontsize() and the line spacing using set_linespacing().## Method 10: Using GridSpec for Legend Placement
When working with complex layouts, you can use GridSpec to create a dedicated space for the legend and adjust its vertical spacing. This method gives you precise control over the legend’s position and size relative to the plot.
Here’s an example of how to change the vertical spacing between legend entries in Matplotlib using GridSpec:
import matplotlib.pyplot as plt
from matplotlib.gridspec import GridSpec

fig = plt.figure(figsize=(10, 6))
gs = GridSpec(1, 2, width_ratios=[3, 1])

ax = fig.add_subplot(gs[0])
for i in range(5):
    ax.plot([1, 2, 3, 4], [i+1, i+2, i+3, i+4], label=f'Line {i+1}')

ax.set_title('Plot with Separate Legend - how2matplotlib.com')
ax.set_xlabel('X-axis')
ax.set_ylabel('Y-axis')

legend_ax = fig.add_subplot(gs[1])
legend_ax.axis('off')
legend = legend_ax.legend(*ax.get_legend_handles_labels(), loc='center left', labelspacing=1.5)

plt.tight_layout()
plt.show()
Output:
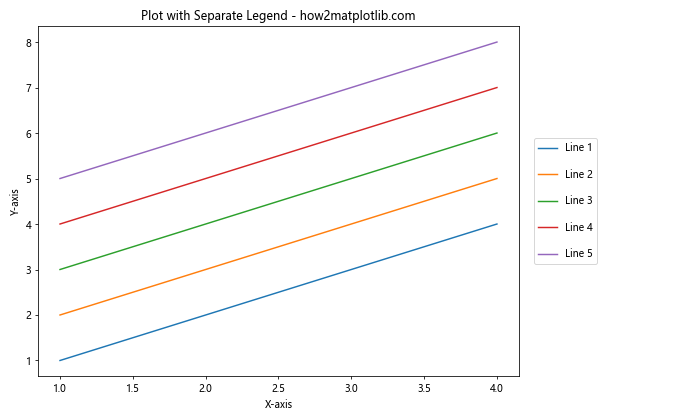
In this example, we use GridSpec to create two columns: one for the plot and one for the legend. We then create the legend in a separate subplot, which allows us to adjust its position and spacing independently of the main plot.
Method 11: Using constrained_layout for Automatic Spacing
Matplotlib’s constrained_layout feature can help automatically adjust the spacing between plot elements, including legends. While it doesn’t directly control the vertical spacing between legend entries, it can be useful for overall layout management.
Here’s how to use constrained_layout to improve legend placement and spacing:
import matplotlib.pyplot as plt

plt.figure(figsize=(8, 6), constrained_layout=True)
for i in range(5):
    plt.plot([1, 2, 3, 4], [i+1, i+2, i+3, i+4], label=f'Line {i+1}')

plt.title('Constrained Layout Example - how2matplotlib.com')
plt.xlabel('X-axis')
plt.ylabel('Y-axis')
plt.legend(bbox_to_anchor=(1.05, 1), loc='upper left', borderaxespad=0)

plt.show()
Output:
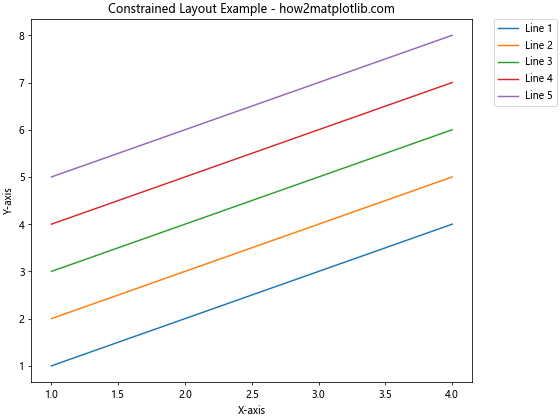
In this example, we set constrained_layout=True when creating the figure. This automatically adjusts the layout to accommodate the legend placed outside the plot area.
Method 12: Creating a Custom Legend Function
For more complex scenarios, you can create a custom function to generate and position the legend with specific vertical spacing. This approach gives you full control over the legend’s appearance and placement.
Here’s an example of a custom legend function that allows you to change the vertical spacing between legend entries in Matplotlib:
import matplotlib.pyplot as plt

def custom_legend(ax, spacing=1.2, loc='best', **kwargs):
    handles, labels = ax.get_legend_handles_labels()
    figlegend = ax.figure.legend(handles, labels, loc=loc, **kwargs)

    for t in figlegend.get_texts():
        t.set_y(t.get_position()[1] - (1 - spacing) * t.get_fontsize() / 72)

    return figlegend

plt.figure(figsize=(8, 6))
for i in range(4):
    plt.plot([1, 2, 3, 4], [i+1, i+2, i+3, i+4], label=f'Line {i+1}')

plt.title('Custom Legend Function - how2matplotlib.com')
plt.xlabel('X-axis')
plt.ylabel('Y-axis')

custom_legend(plt.gca(), spacing=1.5, bbox_to_anchor=(1.05, 1), loc='upper left')
plt.tight_layout()
plt.show()
Output:
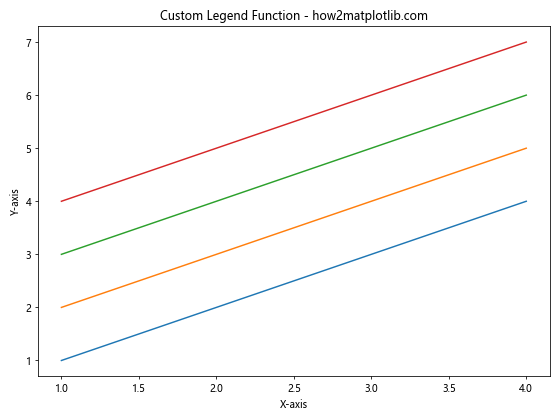
In this example, we define a custom_legend() function that creates a figure-level legend and adjusts the vertical position of each text element based on the specified spacing.
Method 13: Using ax.add_artist() for Multiple Legends
Sometimes you may want to create multiple legends with different vertical spacings. You can achieve this by using ax.add_artist() to add legends as separate artists to the plot.
Here’s how to change the vertical spacing between legend entries in Matplotlib using multiple legends:
import matplotlib.pyplot as plt

fig, ax = plt.subplots(figsize=(8, 6))

line1, = ax.plot([1, 2, 3, 4], [1, 4, 2, 3], label='Line 1')
line2, = ax.plot([1, 2, 3, 4], [2, 3, 4, 1], label='Line 2')
line3, = ax.plot([1, 2, 3, 4], [3, 1, 4, 2], label='Line 3')
line4, = ax.plot([1, 2, 3, 4], [4, 2, 1, 3], label='Line 4')

ax.set_title('Multiple Legends - how2matplotlib.com')
ax.set_xlabel('X-axis')
ax.set_ylabel('Y-axis')

# Create and add the first legend
legend1 = ax.legend([line1, line2], ['Line 1', 'Line 2'], loc='upper left', labelspacing=0.8)
ax.add_artist(legend1)

# Create and add the second legend
legend2 = ax.legend([line3, line4], ['Line 3', 'Line 4'], loc='lower right', labelspacing=1.5)

plt.tight_layout()
plt.show()
Output:
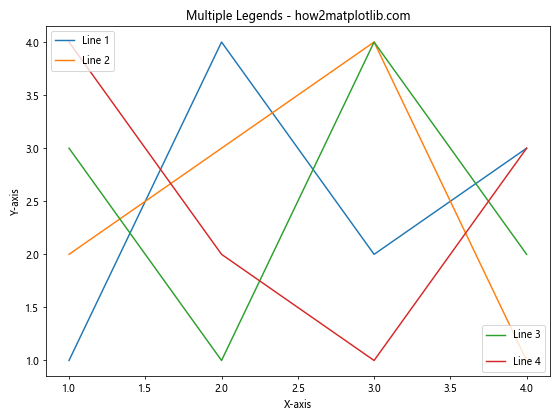
In this example, we create two separate legends with different vertical spacings using ax.legend() and ax.add_artist().
Method 14: Adjusting Legend Spacing in 3D Plots
Changing the vertical spacing between legend entries in Matplotlib for 3D plots follows similar principles, but with some slight differences in implementation.
Here’s an example of how to adjust legend spacing in a 3D plot:
import matplotlib.pyplot as plt
import numpy as np
from mpl_toolkits.mplot3d import Axes3D

fig = plt.figure(figsize=(10, 8))
ax = fig.add_subplot(111, projection='3d')

# Generate some sample data
x = np.linspace(-5, 5, 100)
y = np.linspace(-5, 5, 100)
X, Y = np.meshgrid(x, y)
Z1 = np.sin(np.sqrt(X**2 + Y**2))
Z2 = np.cos(np.sqrt(X**2 + Y**2))

# Plot the surfaces
surf1 = ax.plot_surface(X, Y, Z1, cmap='viridis', alpha=0.7, label='Surface 1')
surf2 = ax.plot_surface(X, Y, Z2, cmap='plasma', alpha=0.7, label='Surface 2')

ax.set_xlabel('X-axis')
ax.set_ylabel('Y-axis')
ax.set_zlabel('Z-axis')
ax.set_title('3D Plot with Adjusted Legend Spacing - how2matplotlib.com')

# Create a proxy artist for the legend
proxy1 = plt.Rectangle((0, 0), 1, 1, fc='viridis')
proxy2 = plt.Rectangle((0, 0), 1, 1, fc='plasma')

# Add the legend with adjusted spacing
ax.legend([proxy1, proxy2], ['Surface 1', 'Surface 2'], loc='upper left', bbox_to_anchor=(1.1, 1),
          labelspacing=1.5, handlelength=3, handletextpad=1)

plt.tight_layout()
plt.show()
In this example, we create a 3D plot with two surfaces and adjust the legend spacing using the labelspacing parameter. We also use proxy artists to represent the surfaces in the legend.
Method 15: Dynamic Legend Spacing Based on Figure Size
You can create a function that adjusts the vertical spacing between legend entries in Matplotlib based on the figure size. This approach ensures that the legend spacing remains proportional to the overall plot size.
Here’s an example of how to implement dynamic legend spacing based on figure size:
import matplotlib.pyplot as plt

def plot_with_dynamic_spacing(figsize):
    fig, ax = plt.subplots(figsize=figsize)

    for i in range(5):
        ax.plot([1, 2, 3, 4], [i+1, i+2, i+3, i+4], label=f'Line {i+1}')

    ax.set_title(f'Dynamic Spacing (Figure size: {figsize}) - how2matplotlib.com')
    ax.set_xlabel('X-axis')
    ax.set_ylabel('Y-axis')

    # Calculate dynamic labelspacing based on figure height
    labelspacing = max(0.5, figsize[1] * 0.1)
    ax.legend(labelspacing=labelspacing)

    plt.tight_layout()
    plt.show()

# Example usage
plot_with_dynamic_spacing((8, 6))
plot_with_dynamic_spacing((10, 8))
In this example, we define a function plot_with_dynamic_spacing() that takes the figure size as an argument. It then calculates the labelspacing based on the figure height, ensuring that the legend spacing remains proportional to the overall plot size.
Conclusion
In this comprehensive guide, we’ve explored various methods to change the vertical spacing between legend entries in Matplotlib. From simple parameter adjustments to advanced custom functions, you now have a wide range of techniques at your disposal to create visually appealing and well-spaced legends for your plots.
Remember that the best method to change the vertical spacing between legend entries in Matplotlib depends on your specific use case and the complexity of your plot. Experiment with different approaches to find the one that works best for your visualization needs.
Key takeaways for changing the vertical spacing between legend entries in Matplotlib include:
- Use the
labelspacingparameter for quick and easy adjustments. - Leverage
rcParamsfor consistent spacing across multiple plots. - Customize legend box properties for more precise control.
- Utilize
columnspacingfor multi-column legends. - Employ
bbox_to_anchorfor advanced legend placement. - Create figure-level legends with
figlegend()for complex layouts. - Implement dynamic spacing based on the number of entries or figure size.
- Use custom handlers for complete control over legend entry appearance.
- Adjust text properties to indirectly affect spacing.
- Utilize
GridSpecfor dedicated legend placement in complex layouts. - Leverage
constrained_layoutfor automatic spacing adjustments. - Create custom legend functions for specific requirements.
- Use
add_artist()to create multiple legends with different spacings. - Apply similar principles to 3D plots with some adjustments.
- Implement dynamic spacing based on figure size for responsive designs.