How to Hide Axis Borders and White Spaces in Matplotlib
Hide Axis Borders and White Spaces in Matplotlib is an essential skill for creating clean and professional-looking visualizations. This article will explore various techniques to hide axis borders and remove white spaces in Matplotlib plots, providing you with the knowledge to enhance your data visualization projects.
Understanding the Importance of Hiding Axis Borders and White Spaces
Before we dive into the specifics of how to hide axis borders and white spaces in Matplotlib, it’s crucial to understand why this technique is important. When creating visualizations, the goal is often to present data in the clearest and most visually appealing way possible. Unnecessary axis borders and white spaces can distract from the main content of the plot and make it appear cluttered or unprofessional.
By learning how to hide axis borders and white spaces in Matplotlib, you can:
- Create cleaner, more focused visualizations
- Maximize the use of available space for your data
- Improve the overall aesthetic of your plots
- Enhance the readability and interpretability of your data
Now, let’s explore various methods to hide axis borders and white spaces in Matplotlib.
Basic Techniques to Hide Axis Borders
Removing All Axis Borders
One of the simplest ways to hide axis borders in Matplotlib is to remove them entirely. This can be achieved using the spines property of the axes object. Here’s an example:
import matplotlib.pyplot as plt

# Create a sample plot
plt.figure(figsize=(8, 6))
plt.plot([1, 2, 3, 4], [1, 4, 2, 3], label='how2matplotlib.com')
plt.title('Hide Axis Borders in Matplotlib')

# Hide all spines
for spine in plt.gca().spines.values():
    spine.set_visible(False)

plt.legend()
plt.show()
Output:
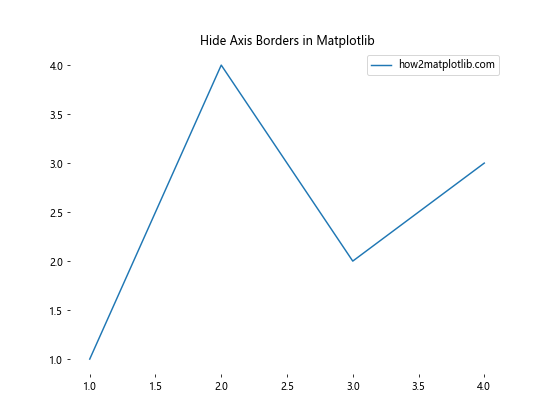
In this example, we iterate through all the spines (borders) of the current axes and set their visibility to False. This effectively hides all axis borders, creating a clean, borderless plot.
Selectively Hiding Specific Axis Borders
Sometimes, you may want to hide only specific axis borders while keeping others visible. Matplotlib allows you to do this by targeting individual spines. Here’s an example that hides the top and right borders:
import matplotlib.pyplot as plt

# Create a sample plot
plt.figure(figsize=(8, 6))
plt.plot([1, 2, 3, 4], [1, 4, 2, 3], label='how2matplotlib.com')
plt.title('Hide Specific Axis Borders in Matplotlib')

# Hide top and right spines
plt.gca().spines['top'].set_visible(False)
plt.gca().spines['right'].set_visible(False)

plt.legend()
plt.show()
Output:
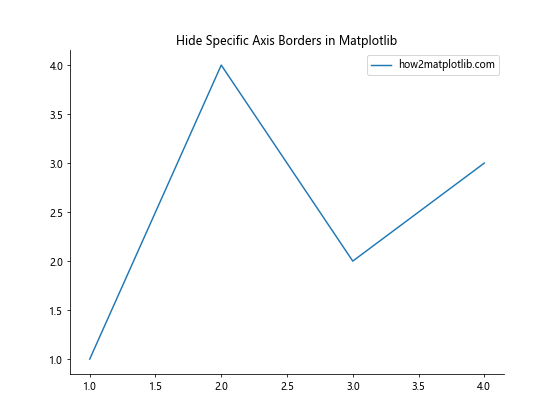
This code specifically targets the ‘top’ and ‘right’ spines and sets their visibility to False, while leaving the bottom and left borders intact.
Removing White Spaces Around the Plot
White spaces around the plot can often make the visualization appear smaller than necessary. Let’s explore some techniques to remove these white spaces and maximize the use of available space.
Using tight_layout()
The tight_layout() function in Matplotlib automatically adjusts the spacing between plot elements to minimize white space. Here’s how to use it:
import matplotlib.pyplot as plt

# Create a sample plot
plt.figure(figsize=(8, 6))
plt.plot([1, 2, 3, 4], [1, 4, 2, 3], label='how2matplotlib.com')
plt.title('Remove White Spaces with tight_layout()')

# Apply tight layout
plt.tight_layout()

plt.legend()
plt.show()
Output:
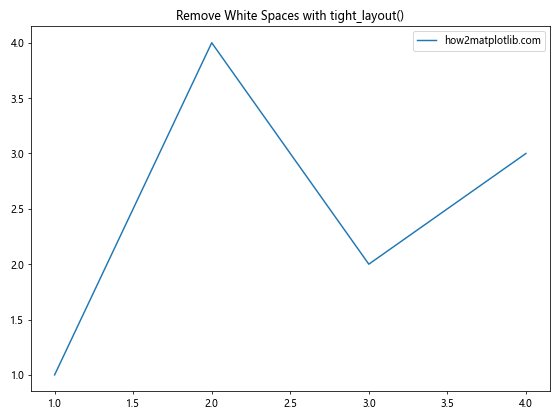
By calling plt.tight_layout() before plt.show(), Matplotlib automatically adjusts the layout to reduce white space around the plot.
Adjusting Subplot Parameters
For more fine-grained control over white space removal, you can adjust subplot parameters using subplots_adjust(). Here’s an example:
import matplotlib.pyplot as plt

# Create a sample plot
plt.figure(figsize=(8, 6))
plt.plot([1, 2, 3, 4], [1, 4, 2, 3], label='how2matplotlib.com')
plt.title('Remove White Spaces with subplots_adjust()')

# Adjust subplot parameters
plt.subplots_adjust(left=0.05, right=0.95, top=0.95, bottom=0.05)

plt.legend()
plt.show()
Output:
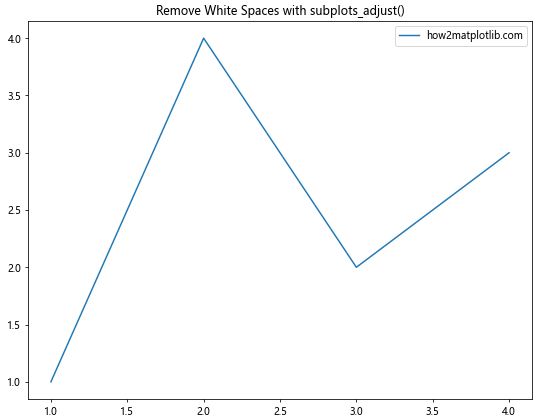
In this example, we set the left, right, top, and bottom parameters to reduce the white space around the plot. Adjust these values as needed for your specific visualization.
Advanced Techniques for Hiding Axis Borders and White Spaces
Using set_axis_off()
For a quick way to hide all axis elements, including borders, ticks, and labels, you can use the set_axis_off() method. Here’s an example:
import matplotlib.pyplot as plt

# Create a sample plot
plt.figure(figsize=(8, 6))
plt.plot([1, 2, 3, 4], [1, 4, 2, 3], label='how2matplotlib.com')
plt.title('Hide All Axis Elements with set_axis_off()')

# Turn off all axis elements
plt.gca().set_axis_off()

plt.legend()
plt.show()
Output:
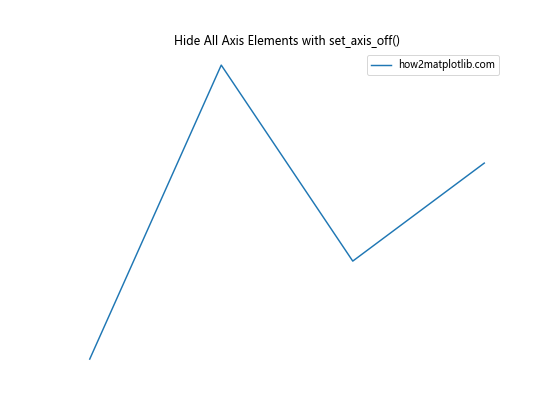
This method is particularly useful when you want to create a plot without any axis elements, focusing solely on the data visualization.
Customizing Axis Appearance
Instead of completely hiding axis borders, you might want to customize their appearance to better suit your visualization. Here’s an example of how to change the color and width of axis borders:
import matplotlib.pyplot as plt

# Create a sample plot
plt.figure(figsize=(8, 6))
plt.plot([1, 2, 3, 4], [1, 4, 2, 3], label='how2matplotlib.com')
plt.title('Customize Axis Borders in Matplotlib')

# Customize axis borders
for spine in plt.gca().spines.values():
    spine.set_edgecolor('gray')
    spine.set_linewidth(0.5)

plt.legend()
plt.show()
Output:
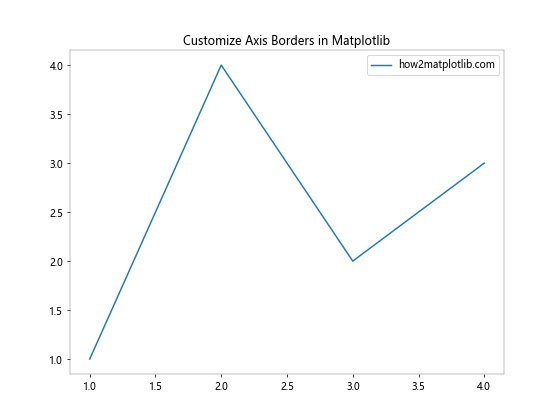
In this example, we set the edge color of all spines to gray and reduce their line width to 0.5, creating a subtle border effect.
Handling White Spaces in Subplots
When working with multiple subplots, managing white spaces becomes even more important. Let’s explore some techniques to hide axis borders and remove white spaces in subplot layouts.
Using gridspec
The gridspec module in Matplotlib provides powerful tools for creating complex subplot layouts with minimal white space. Here’s an example:
import matplotlib.pyplot as plt
import matplotlib.gridspec as gridspec

# Create a figure with GridSpec
fig = plt.figure(figsize=(12, 8))
gs = gridspec.GridSpec(2, 2, wspace=0.1, hspace=0.1)

# Create subplots
ax1 = fig.add_subplot(gs[0, 0])
ax2 = fig.add_subplot(gs[0, 1])
ax3 = fig.add_subplot(gs[1, :])

# Add data to subplots
ax1.plot([1, 2, 3], [1, 2, 3], label='how2matplotlib.com')
ax2.scatter([1, 2, 3], [3, 2, 1], label='how2matplotlib.com')
ax3.bar([1, 2, 3], [2, 3, 1], label='how2matplotlib.com')

# Hide axis borders for all subplots
for ax in [ax1, ax2, ax3]:
    for spine in ax.spines.values():
        spine.set_visible(False)

plt.tight_layout()
plt.show()
Output:
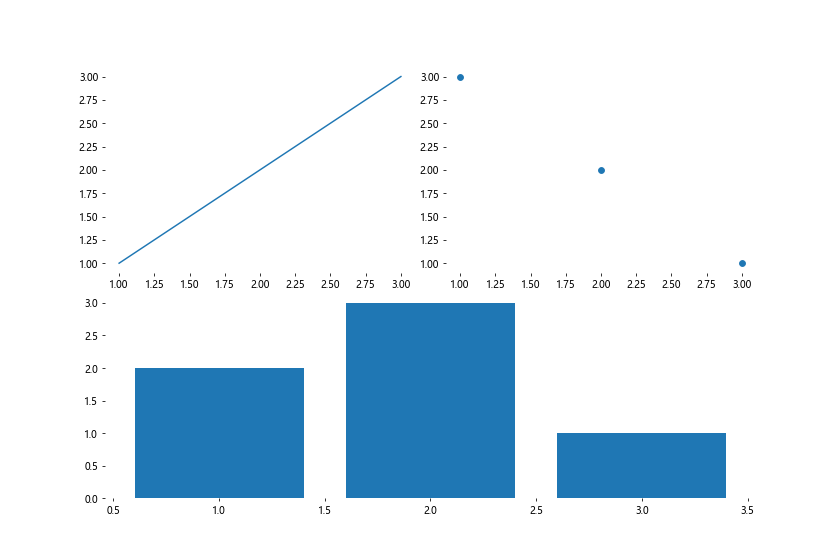
In this example, we use gridspec to create a layout with three subplots, minimizing the white space between them. We then hide the axis borders for all subplots using a loop.
Adjusting Spacing Between Subplots
When working with subplots, you can adjust the spacing between them to reduce white space. Here’s an example using subplots() and subplots_adjust():
import matplotlib.pyplot as plt

# Create subplots
fig, (ax1, ax2) = plt.subplots(1, 2, figsize=(12, 6))

# Add data to subplots
ax1.plot([1, 2, 3], [1, 2, 3], label='how2matplotlib.com')
ax2.scatter([1, 2, 3], [3, 2, 1], label='how2matplotlib.com')

# Hide axis borders
for ax in [ax1, ax2]:
    for spine in ax.spines.values():
        spine.set_visible(False)

# Adjust spacing between subplots
plt.subplots_adjust(wspace=0.1)

plt.tight_layout()
plt.show()
Output:
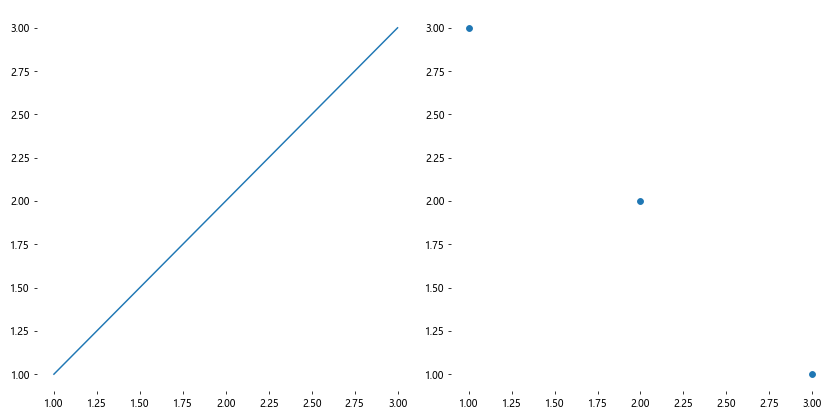
In this example, we create two subplots side by side, hide their axis borders, and then adjust the horizontal spacing between them using subplots_adjust().
Dealing with Axis Labels and Titles
When hiding axis borders and removing white spaces, it’s important to consider how this affects axis labels and titles. Let’s explore some techniques to handle these elements effectively.
Positioning Axis Labels
When you hide axis borders, you may need to adjust the position of axis labels. Here’s an example of how to do this:
import matplotlib.pyplot as plt

# Create a sample plot
fig, ax = plt.subplots(figsize=(8, 6))
ax.plot([1, 2, 3, 4], [1, 4, 2, 3], label='how2matplotlib.com')
ax.set_title('Positioning Axis Labels in Matplotlib')

# Hide axis borders
for spine in ax.spines.values():
    spine.set_visible(False)

# Position axis labels
ax.set_xlabel('X-axis Label', labelpad=10)
ax.set_ylabel('Y-axis Label', labelpad=10)

ax.legend()
plt.tight_layout()
plt.show()
Output:
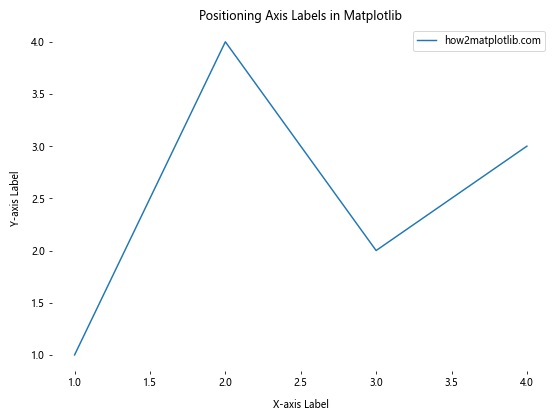
In this example, we use the labelpad parameter to adjust the distance between the axis labels and the plot area, ensuring they remain visible even when the axis borders are hidden.
Customizing Title Position
When removing white spaces, you may need to adjust the position of the plot title to prevent it from being cut off. Here’s how to do this:
import matplotlib.pyplot as plt

# Create a sample plot
fig, ax = plt.subplots(figsize=(8, 6))
ax.plot([1, 2, 3, 4], [1, 4, 2, 3], label='how2matplotlib.com')

# Hide axis borders
for spine in ax.spines.values():
    spine.set_visible(False)

# Customize title position
ax.set_title('Customizing Title Position in Matplotlib', pad=20)

ax.legend()
plt.tight_layout()
plt.show()
Output:
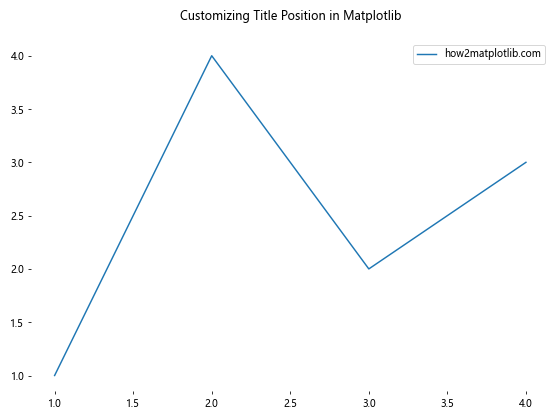
In this example, we use the pad parameter in set_title() to adjust the distance between the title and the plot area, ensuring it remains visible when white spaces are removed.
Handling Color Bars and Legends
When hiding axis borders and removing white spaces, it’s important to consider how these changes affect color bars and legends in your plots.
Positioning Color Bars
Color bars can be particularly challenging when removing white spaces. Here’s an example of how to position a color bar effectively:
import matplotlib.pyplot as plt
import numpy as np

# Create a sample heatmap
fig, ax = plt.subplots(figsize=(8, 6))
data = np.random.rand(10, 10)
im = ax.imshow(data, cmap='viridis')

# Hide axis borders
for spine in ax.spines.values():
    spine.set_visible(False)

# Add and position color bar
cbar = plt.colorbar(im, ax=ax, pad=0.01)
cbar.outline.set_visible(False)

ax.set_title('Positioning Color Bars in Matplotlib')
plt.tight_layout()
plt.show()
Output:
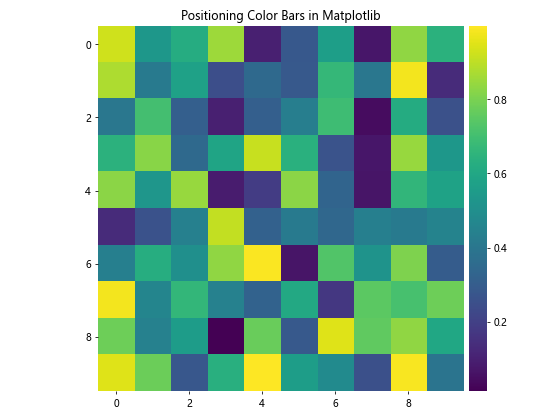
In this example, we create a heatmap and add a color bar. We use the pad parameter in plt.colorbar() to adjust the distance between the color bar and the plot area. We also hide the outline of the color bar to maintain a clean look.
Adjusting Legend Position
When hiding axis borders and removing white spaces, you may need to adjust the position of the legend. Here’s an example:
import matplotlib.pyplot as plt

# Create a sample plot
fig, ax = plt.subplots(figsize=(8, 6))
ax.plot([1, 2, 3, 4], [1, 4, 2, 3], label='how2matplotlib.com Line 1')
ax.plot([1, 2, 3, 4], [4, 3, 2, 1], label='how2matplotlib.com Line 2')

# Hide axis borders
for spine in ax.spines.values():
    spine.set_visible(False)

# Adjust legend position
ax.legend(loc='upper left', bbox_to_anchor=(1, 1))

ax.set_title('Adjusting Legend Position in Matplotlib')
plt.tight_layout()
plt.show()
Output:
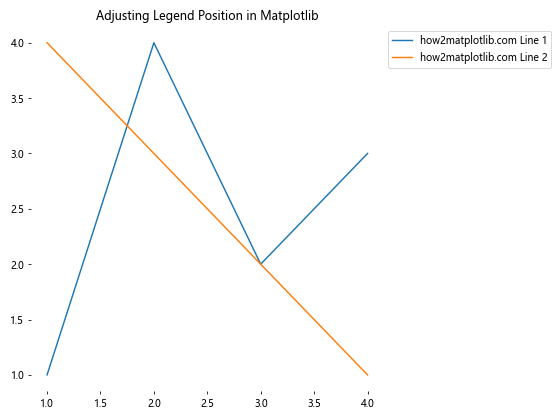
In this example, we use the loc and bbox_to_anchor parameters in ax.legend() to position the legend outside the plot area, ensuring it remains visible when white spaces are removed.
Handling Axis Ticks
When hiding axis borders, you may want to customize the appearance of axis ticks to maintain readability. Let’s explore some techniques for handling axis ticks.
Customizing Tick Appearance
Here’s an example of how to customize the appearance of axis ticks while hiding axis borders:
import matplotlib.pyplot as plt

# Create a sample plot
fig, ax = plt.subplots(figsize=(8, 6))
ax.plot([1, 2, 3, 4], [1, 4, 2, 3], label='how2matplotlib.com')

# Hide axis borders
for spine in ax.spines.values():
    spine.set_visible(False)

# Customize tick appearance
ax.tick_params(axis='both', which='both', length=0, pad=10, labelsize=10)

ax.set_title('Customizing Tick Appearance in Matplotlib')
ax.legend()
plt.tight_layout()
plt.show()
Output:

In this example, we use ax.tick_params() to customize the appearance of ticks. We set the tick length to 0 to hide the tick marks, increase the padding to move the tick labels away from the plot area, and adjust the label size.
Using Custom Tick Locations and Labels
Sometimes, you may want to use custom tick locations and labels when hiding axis borders. Here’s how to do this:
import matplotlib.pyplot as plt
import numpy as np

# Create a sample plot
fig, ax = plt.subplots(figsize=(8, 6))
x = np.linspace(0, 2*np.pi, 100)
y = np.sin(x)
ax.plot(x, y, label='how2matplotlib.com')

# Hide axis borders
for spine in ax.spines.values():
    spine.set_visible(False)

# Set custom tick locations and labels
x_ticks = [0, np.pi/2, np.pi, 3*np.pi/2, 2*np.pi]
x_labels = ['0', 'π/2', 'π', '3π/2', '2π']
ax.set_xticks(x_ticks)
ax.set_xticklabels(x_labels)

ax.set_title('Custom Tick Locations and Labels in Matplotlib')
ax.legend()
plt.tight_layout()
plt.show()
Output:
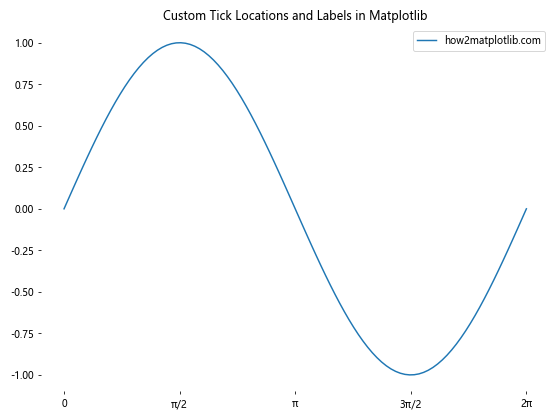
In this example, we create a sine wave plot and set custom tick locations and labels for the x-axis using ax.set_xticks() and ax.set_xticklabels().
Handling Polar Plots
Polar plots present unique challenges when it comes to hiding axis borders and removing white spaces. Let’s explore some techniques for handling polar plots.
Hiding Axis Borders in Polar Plots
Here’s an example of how to hide axis borders in a polar plot:
import matplotlib.pyplot as plt
import numpy as np

# Create a sample polar plot
fig, ax = plt.subplots(figsize=(8, 8), subplot_kw=dict(projection='polar'))

# Generate sample data
theta = np.linspace(0, 2*np.pi, 100)
r = np.abs(np.sin(4*theta))

# Plot the data
ax.plot(theta, r)

# Hide axis borders
ax.spines['polar'].set_visible(False)

ax.set_title('Hide Axis Borders in Polar Plots - how2matplotlib.com')
plt.tight_layout()
plt.show()
Output:
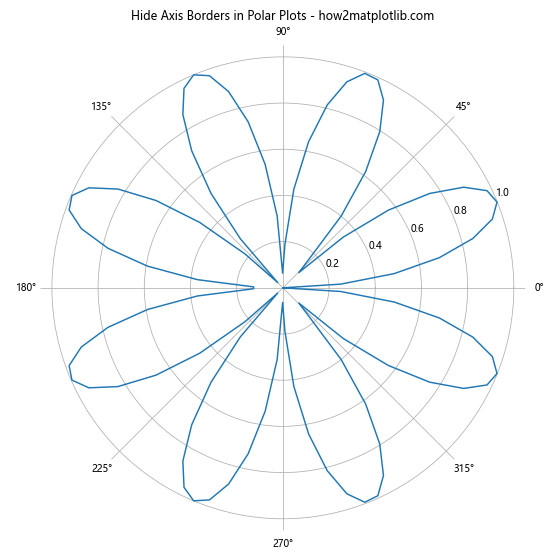
In this example, we create a polar plot and hide the axis border by setting the visibility of the ‘polar’ spine to False.
Removing White Spaces in Polar Plots
To remove white spaces in polar plots, we can adjust the plot limits and remove unnecessary elements. Here’s an example:
import matplotlib.pyplot as plt
import numpy as np

# Create a sample polar plot
fig, ax = plt.subplots(figsize=(8, 8), subplot_kw=dict(projection='polar'))

# Generate sample data
theta = np.linspace(0, 2*np.pi, 100)
r = np.abs(np.sin(4*theta))

# Plot the data
ax.plot(theta, r)

# Hide axis borders
ax.spines['polar'].set_visible(False)

# Remove radial ticks and labels
ax.set_yticks([])

# Remove theta ticks and labels
ax.set_xticks([])

# Set plot limits to remove white spaces
ax.set_ylim(0, 1)

ax.set_title('Remove White Spaces in Polar Plots - how2matplotlib.com')
plt.tight_layout()
plt.show()
Output:
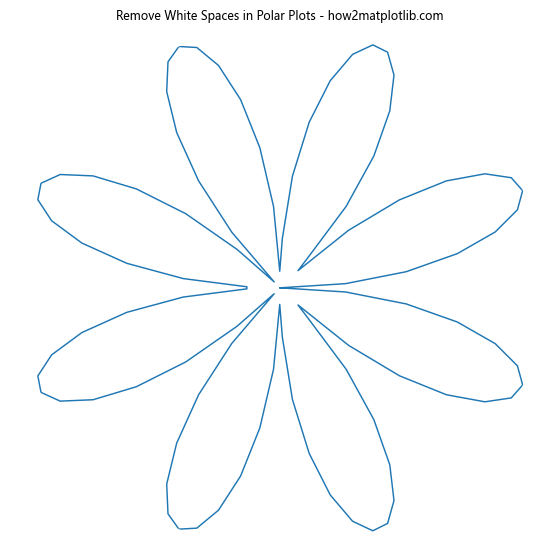
In this example, we remove radial and theta ticks and labels, and set the y-limit to match the maximum value of the data, effectively removing white spaces around the plot.
Best Practices for Hiding Axis Borders and White Spaces
When working to hide axis borders and white spaces in Matplotlib, it’s important to follow some best practices to ensure your visualizations are both aesthetically pleasing and informative. Here are some key considerations:
- Maintain readability: While hiding axis borders can create a cleaner look, make sure your plot remains easily interpretable. Use grid lines, labels, or other visual cues if necessary.
Be consistent: If you’re creating multiple plots for a single project or presentation, maintain a consistent style across all visualizations.
Consider your audience: The level of simplification should be appropriate for your target audience. Technical audiences may prefer more detailed plots, while general audiences might appreciate simpler, cleaner visualizations.
Use color effectively: With borders removed, color becomes even more important for distinguishing different elements of your plot. Choose your color palette carefully.
Test different approaches: Experiment with various techniques for hiding borders and removing white spaces to find what works best for your specific data and visualization goals.
Preserve important information: Ensure that hiding borders and removing white spaces doesn’t inadvertently remove important data or context from your plot.
Balance aesthetics and functionality: While a clean, minimalist plot can be visually appealing, make sure it still effectively communicates your data.
Troubleshooting Common Issues
When attempting to hide axis borders and white spaces in Matplotlib, you may encounter some common issues. Here are some problems you might face and how to solve them: