How to Add a Grid on a Figure in Matplotlib
How to add a grid on a figure in Matplotlib is an essential skill for data visualization enthusiasts and professionals alike. Matplotlib, a powerful plotting library for Python, offers various ways to enhance your plots with grids, making them more readable and visually appealing. In this comprehensive guide, we’ll explore different methods and techniques to add grids to your Matplotlib figures, providing you with the knowledge to create stunning and informative visualizations.
Understanding the Importance of Grids in Matplotlib
Before we dive into the specifics of how to add a grid on a figure in Matplotlib, let’s discuss why grids are crucial in data visualization. Grids serve several purposes:
- Improved readability: Grids help viewers accurately interpret data points by providing reference lines.
- Enhanced comparisons: With grids, it’s easier to compare values across different parts of the plot.
- Professional appearance: Well-placed grids can make your visualizations look more polished and professional.
Now that we understand the importance of grids, let’s explore how to add them to your Matplotlib figures.
Basic Grid Addition in Matplotlib
The simplest way to add a grid on a figure in Matplotlib is by using the grid() function. This method adds a basic grid to your plot with default settings. Let’s look at an example:
import matplotlib.pyplot as plt
import numpy as np

x = np.linspace(0, 10, 100)
y = np.sin(x)

plt.figure(figsize=(10, 6))
plt.plot(x, y, label='Sine Wave')
plt.title('How to add a grid on a figure in Matplotlib - Basic Example')
plt.xlabel('X-axis')
plt.ylabel('Y-axis')
plt.legend()
plt.grid(True)
plt.text(5, 0.5, 'how2matplotlib.com', fontsize=12, alpha=0.5)
plt.show()
Output:
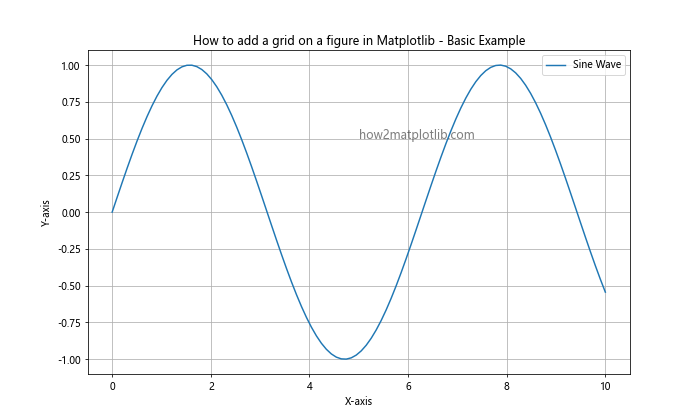
In this example, we create a simple sine wave plot and add a grid using plt.grid(True). The True argument enables the grid, while False would disable it. This method adds both horizontal and vertical grid lines to your plot.
Customizing Grid Appearance
While the basic grid is useful, Matplotlib offers various options to customize how to add a grid on a figure. Let’s explore some of these customization options:
Changing Grid Line Style
You can modify the grid line style using the linestyle parameter:
import matplotlib.pyplot as plt
import numpy as np

x = np.linspace(0, 10, 100)
y = np.cos(x)

plt.figure(figsize=(10, 6))
plt.plot(x, y, label='Cosine Wave')
plt.title('How to add a grid on a figure in Matplotlib - Custom Line Style')
plt.xlabel('X-axis')
plt.ylabel('Y-axis')
plt.legend()
plt.grid(True, linestyle='--')
plt.text(5, 0.5, 'how2matplotlib.com', fontsize=12, alpha=0.5)
plt.show()
Output:
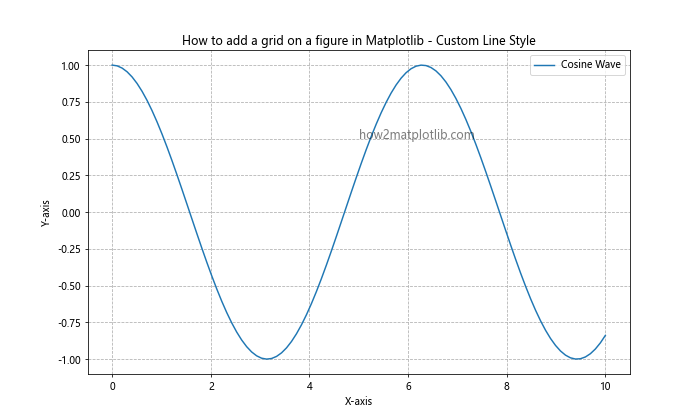
In this example, we use a dashed line style ('--') for the grid. You can experiment with other line styles like ':' for dotted lines or '-.' for dash-dot lines.
Adjusting Grid Line Color and Transparency
To change the color and transparency of grid lines, use the color and alpha parameters:
import matplotlib.pyplot as plt
import numpy as np

x = np.linspace(0, 10, 100)
y = np.tan(x)

plt.figure(figsize=(10, 6))
plt.plot(x, y, label='Tangent Wave')
plt.title('How to add a grid on a figure in Matplotlib - Custom Color and Transparency')
plt.xlabel('X-axis')
plt.ylabel('Y-axis')
plt.legend()
plt.grid(True, color='red', alpha=0.3)
plt.text(5, 0.5, 'how2matplotlib.com', fontsize=12, alpha=0.5)
plt.show()
Output:
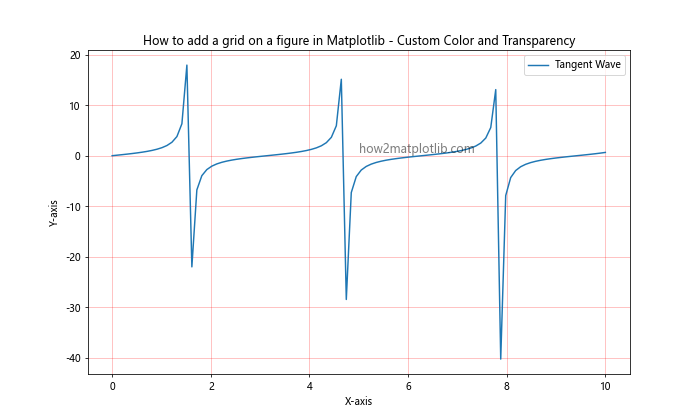
This example sets the grid color to red and reduces its opacity to 30% for a subtle effect.
Adding Major and Minor Grids
Matplotlib allows you to add both major and minor grids to your figure. This is particularly useful when you want to provide more detailed reference lines. Here’s how to add a grid on a figure in Matplotlib with both major and minor gridlines:
import matplotlib.pyplot as plt
import numpy as np

x = np.linspace(0, 10, 100)
y = np.exp(x)

fig, ax = plt.subplots(figsize=(10, 6))
ax.plot(x, y, label='Exponential')
ax.set_title('How to add a grid on a figure in Matplotlib - Major and Minor Grids')
ax.set_xlabel('X-axis')
ax.set_ylabel('Y-axis')
ax.legend()

ax.grid(which='major', color='#DDDDDD', linewidth=0.8)
ax.grid(which='minor', color='#EEEEEE', linestyle=':', linewidth=0.5)
ax.minorticks_on()

plt.text(5, np.exp(5), 'how2matplotlib.com', fontsize=12, alpha=0.5)
plt.show()
Output:
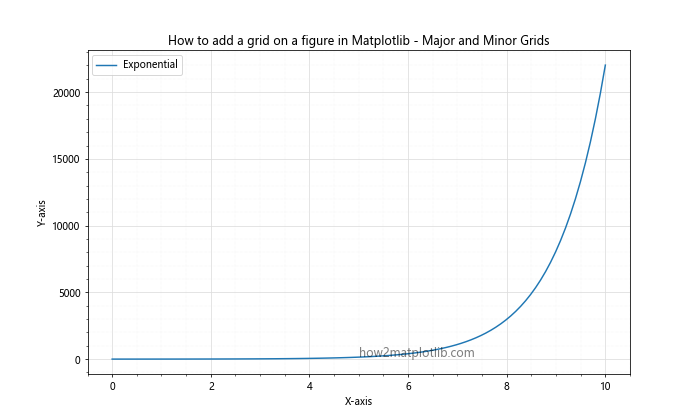
In this example, we use the ax.grid() method to add both major and minor grids. The which parameter specifies whether we’re modifying the major or minor grid. We also use ax.minorticks_on() to enable minor ticks, which are necessary for the minor grid to appear.
Grid Placement Options
When considering how to add a grid on a figure in Matplotlib, you might want to control where the grid lines appear. Matplotlib offers options to place grid lines behind or in front of your plot elements.
Placing Grid Behind Plot Elements
To place the grid behind your plot elements, use the zorder parameter:
import matplotlib.pyplot as plt
import numpy as np

x = np.linspace(0, 10, 100)
y = np.log(x)

plt.figure(figsize=(10, 6))
plt.plot(x, y, label='Logarithmic', linewidth=2)
plt.title('How to add a grid on a figure in Matplotlib - Grid Behind Plot')
plt.xlabel('X-axis')
plt.ylabel('Y-axis')
plt.legend()
plt.grid(True, zorder=0)
plt.text(5, 1, 'how2matplotlib.com', fontsize=12, alpha=0.5)
plt.show()
Output:
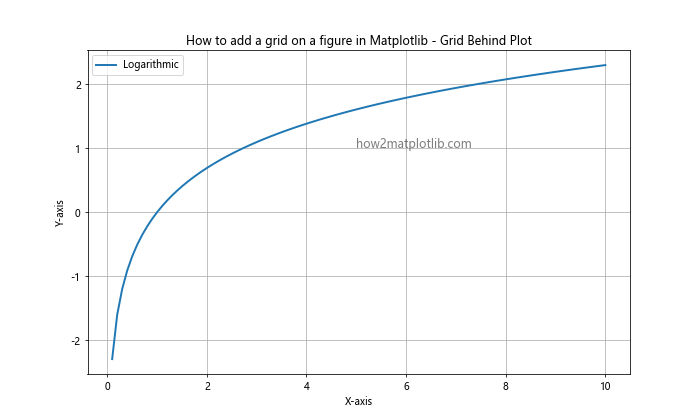
By setting zorder=0, we ensure that the grid is drawn before the plot elements, effectively placing it behind them.
Placing Grid in Front of Plot Elements
If you prefer the grid to be in front of your plot elements, you can adjust the zorder accordingly:
import matplotlib.pyplot as plt
import numpy as np

x = np.linspace(0, 10, 100)
y = np.sqrt(x)

plt.figure(figsize=(10, 6))
plt.plot(x, y, label='Square Root', linewidth=2)
plt.title('How to add a grid on a figure in Matplotlib - Grid in Front of Plot')
plt.xlabel('X-axis')
plt.ylabel('Y-axis')
plt.legend()
plt.grid(True, zorder=5)
plt.text(5, 2, 'how2matplotlib.com', fontsize=12, alpha=0.5)
plt.show()
Output:
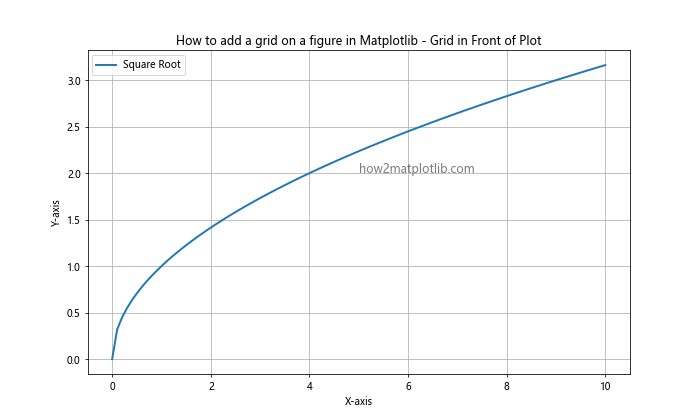
Here, we set zorder=5 to place the grid in front of the plot elements. Adjust this value as needed to achieve the desired layering effect.
Axis-Specific Grid Lines
Sometimes, you may want to add grid lines only for specific axes. Matplotlib provides methods to control how to add a grid on a figure for individual axes.
Adding Only Horizontal Grid Lines
To add only horizontal grid lines:
import matplotlib.pyplot as plt
import numpy as np

x = np.linspace(0, 10, 100)
y = x**2

plt.figure(figsize=(10, 6))
plt.plot(x, y, label='Quadratic')
plt.title('How to add a grid on a figure in Matplotlib - Horizontal Grid Only')
plt.xlabel('X-axis')
plt.ylabel('Y-axis')
plt.legend()
plt.grid(axis='y')
plt.text(5, 50, 'how2matplotlib.com', fontsize=12, alpha=0.5)
plt.show()
Output:
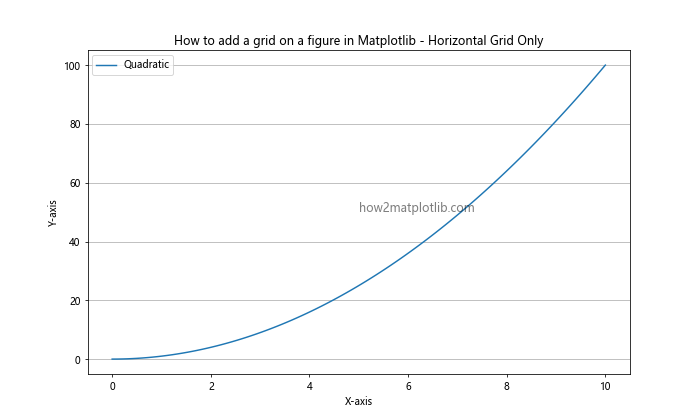
By specifying axis='y', we add grid lines only along the y-axis.
Adding Only Vertical Grid Lines
Similarly, for vertical grid lines only:
import matplotlib.pyplot as plt
import numpy as np

x = np.linspace(0, 10, 100)
y = x**3

plt.figure(figsize=(10, 6))
plt.plot(x, y, label='Cubic')
plt.title('How to add a grid on a figure in Matplotlib - Vertical Grid Only')
plt.xlabel('X-axis')
plt.ylabel('Y-axis')
plt.legend()
plt.grid(axis='x')
plt.text(5, 500, 'how2matplotlib.com', fontsize=12, alpha=0.5)
plt.show()
Output:
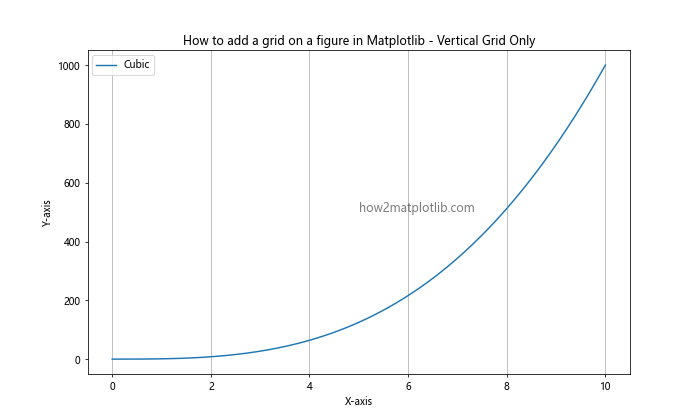
Here, axis='x' adds grid lines only along the x-axis.
Grid Customization for Multiple Subplots
When working with multiple subplots, you might want to customize how to add a grid on a figure in Matplotlib for each subplot individually. Let’s explore this with an example:
import matplotlib.pyplot as plt
import numpy as np

x = np.linspace(0, 10, 100)
y1 = np.sin(x)
y2 = np.cos(x)

fig, (ax1, ax2) = plt.subplots(2, 1, figsize=(10, 10))

ax1.plot(x, y1, label='Sine')
ax1.set_title('How to add a grid on a figure in Matplotlib - Subplot 1')
ax1.set_xlabel('X-axis')
ax1.set_ylabel('Y-axis')
ax1.legend()
ax1.grid(True, linestyle='--', color='gray', alpha=0.7)

ax2.plot(x, y2, label='Cosine')
ax2.set_title('How to add a grid on a figure in Matplotlib - Subplot 2')
ax2.set_xlabel('X-axis')
ax2.set_ylabel('Y-axis')
ax2.legend()
ax2.grid(True, linestyle=':', color='blue', alpha=0.5)

plt.tight_layout()
plt.text(5, 0, 'how2matplotlib.com', fontsize=12, alpha=0.5)
plt.show()
Output:
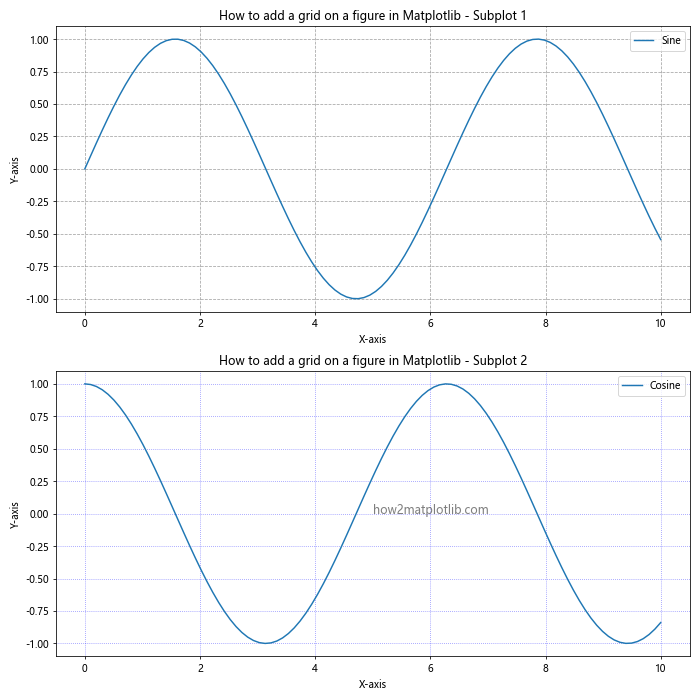
In this example, we create two subplots with different grid styles. The first subplot uses dashed gray lines, while the second uses dotted blue lines.
Using GridSpec for Complex Grid Layouts
For more complex layouts, Matplotlib’s GridSpec can be a powerful tool. Here’s an example of how to add a grid on a figure in Matplotlib using GridSpec:
import matplotlib.pyplot as plt
import matplotlib.gridspec as gridspec
import numpy as np

x = np.linspace(0, 10, 100)
y1 = np.sin(x)
y2 = np.cos(x)
y3 = np.tan(x)

fig = plt.figure(figsize=(12, 8))
gs = gridspec.GridSpec(2, 2)

ax1 = fig.add_subplot(gs[0, 0])
ax1.plot(x, y1)
ax1.set_title('Sine')
ax1.grid(True)

ax2 = fig.add_subplot(gs[0, 1])
ax2.plot(x, y2)
ax2.set_title('Cosine')
ax2.grid(True, linestyle='--')

ax3 = fig.add_subplot(gs[1, :])
ax3.plot(x, y3)
ax3.set_title('Tangent')
ax3.grid(True, color='red', alpha=0.3)

plt.tight_layout()
plt.text(5, 0, 'how2matplotlib.com', fontsize=12, alpha=0.5)
plt.show()
Output:
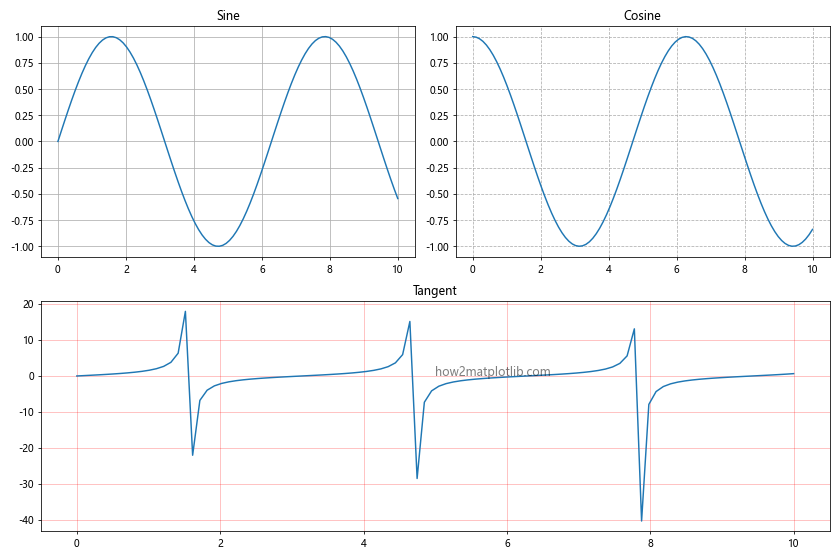
This example demonstrates how to create a layout with three subplots, each with its own grid style.
Polar Plots and Radial Grids
When working with polar plots, you might want to add radial grids. Here’s how to add a grid on a figure in Matplotlib for polar plots:
import matplotlib.pyplot as plt
import numpy as np

r = np.arange(0, 2, 0.01)
theta = 2 * np.pi * r

fig, ax = plt.subplots(subplot_kw=dict(projection='polar'))
ax.plot(theta, r)
ax.set_rticks([0.5, 1, 1.5, 2])
ax.grid(True)
ax.set_title('How to add a grid on a figure in Matplotlib - Polar Plot')
plt.text(0, 1, 'how2matplotlib.com', fontsize=12, alpha=0.5)
plt.show()
Output:
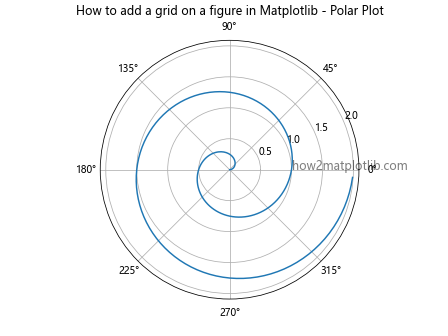
In this example, we create a polar plot and add a radial grid using the grid() method.
Customizing Grid for Logarithmic Scales
When dealing with logarithmic scales, you might need to adjust how to add a grid on a figure in Matplotlib. Here’s an example:
import matplotlib.pyplot as plt
import numpy as np

x = np.logspace(0, 5, 100)
y = x**2

plt.figure(figsize=(10, 6))
plt.loglog(x, y, label='y = x^2')
plt.title('How to add a grid on a figure in Matplotlib - Log Scale')
plt.xlabel('X-axis (log scale)')
plt.ylabel('Y-axis (log scale)')
plt.legend()
plt.grid(True, which="both", ls="-", alpha=0.5)
plt.text(10, 1e6, 'how2matplotlib.com', fontsize=12, alpha=0.5)
plt.show()
Output:
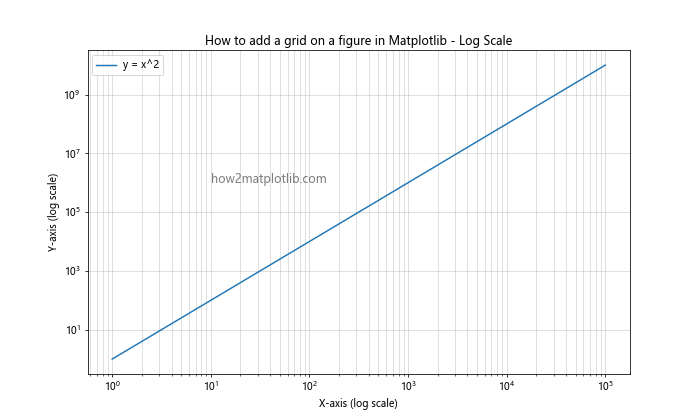
This example uses a logarithmic scale for both axes and adds a grid that matches the log scale ticks.
Adding Grids to 3D Plots
Matplotlib also supports adding grids to 3D plots. Here’s how to add a grid on a figure in Matplotlib for a 3D surface plot:
import matplotlib.pyplot as plt
import numpy as np
from mpl_toolkits.mplot3d import Axes3D

fig = plt.figure(figsize=(10, 8))
ax = fig.add_subplot(111, projection='3d')

x = np.arange(-5, 5, 0.25)
y = np.arange(-5, 5, 0.25)
X, Y = np.meshgrid(x, y)
Z = np.sin(np.sqrt(X**2 + Y**2))

surf = ax.plot_surface(X, Y, Z, cmap='viridis')
ax.set_title('How to add a grid on a figure in Matplotlib - 3D Plot')
ax.set_xlabel('X-axis')
ax.set_ylabel('Y-axis')
ax.set_zlabel('Z-axis')

ax.grid(True)
ax.text(-5, -5, 0, 'how2matplotlib.com', fontsize=12, alpha=0.5)
plt.show()
Output:
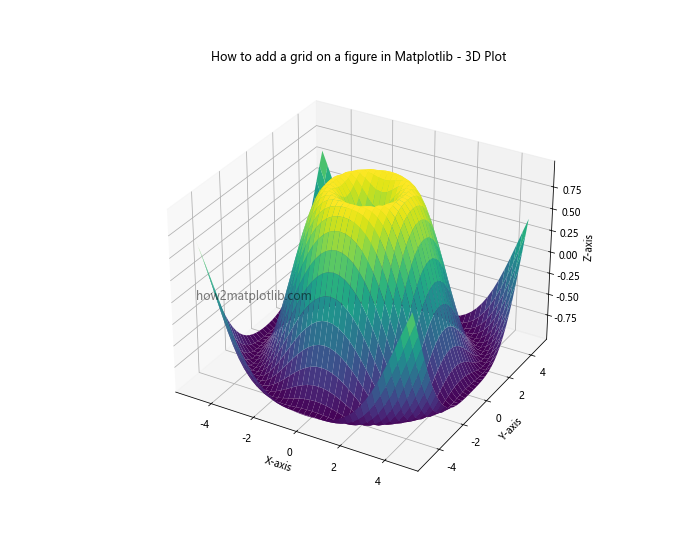
This example creates a 3D surface plot and adds a grid to all three axes.
Using Seaborn with Matplotlib for Styled Grids
Seaborn, a statistical data visualization library built on top of Matplotlib, provides some convenient functions for adding styled grids. Here’s how to use Seaborn to add a grid on a figure in Matplotlib:
import matplotlib.pyplot as plt
import seaborn as sns
import numpy as np

sns.set_style("whitegrid")

x= np.linspace(0, 10, 100)
y = np.sin(x) * np.exp(-0.1 * x)

plt.figure(figsize=(10, 6))
sns.lineplot(x=x, y=y)
plt.title('How to add a grid on a figure in Matplotlib - Seaborn Style')
plt.xlabel('X-axis')
plt.ylabel('Y-axis')
plt.text(5, 0.5, 'how2matplotlib.com', fontsize=12, alpha=0.5)
plt.show()
Output:
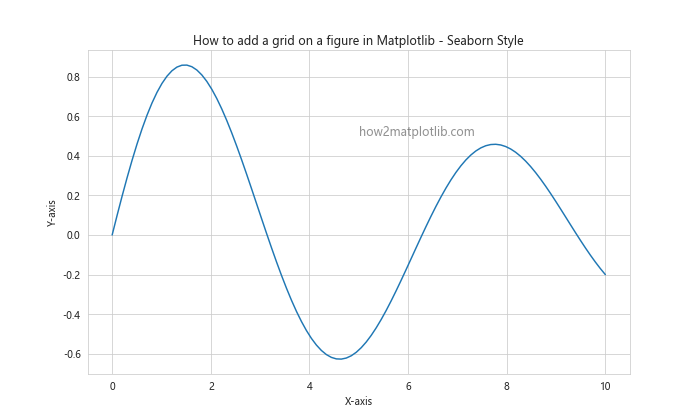
This example uses Seaborn’s set_style("whitegrid") to add a styled grid to the plot.
Advanced Grid Customization Techniques
For those looking to further refine how to add a grid on a figure in Matplotlib, here are some advanced techniques:
Using Tick Locators for Custom Grid Spacing
You can use Matplotlib’s tick locators to create custom grid spacing:
import matplotlib.pyplot as plt
import numpy as np
from matplotlib.ticker import MultipleLocator

x = np.linspace(0, 10, 100)
y = np.sin(x) * np.exp(-0.1 * x)

fig, ax = plt.subplots(figsize=(10, 6))
ax.plot(x, y)
ax.set_title('How to add a grid on a figure in Matplotlib - Custom Grid Spacing')
ax.set_xlabel('X-axis')
ax.set_ylabel('Y-axis')

ax.xaxis.set_major_locator(MultipleLocator(2))
ax.yaxis.set_major_locator(MultipleLocator(0.2))
ax.xaxis.set_minor_locator(MultipleLocator(0.5))
ax.yaxis.set_minor_locator(MultipleLocator(0.05))

ax.grid(which='major', color='#CCCCCC', linestyle='--')
ax.grid(which='minor', color='#CCCCCC', linestyle=':')

plt.text(5, 0.5, 'how2matplotlib.com', fontsize=12, alpha=0.5)
plt.show()
Output:
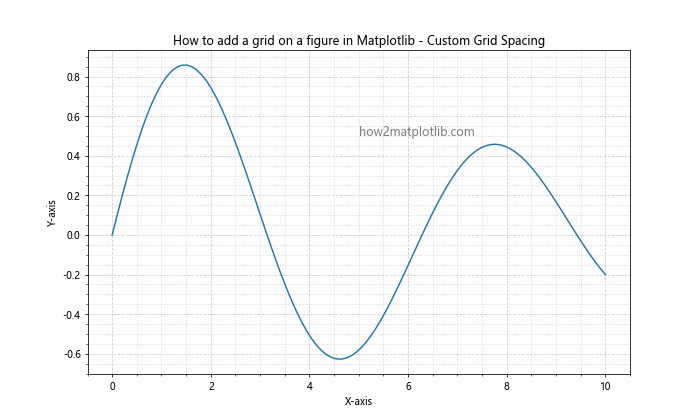
This example uses MultipleLocator to set custom major and minor tick locations, which in turn affects the grid spacing.
Creating a Grid with Curved Lines
For a unique look, you can create a grid with curved lines:
import matplotlib.pyplot as plt
import numpy as np

def curved_grid(ax, x_curve, y_curve, **kwargs):
    for x in np.arange(0, 1.1, 0.1):
        ax.plot(x_curve, x + y_curve, **kwargs)
    for y in np.arange(0, 1.1, 0.1):
        ax.plot(x_curve, y + y_curve, **kwargs)

fig, ax = plt.subplots(figsize=(10, 10))

x = np.linspace(0, 1, 100)
y_curve = 0.1 * np.sin(10 * np.pi * x)

curved_grid(ax, x, y_curve, color='gray', alpha=0.5, linestyle='--')

ax.set_xlim(0, 1)
ax.set_ylim(0, 1)
ax.set_title('How to add a grid on a figure in Matplotlib - Curved Grid')
ax.set_aspect('equal')

plt.text(0.5, 0.5, 'how2matplotlib.com', fontsize=12, alpha=0.5)
plt.show()
Output:
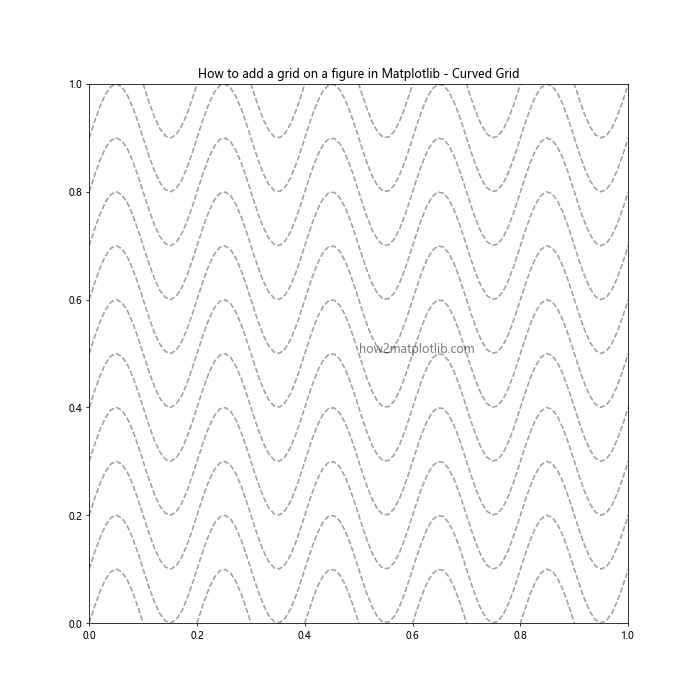
This example creates a custom function to draw a grid with curved lines, offering a unique visual effect.
Combining Different Grid Styles
You can combine different grid styles to create more complex and informative visualizations. Here’s an example of how to add a grid on a figure in Matplotlib using multiple styles:
import matplotlib.pyplot as plt
import numpy as np

x = np.linspace(0, 10, 100)
y1 = np.sin(x)
y2 = np.cos(x)

fig, ax = plt.subplots(figsize=(12, 6))

ax.plot(x, y1, label='Sine')
ax.plot(x, y2, label='Cosine')

ax.set_title('How to add a grid on a figure in Matplotlib - Combined Grid Styles')
ax.set_xlabel('X-axis')
ax.set_ylabel('Y-axis')

ax.grid(which='major', color='#CCCCCC', linestyle='--')
ax.grid(which='minor', color='#CCCCCC', linestyle=':')

ax.xaxis.set_major_locator(plt.MultipleLocator(1))
ax.xaxis.set_minor_locator(plt.MultipleLocator(0.2))
ax.yaxis.set_major_locator(plt.MultipleLocator(0.5))
ax.yaxis.set_minor_locator(plt.MultipleLocator(0.1))

ax.axhline(y=0, color='k', linestyle='-', linewidth=1)
ax.axvline(x=5, color='r', linestyle='--', linewidth=1)

ax.legend()
plt.text(5, 0.5, 'how2matplotlib.com', fontsize=12, alpha=0.5)
plt.show()
Output:
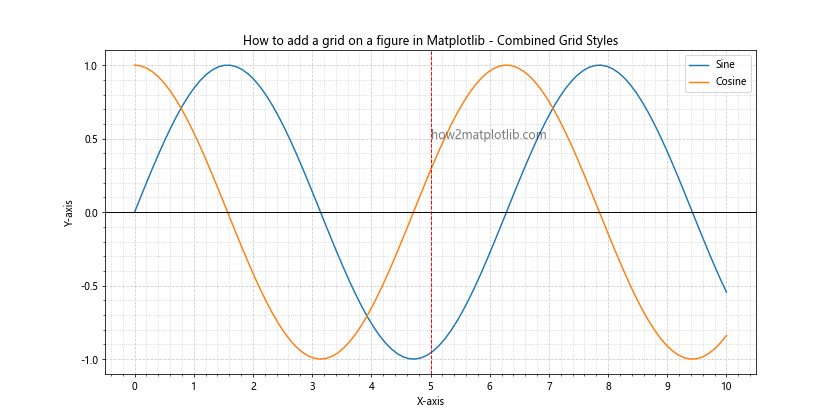
This example combines major and minor grids with different styles, adds custom tick locations, and includes horizontal and vertical lines for additional reference.
Grid Customization for Specific Data Types
Different types of data may require specific grid customizations. Let’s explore how to add a grid on a figure in Matplotlib for various data types:
Categorical Data
For categorical data, you might want to add grid lines between categories:
import matplotlib.pyplot as plt
import numpy as np

categories = ['A', 'B', 'C', 'D', 'E']
values = np.random.rand(5)

fig, ax = plt.subplots(figsize=(10, 6))
ax.bar(categories, values)

ax.set_title('How to add a grid on a figure in Matplotlib - Categorical Grid')
ax.set_xlabel('Categories')
ax.set_ylabel('Values')

ax.grid(True, axis='y', linestyle='--', alpha=0.7)
ax.set_axisbelow(True)

plt.text(2, 0.5, 'how2matplotlib.com', fontsize=12, alpha=0.5)
plt.show()
Output:
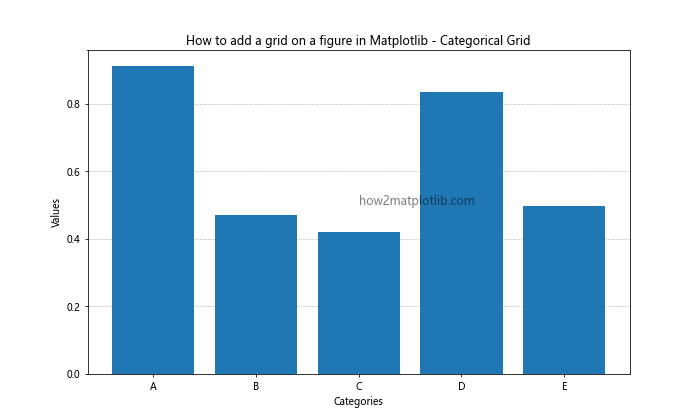
This example adds horizontal grid lines to a bar plot with categorical data.
Grid Customization for Different Plot Types
Different types of plots may require specific approaches to how to add a grid on a figure in Matplotlib. Let’s explore some examples:
Scatter Plots
For scatter plots, you might want to add a grid that helps identify clusters:
import matplotlib.pyplot as plt
import numpy as np

x = np.random.randn(100)
y = np.random.randn(100)

fig, ax = plt.subplots(figsize=(10, 10))
ax.scatter(x, y, alpha=0.5)

ax.set_title('How to add a grid on a figure in Matplotlib - Scatter Plot Grid')
ax.set_xlabel('X-axis')
ax.set_ylabel('Y-axis')

ax.grid(True, linestyle='--', alpha=0.7)
ax.set_axisbelow(True)

plt.text(0, 0, 'how2matplotlib.com', fontsize=12, alpha=0.5)
plt.show()
Output:
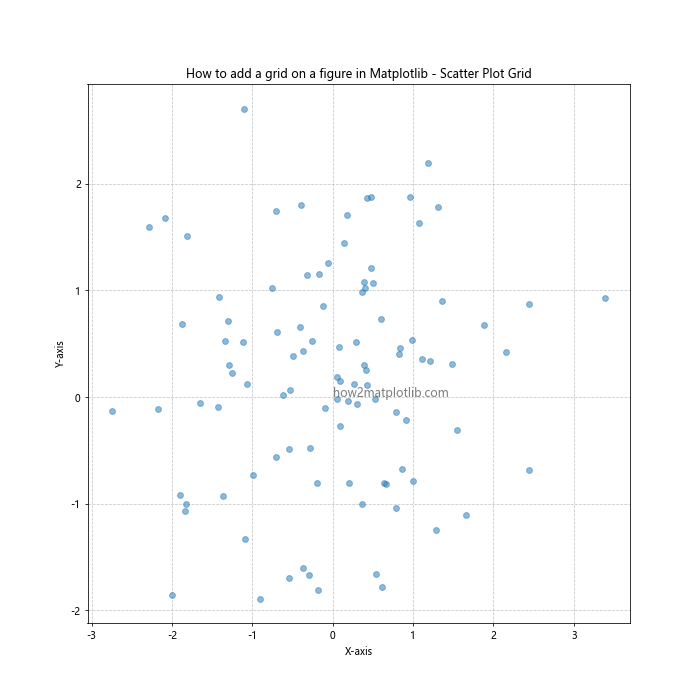
This example adds a grid to a scatter plot, which can help in identifying patterns or clusters in the data.
Heatmaps
For heatmaps, you might want to add grid lines to separate cells:
import matplotlib.pyplot as plt
import numpy as np

data = np.random.rand(10, 10)

fig, ax = plt.subplots(figsize=(10, 8))
im = ax.imshow(data, cmap='viridis')

ax.set_title('How to add a grid on a figure in Matplotlib - Heatmap Grid')
ax.set_xticks(np.arange(-.5, 10, 1), minor=True)
ax.set_yticks(np.arange(-.5, 10, 1), minor=True)
ax.grid(which="minor", color="w", linestyle='-', linewidth=2)
ax.tick_params(which="minor", bottom=False, left=False)

plt.colorbar(im)
plt.text(5, 5, 'how2matplotlib.com', fontsize=12, color='white', alpha=0.5)
plt.show()
Output:
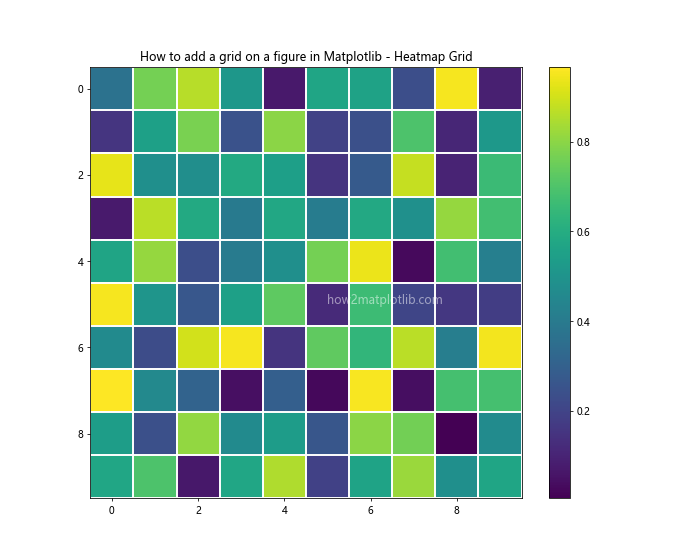
This example adds a grid to a heatmap, separating each cell for better visibility.
Conclusion
In this comprehensive guide, we’ve explored numerous ways to add a grid on a figure in Matplotlib. From basic grid addition to advanced customization techniques, we’ve covered a wide range of options to enhance your data visualizations. Remember that the key to effective data visualization is not just knowing how to add a grid, but understanding when and where to use it to best highlight your data.
Experiment with these techniques and combine them as needed to create informative and visually appealing plots. Whether you’re working with simple line plots, complex 3D visualizations, or specialized data types, Matplotlib provides the tools you need to add grids that enhance your data presentation.