Comprehensive Guide to Using Matplotlib.axis.Tick.get_alpha() in Python
Matplotlib.axis.Tick.get_alpha() in Python is a powerful method used in the Matplotlib library for retrieving the alpha (transparency) value of tick marks on plot axes. This function is essential for data visualization tasks, allowing developers to inspect and manipulate the appearance of tick marks in their plots. In this comprehensive guide, we’ll explore the various aspects of Matplotlib.axis.Tick.get_alpha() in Python, providing detailed explanations and practical examples to help you master this feature.
Understanding Matplotlib.axis.Tick.get_alpha() in Python
Matplotlib.axis.Tick.get_alpha() in Python is a method that belongs to the Tick class in Matplotlib’s axis module. It is used to retrieve the alpha value of a tick mark, which determines its transparency. The alpha value ranges from 0 (completely transparent) to 1 (completely opaque). By using Matplotlib.axis.Tick.get_alpha() in Python, you can inspect the current transparency of tick marks and make informed decisions about adjusting their appearance.
Let’s start with a simple example to demonstrate how to use Matplotlib.axis.Tick.get_alpha() in Python:
import matplotlib.pyplot as plt

# Create a simple plot
fig, ax = plt.subplots()
ax.plot([1, 2, 3, 4], [1, 4, 2, 3], label='Data from how2matplotlib.com')

# Get the first major tick on the x-axis
tick = ax.xaxis.get_major_ticks()[0]

# Get the alpha value of the tick
alpha = tick.get_alpha()

print(f"Alpha value of the tick: {alpha}")

plt.title("Using Matplotlib.axis.Tick.get_alpha() in Python")
plt.legend()
plt.show()
Output:
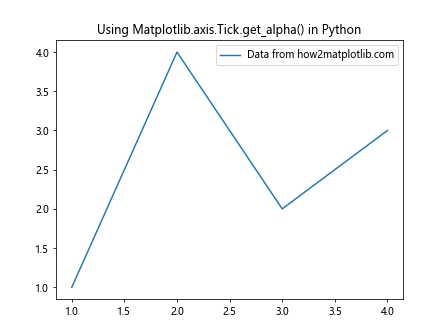
In this example, we create a simple plot and then retrieve the first major tick on the x-axis. We use Matplotlib.axis.Tick.get_alpha() in Python to get the alpha value of this tick and print it. This demonstrates the basic usage of the method.
Practical Applications of Matplotlib.axis.Tick.get_alpha() in Python
Matplotlib.axis.Tick.get_alpha() in Python can be particularly useful when you want to create dynamic visualizations or when you need to adjust tick transparency based on certain conditions. Let’s explore some practical applications:
1. Conditional Tick Transparency
In this example, we’ll use Matplotlib.axis.Tick.get_alpha() in Python to check the current alpha value and adjust it based on a condition:
import matplotlib.pyplot as plt

fig, ax = plt.subplots()
ax.plot([1, 2, 3, 4], [1, 4, 2, 3], label='Data from how2matplotlib.com')

for tick in ax.xaxis.get_major_ticks():
    current_alpha = tick.get_alpha()
    if current_alpha is None or current_alpha > 0.5:
        tick.set_alpha(0.3)

plt.title("Conditional Tick Transparency with Matplotlib.axis.Tick.get_alpha()")
plt.legend()
plt.show()
Output:
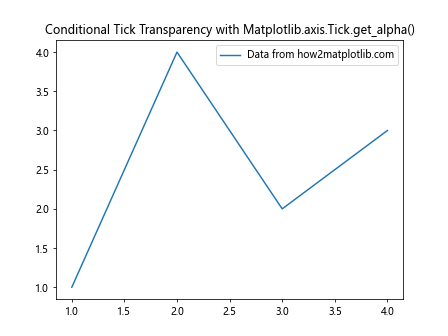
In this example, we iterate through all major ticks on the x-axis. We use Matplotlib.axis.Tick.get_alpha() in Python to check the current alpha value. If it’s None (default) or greater than 0.5, we set it to 0.3, creating a conditional transparency effect.
2. Gradual Tick Transparency
Here’s an example where we use Matplotlib.axis.Tick.get_alpha() in Python to create a gradual transparency effect on ticks:
import matplotlib.pyplot as plt
import numpy as np

fig, ax = plt.subplots()
x = np.linspace(0, 10, 100)
ax.plot(x, np.sin(x), label='Data from how2matplotlib.com')

ticks = ax.xaxis.get_major_ticks()
for i, tick in enumerate(ticks):
    alpha = tick.get_alpha()
    if alpha is None:
        alpha = 1.0
    new_alpha = alpha * (1 - i / len(ticks))
    tick.set_alpha(new_alpha)

plt.title("Gradual Tick Transparency with Matplotlib.axis.Tick.get_alpha()")
plt.legend()
plt.show()
Output:
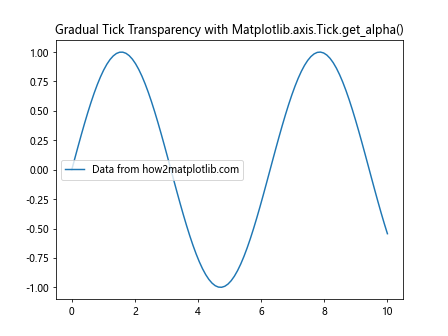
In this example, we create a sine wave plot and then apply a gradual transparency effect to the x-axis ticks. We use Matplotlib.axis.Tick.get_alpha() in Python to get the current alpha value for each tick, then calculate a new alpha value that decreases gradually for each tick.
Advanced Usage of Matplotlib.axis.Tick.get_alpha() in Python
Matplotlib.axis.Tick.get_alpha() in Python can be combined with other Matplotlib features to create more complex and informative visualizations. Let’s explore some advanced usage scenarios:
1. Combining with Custom Tick Formatters
In this example, we’ll use Matplotlib.axis.Tick.get_alpha() in Python along with a custom tick formatter:
import matplotlib.pyplot as plt
import matplotlib.ticker as ticker

def custom_formatter(x, pos):
    tick = ax.xaxis.get_major_ticks()[pos]
    alpha = tick.get_alpha()
    return f"{x:.1f}\n(α={alpha:.2f})"

fig, ax = plt.subplots()
ax.plot([1, 2, 3, 4], [1, 4, 2, 3], label='Data from how2matplotlib.com')

ax.xaxis.set_major_formatter(ticker.FuncFormatter(custom_formatter))

for tick in ax.xaxis.get_major_ticks():
    tick.set_alpha(0.5)

plt.title("Custom Tick Formatter with Matplotlib.axis.Tick.get_alpha()")
plt.legend()
plt.show()
Output:
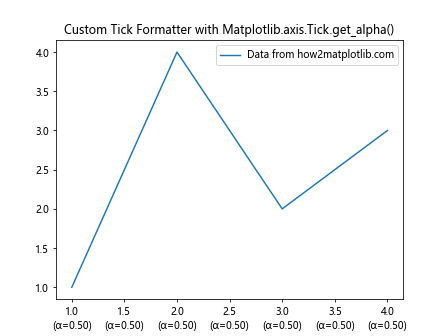
In this advanced example, we create a custom tick formatter that displays both the tick value and its alpha value. We use Matplotlib.axis.Tick.get_alpha() in Python within the formatter to retrieve the alpha value for each tick.
2. Dynamic Tick Transparency Based on Data
Here’s an example where we adjust tick transparency based on the data values:
import matplotlib.pyplot as plt
import numpy as np

fig, ax = plt.subplots()
x = np.linspace(0, 10, 100)
y = np.sin(x)
ax.plot(x, y, label='Data from how2matplotlib.com')

ticks = ax.xaxis.get_major_ticks()
for tick in ticks:
    pos = tick.get_loc()
    if 0 <= pos < len(y):
        value = abs(y[int(pos)])
        alpha = tick.get_alpha()
        if alpha is None:
            alpha = 1.0
        new_alpha = alpha * value
        tick.set_alpha(new_alpha)

plt.title("Dynamic Tick Transparency with Matplotlib.axis.Tick.get_alpha()")
plt.legend()
plt.show()
Output:
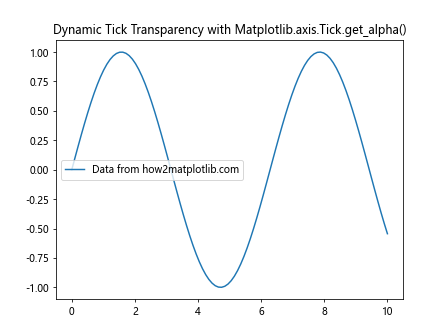
In this advanced example, we adjust the transparency of each tick based on the corresponding y-value in our data. We use Matplotlib.axis.Tick.get_alpha() in Python to get the current alpha value, then modify it based on the absolute value of the corresponding data point.
Best Practices for Using Matplotlib.axis.Tick.get_alpha() in Python
When working with Matplotlib.axis.Tick.get_alpha() in Python, it's important to follow some best practices to ensure your visualizations are effective and your code is maintainable. Here are some tips:
- Always check for None: Matplotlib.axis.Tick.get_alpha() in Python may return None if the alpha value hasn't been explicitly set. Always check for this case and provide a default value if needed.
Use in combination with set_alpha(): While Matplotlib.axis.Tick.get_alpha() in Python retrieves the alpha value, you'll often want to use it in combination with set_alpha() to adjust the transparency.
Consider both axes: Remember that Matplotlib.axis.Tick.get_alpha() in Python can be used for both x and y axes. Consider the transparency of ticks on both axes for a consistent look.
Be mindful of readability: While adjusting tick transparency can enhance your plots, make sure it doesn't compromise the readability of your axis labels.
Let's see an example that incorporates these best practices: