How to Change Matplotlib Line Style in Mid-Graph
Change matplotlib line style in mid-graph is a powerful technique that allows you to create visually appealing and informative plots. This article will explore various methods and techniques to change matplotlib line style in mid-graph, providing you with the knowledge and tools to enhance your data visualization skills. We’ll cover everything from basic concepts to advanced techniques, complete with easy-to-understand code examples.
Understanding the Basics of Changing Matplotlib Line Style in Mid-Graph
Before we dive into the specifics of how to change matplotlib line style in mid-graph, it’s essential to understand the fundamentals. Matplotlib is a popular Python library for creating static, animated, and interactive visualizations. One of its key features is the ability to customize line styles, which can be particularly useful when you want to highlight different segments of a graph or represent different data characteristics.
To change matplotlib line style in mid-graph, you’ll need to work with the Line2D objects that make up your plot. These objects have various properties that can be modified, including the line style. Let’s start with a simple example to illustrate this concept:
import matplotlib.pyplot as plt
import numpy as np

x = np.linspace(0, 10, 100)
y = np.sin(x)

fig, ax = plt.subplots()
line, = ax.plot(x, y, label='how2matplotlib.com')

# Change line style in mid-graph
line.set_linestyle('--')
line.set_xdata(x[50:])
line.set_ydata(y[50:])

ax.set_title('Change matplotlib line style in mid-graph')
ax.legend()
plt.show()
Output:
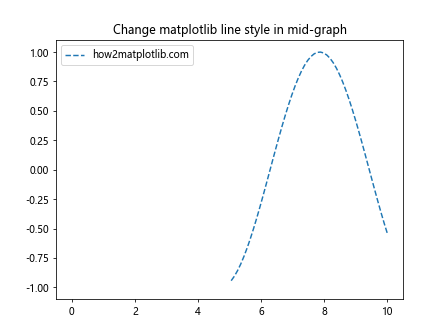
In this example, we create a simple sine wave plot and then change the line style to dashed for the second half of the graph. This demonstrates the basic principle of how to change matplotlib line style in mid-graph.
Methods to Change Matplotlib Line Style in Mid-Graph
There are several methods you can use to change matplotlib line style in mid-graph. Let’s explore some of the most common and effective techniques.
1. Using Multiple Line Segments
One straightforward way to change matplotlib line style in mid-graph is to plot multiple line segments with different styles. Here’s an example:
import matplotlib.pyplot as plt
import numpy as np

x = np.linspace(0, 10, 100)
y = np.sin(x)

fig, ax = plt.subplots()
ax.plot(x[:50], y[:50], 'b-', label='Solid - how2matplotlib.com')
ax.plot(x[49:], y[49:], 'r--', label='Dashed - how2matplotlib.com')

ax.set_title('Change matplotlib line style in mid-graph')
ax.legend()
plt.show()
Output:
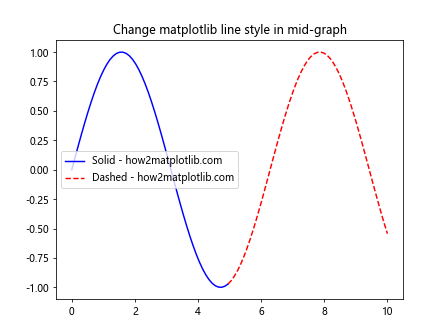
This method allows you to change matplotlib line style in mid-graph by creating two separate line segments with different styles.
2. Using LineCollection
For more complex scenarios where you need to change matplotlib line style in mid-graph multiple times, using LineCollection can be an efficient approach:
import matplotlib.pyplot as plt
import numpy as np
from matplotlib.collections import LineCollection

x = np.linspace(0, 10, 100)
y = np.sin(x)

points = np.array([x, y]).T.reshape(-1, 1, 2)
segments = np.concatenate([points[:-1], points[1:]], axis=1)

styles = ['-', '--', '-.', ':'] * 25  # Repeat styles as needed
lc = LineCollection(segments, linestyles=styles, label='how2matplotlib.com')

fig, ax = plt.subplots()
ax.add_collection(lc)
ax.autoscale()
ax.set_title('Change matplotlib line style in mid-graph')
plt.legend()
plt.show()
Output:
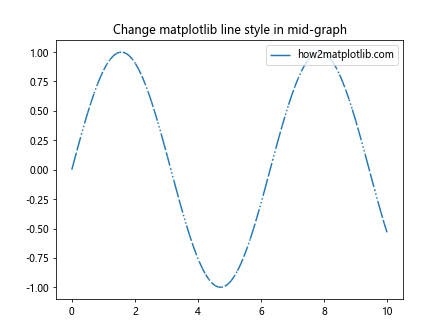
This example demonstrates how to change matplotlib line style in mid-graph multiple times using LineCollection.
3. Using set_dashes() Method
Another way to change matplotlib line style in mid-graph is by using the set_dashes() method. This allows for fine-grained control over the dash pattern:
import matplotlib.pyplot as plt
import numpy as np

x = np.linspace(0, 10, 100)
y = np.sin(x)

fig, ax = plt.subplots()
line, = ax.plot(x, y, label='how2matplotlib.com')

# Change line style in mid-graph
line.set_dashes([5, 2, 1, 2])  # 5 points on, 2 off, 1 on, 2 off

ax.set_title('Change matplotlib line style in mid-graph')
ax.legend()
plt.show()
Output:
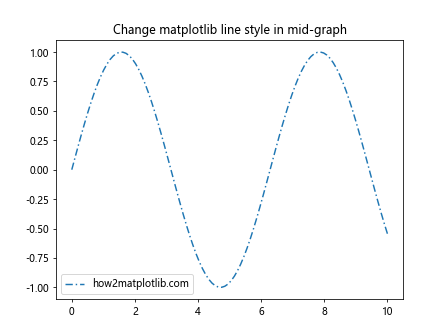
This method provides a way to create custom dash patterns when you change matplotlib line style in mid-graph.
Advanced Techniques to Change Matplotlib Line Style in Mid-Graph
Now that we’ve covered the basics, let’s explore some more advanced techniques to change matplotlib line style in mid-graph.
1. Dynamic Line Style Changes
You can create dynamic line style changes based on data values. This is particularly useful when you want to change matplotlib line style in mid-graph based on certain conditions:
import matplotlib.pyplot as plt
import numpy as np

x = np.linspace(0, 10, 100)
y = np.sin(x)

fig, ax = plt.subplots()

for i in range(len(x) - 1):
    if y[i] >= 0:
        ax.plot(x[i:i+2], y[i:i+2], 'b-', label='Positive - how2matplotlib.com' if i == 0 else "")
    else:
        ax.plot(x[i:i+2], y[i:i+2], 'r--', label='Negative - how2matplotlib.com' if i == 0 else "")

ax.set_title('Change matplotlib line style in mid-graph')
ax.legend()
plt.show()
Output:
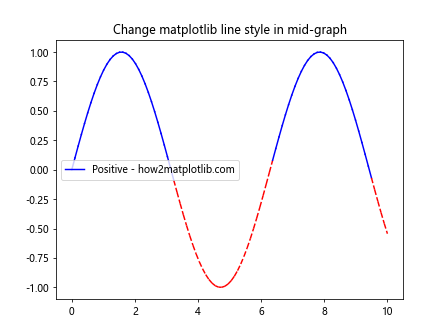
This example shows how to change matplotlib line style in mid-graph based on whether the y-value is positive or negative.
2. Using Custom Line Styles
Matplotlib allows you to define custom line styles, which can be useful when you want to change matplotlib line style in mid-graph with unique patterns:
import matplotlib.pyplot as plt
import numpy as np

x = np.linspace(0, 10, 100)
y = np.sin(x)

fig, ax = plt.subplots()

custom_style1 = (0, (5, 1))  # 5 points on, 1 off
custom_style2 = (0, (3, 1, 1, 1))  # 3 on, 1 off, 1 on, 1 off

ax.plot(x[:50], y[:50], linestyle=custom_style1, label='Custom 1 - how2matplotlib.com')
ax.plot(x[49:], y[49:], linestyle=custom_style2, label='Custom 2 - how2matplotlib.com')

ax.set_title('Change matplotlib line style in mid-graph')
ax.legend()
plt.show()
Output:
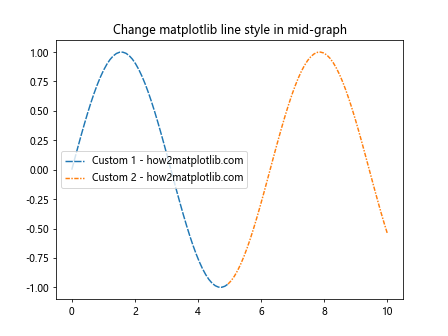
This example demonstrates how to change matplotlib line style in mid-graph using custom-defined line styles.
3. Combining Line Styles with Colors and Markers
To create even more distinctive visualizations, you can combine different line styles with colors and markers when you change matplotlib line style in mid-graph:
import matplotlib.pyplot as plt
import numpy as np

x = np.linspace(0, 10, 100)
y = np.sin(x)

fig, ax = plt.subplots()

ax.plot(x[:33], y[:33], 'b-o', label='Blue Solid - how2matplotlib.com')
ax.plot(x[32:66], y[32:66], 'r--s', label='Red Dashed - how2matplotlib.com')
ax.plot(x[65:], y[65:], 'g-.^', label='Green Dash-Dot - how2matplotlib.com')

ax.set_title('Change matplotlib line style in mid-graph')
ax.legend()
plt.show()
Output:
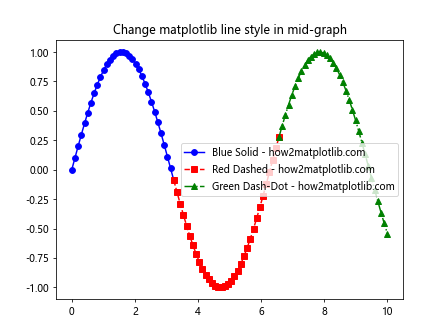
This example shows how to change matplotlib line style in mid-graph while also varying colors and markers for added visual distinction.
Practical Applications of Changing Matplotlib Line Style in Mid-Graph
Understanding how to change matplotlib line style in mid-graph is not just a technical exercise; it has practical applications in various fields. Let’s explore some scenarios where this technique can be particularly useful.
1. Highlighting Data Trends
When analyzing time series data, you might want to change matplotlib line style in mid-graph to highlight different trends or periods:
import matplotlib.pyplot as plt
import numpy as np

np.random.seed(42)
x = np.arange(100)
y = np.cumsum(np.random.randn(100))

fig, ax = plt.subplots()

ax.plot(x[:50], y[:50], 'b-', label='Normal Trend - how2matplotlib.com')
ax.plot(x[49:], y[49:], 'r--', label='Anomaly - how2matplotlib.com')

ax.set_title('Change matplotlib line style in mid-graph to highlight trends')
ax.legend()
plt.show()
Output:
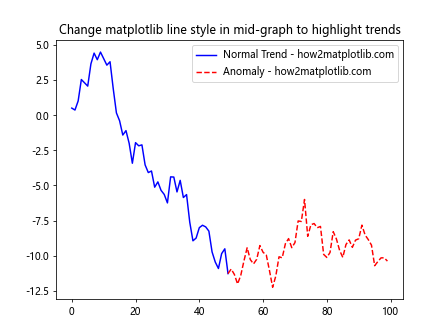
In this example, we change matplotlib line style in mid-graph to differentiate between normal trends and anomalies in the data.
2. Representing Different Data Sources
When combining data from multiple sources, you can change matplotlib line style in mid-graph to visually distinguish between them:
import matplotlib.pyplot as plt
import numpy as np

x = np.linspace(0, 10, 100)
y1 = np.sin(x)
y2 = np.cos(x)

fig, ax = plt.subplots()

ax.plot(x, y1, 'b-', label='Source 1 - how2matplotlib.com')
ax.plot(x, y2, 'r--', label='Source 2 - how2matplotlib.com')

ax.set_title('Change matplotlib line style in mid-graph for different sources')
ax.legend()
plt.show()
Output:
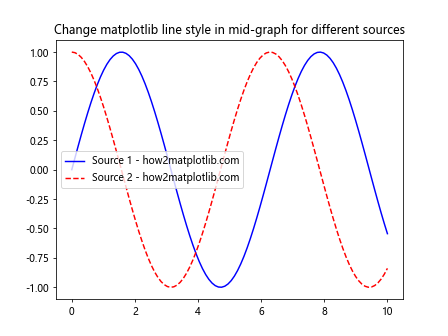
This example demonstrates how to change matplotlib line style in mid-graph to represent data from different sources.
3. Indicating Data Quality or Confidence
You can change matplotlib line style in mid-graph to indicate varying levels of data quality or confidence:
import matplotlib.pyplot as plt
import numpy as np

x = np.linspace(0, 10, 100)
y = np.sin(x)
confidence = np.random.rand(100)

fig, ax = plt.subplots()

for i in range(len(x) - 1):
    if confidence[i] > 0.7:
        ax.plot(x[i:i+2], y[i:i+2], 'b-', label='High Confidence - how2matplotlib.com' if i == 0 else "")
    elif confidence[i] > 0.3:
        ax.plot(x[i:i+2], y[i:i+2], 'g--', label='Medium Confidence - how2matplotlib.com' if i == 0 else "")
    else:
        ax.plot(x[i:i+2], y[i:i+2], 'r:', label='Low Confidence - how2matplotlib.com' if i == 0 else "")

ax.set_title('Change matplotlib line style in mid-graph to indicate confidence')
ax.legend()
plt.show()
Output:
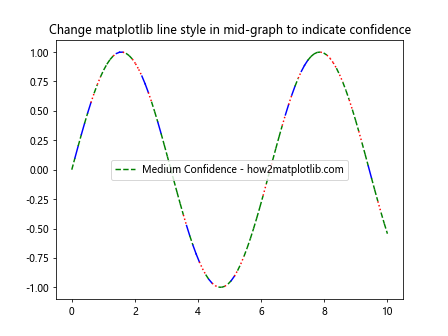
This example shows how to change matplotlib line style in mid-graph to represent different levels of data confidence.
Best Practices for Changing Matplotlib Line Style in Mid-Graph
While knowing how to change matplotlib line style in mid-graph is important, it’s equally crucial to understand when and how to use this technique effectively. Here are some best practices to keep in mind:
- Consistency: When you change matplotlib line style in mid-graph, ensure that the changes are consistent and meaningful. Don’t change styles arbitrarily, as this can confuse the viewer.
Legend: Always include a legend when you change matplotlib line style in mid-graph to explain what each style represents.
Color-blindness considerations: When you change matplotlib line style in mid-graph, consider using both color and style changes to ensure your visualizations are accessible to color-blind individuals.
Avoid clutter: While it can be tempting to use many different styles, too many changes can make your graph cluttered and hard to read. Use changes sparingly and purposefully.
Documentation: If you’re creating plots for others to use or interpret, provide clear documentation on why and where you change matplotlib line style in mid-graph.
Let’s look at an example that incorporates these best practices: