How to Change the Error Bar Thickness in Matplotlib
Change the error bar thickness in Matplotlib is an essential skill for data visualization enthusiasts and professionals alike. This article will delve deep into the various methods and techniques to change the error bar thickness in Matplotlib, providing you with a thorough understanding of this crucial aspect of data representation. We’ll explore different approaches, discuss best practices, and provide numerous examples to help you master the art of customizing error bar thickness in your Matplotlib plots.
Understanding Error Bars in Matplotlib
Before we dive into changing the error bar thickness in Matplotlib, let’s first understand what error bars are and why they’re important. Error bars are graphical representations of the variability of data and are used on graphs to indicate the error or uncertainty in a reported measurement. They give a general idea of how accurate a measurement is, or conversely, how far from the reported value the true value might be.
In Matplotlib, error bars are typically added to plots using the errorbar() function. This function allows you to specify the data points, their corresponding error values, and various styling options, including the thickness of the error bars.
Let’s start with a basic example of how to create a plot with error bars:
import matplotlib.pyplot as plt
import numpy as np

# Data for plotting
x = np.linspace(0, 10, 50)
y = np.sin(x)
yerr = 0.1 + 0.2 * np.random.rand(len(x))

# Create the plot
plt.figure(figsize=(10, 6))
plt.errorbar(x, y, yerr=yerr, fmt='o', label='Data')
plt.title('Basic Error Bar Plot - how2matplotlib.com')
plt.xlabel('X-axis')
plt.ylabel('Y-axis')
plt.legend()
plt.show()
Output:
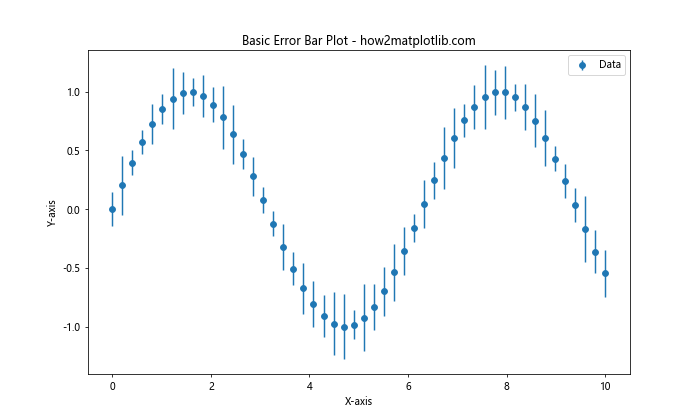
In this example, we create a simple sine wave plot with error bars. The error values are randomly generated for demonstration purposes. The errorbar() function is used to create the plot with error bars.
Changing Error Bar Thickness Using the elinewidth Parameter
One of the simplest ways to change the error bar thickness in Matplotlib is by using the elinewidth parameter in the errorbar() function. This parameter controls the width of the error bar lines.
Here’s an example of how to use the elinewidth parameter:
import matplotlib.pyplot as plt
import numpy as np

# Data for plotting
x = np.linspace(0, 10, 20)
y = np.exp(-x/10)
yerr = 0.1 + 0.2 * np.random.rand(len(x))

# Create the plot with thicker error bars
plt.figure(figsize=(10, 6))
plt.errorbar(x, y, yerr=yerr, fmt='o', elinewidth=3, capsize=5, label='Data')
plt.title('Error Bar Plot with Increased Thickness - how2matplotlib.com')
plt.xlabel('X-axis')
plt.ylabel('Y-axis')
plt.legend()
plt.show()
Output:
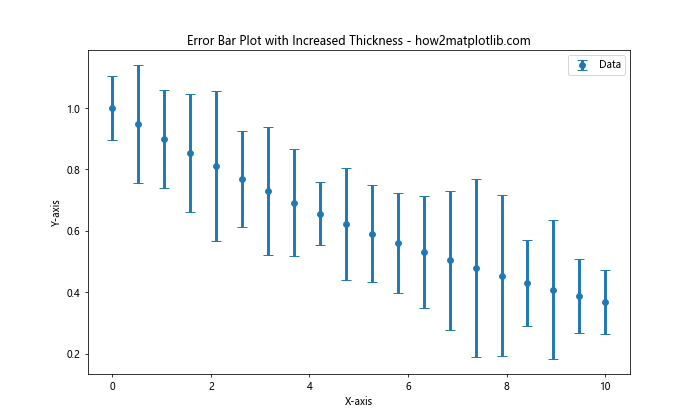
In this example, we set elinewidth=3 to increase the thickness of the error bars. The capsize parameter is also used to add caps to the ends of the error bars for better visibility.
Adjusting Error Bar Thickness for Different Components
When you change the error bar thickness in Matplotlib, you might want to adjust the thickness of different components of the error bars separately. The error bars consist of three main parts: the vertical lines, the horizontal caps, and the data points. Let’s see how we can customize each of these components:
import matplotlib.pyplot as plt
import numpy as np

# Data for plotting
x = np.linspace(0, 10, 15)
y = np.cos(x)
yerr = 0.2 + 0.1 * np.random.rand(len(x))

# Create the plot with customized error bar components
plt.figure(figsize=(10, 6))
plt.errorbar(x, y, yerr=yerr, fmt='o',
             elinewidth=3,  # Thickness of vertical lines
             capsize=8,     # Size of caps
             capthick=2,    # Thickness of caps
             markeredgewidth=2,  # Thickness of marker edge
             markersize=8)  # Size of markers
plt.title('Customized Error Bar Components - how2matplotlib.com')
plt.xlabel('X-axis')
plt.ylabel('Y-axis')
plt.show()
Output:
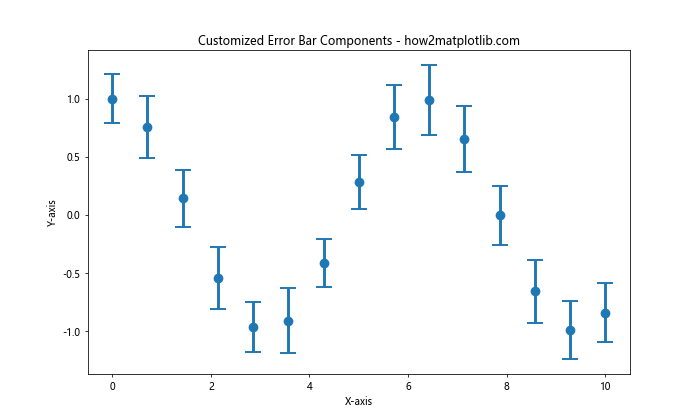
In this example, we’ve used several parameters to customize different aspects of the error bars:
elinewidth: Controls the thickness of the vertical error bar linescapsize: Sets the size of the horizontal capscapthick: Adjusts the thickness of the capsmarkeredgewidth: Changes the thickness of the marker edgemarkersize: Sets the size of the markers
By adjusting these parameters, you can create error bars with different thicknesses for each component, allowing for more detailed and visually appealing plots.
Using Style Dictionaries to Change Error Bar Thickness
Another approach to change the error bar thickness in Matplotlib is by using style dictionaries. This method allows you to define a set of style properties that can be applied to the error bars. Here’s an example:
import matplotlib.pyplot as plt
import numpy as np

# Data for plotting
x = np.linspace(0, 10, 25)
y = np.sin(x) * np.exp(-x/10)
yerr = 0.15 + 0.1 * np.random.rand(len(x))

# Define error bar style
error_bar_style = {
    'ecolor': 'red',
    'elinewidth': 2.5,
    'capsize': 6,
    'capthick': 2
}

# Create the plot with styled error bars
plt.figure(figsize=(10, 6))
plt.errorbar(x, y, yerr=yerr, fmt='o', **error_bar_style)
plt.title('Error Bars with Style Dictionary - how2matplotlib.com')
plt.xlabel('X-axis')
plt.ylabel('Y-axis')
plt.show()
Output:
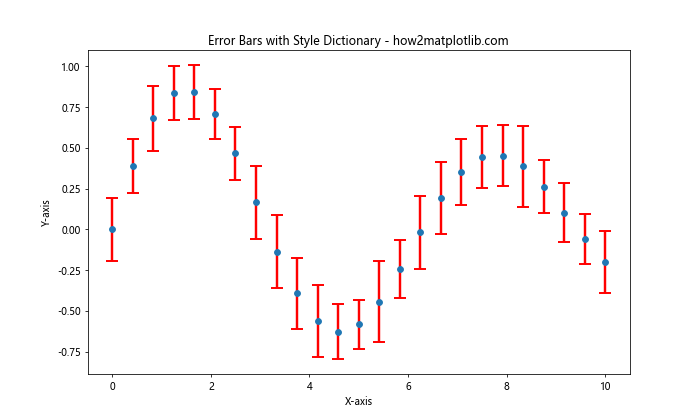
In this example, we define an error_bar_style dictionary that contains various style properties for the error bars, including the elinewidth for thickness. We then pass this dictionary to the errorbar() function using the ** operator to unpack the dictionary as keyword arguments.
This approach is particularly useful when you want to apply consistent styling across multiple plots or when you need to change multiple properties of the error bars at once.
Changing Error Bar Thickness for Multiple Datasets
When working with multiple datasets in a single plot, you might want to change the error bar thickness differently for each dataset. This can help distinguish between different series of data. Here’s an example of how to achieve this:
import matplotlib.pyplot as plt
import numpy as np

# Data for plotting
x = np.linspace(0, 10, 30)
y1 = np.sin(x)
y2 = np.cos(x)
yerr1 = 0.1 + 0.1 * np.random.rand(len(x))
yerr2 = 0.2 + 0.1 * np.random.rand(len(x))

# Create the plot with different error bar thicknesses
plt.figure(figsize=(10, 6))
plt.errorbar(x, y1, yerr=yerr1, fmt='o', elinewidth=1, capsize=4, label='Dataset 1')
plt.errorbar(x, y2, yerr=yerr2, fmt='s', elinewidth=3, capsize=6, label='Dataset 2')
plt.title('Multiple Datasets with Different Error Bar Thicknesses - how2matplotlib.com')
plt.xlabel('X-axis')
plt.ylabel('Y-axis')
plt.legend()
plt.show()
Output:
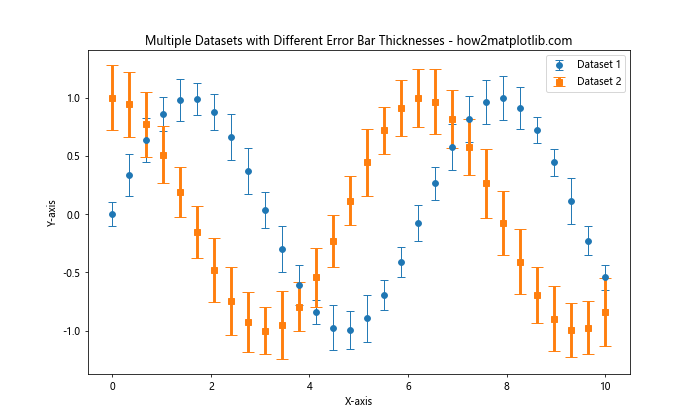
In this example, we plot two datasets with different error bar thicknesses. The first dataset uses elinewidth=1, while the second uses elinewidth=3. This visual distinction helps to differentiate between the two datasets easily.
Adjusting Error Bar Thickness in Subplots
When working with subplots in Matplotlib, you might need to change the error bar thickness for each subplot individually. Here’s an example of how to do this:
import matplotlib.pyplot as plt
import numpy as np

# Data for plotting
x = np.linspace(0, 10, 20)
y1 = np.sin(x)
y2 = np.cos(x)
yerr1 = 0.1 + 0.1 * np.random.rand(len(x))
yerr2 = 0.2 + 0.1 * np.random.rand(len(x))

# Create subplots with different error bar thicknesses
fig, (ax1, ax2) = plt.subplots(1, 2, figsize=(12, 5))

ax1.errorbar(x, y1, yerr=yerr1, fmt='o', elinewidth=1, capsize=4)
ax1.set_title('Subplot 1: Thin Error Bars - how2matplotlib.com')
ax1.set_xlabel('X-axis')
ax1.set_ylabel('Y-axis')

ax2.errorbar(x, y2, yerr=yerr2, fmt='s', elinewidth=3, capsize=6)
ax2.set_title('Subplot 2: Thick Error Bars - how2matplotlib.com')
ax2.set_xlabel('X-axis')
ax2.set_ylabel('Y-axis')

plt.tight_layout()
plt.show()
Output:
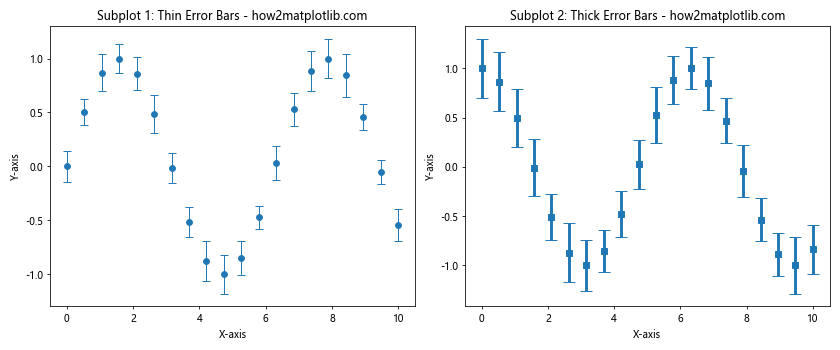
In this example, we create two subplots side by side. The first subplot uses thin error bars (elinewidth=1), while the second subplot uses thicker error bars (elinewidth=3). This approach allows you to compare different error bar thicknesses within the same figure.
Using Logarithmic Scales with Error Bars
When dealing with data that spans multiple orders of magnitude, you might need to use logarithmic scales. Changing the error bar thickness in such plots requires some additional considerations. Here’s an example:
import matplotlib.pyplot as plt
import numpy as np

# Data for plotting
x = np.logspace(0, 3, 20)
y = np.exp(-x/500)
yerr = 0.1 * y

# Create the plot with logarithmic scale and custom error bars
plt.figure(figsize=(10, 6))
plt.errorbar(x, y, yerr=yerr, fmt='o', elinewidth=2, capsize=5)
plt.xscale('log')
plt.yscale('log')
plt.title('Error Bars on Logarithmic Scale - how2matplotlib.com')
plt.xlabel('X-axis (log scale)')
plt.ylabel('Y-axis (log scale)')
plt.show()
Output:
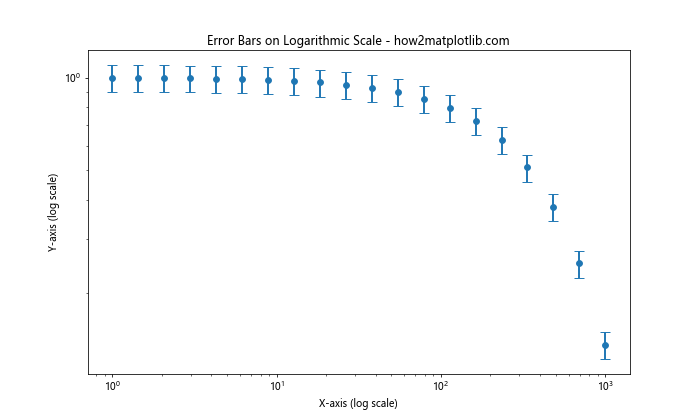
In this example, we use logarithmic scales for both x and y axes. The error bar thickness is set using elinewidth=2. When working with logarithmic scales, it’s important to ensure that the error bar thickness is appropriate for the scale of the data.
Changing Error Bar Thickness in Horizontal Bar Charts
So far, we’ve focused on vertical error bars, but Matplotlib also supports horizontal error bars. Here’s an example of how to change the error bar thickness in a horizontal bar chart:
import matplotlib.pyplot as plt
import numpy as np

# Data for plotting
categories = ['Category A', 'Category B', 'Category C', 'Category D']
values = [3, 7, 1, 5]
xerr = [0.5, 1, 0.2, 0.8]

# Create horizontal bar chart with error bars
plt.figure(figsize=(10, 6))
plt.barh(categories, values, xerr=xerr, height=0.5, capsize=5,
         error_kw={'elinewidth': 2, 'capthick': 2})
plt.title('Horizontal Bar Chart with Error Bars - how2matplotlib.com')
plt.xlabel('Values')
plt.ylabel('Categories')
plt.show()
Output:
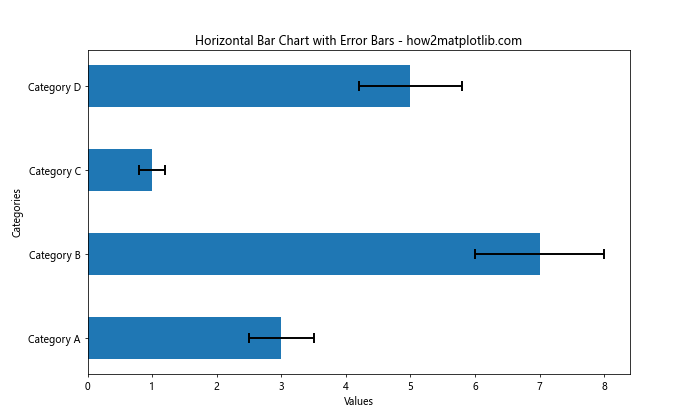
In this example, we create a horizontal bar chart with error bars. The error_kw parameter is used to specify the error bar properties, including elinewidth for thickness.
Customizing Error Bar Colors and Styles
In addition to changing the error bar thickness, you can also customize the colors and styles of the error bars to make your plots more visually appealing and informative. Here’s an example:
import matplotlib.pyplot as plt
import numpy as np

# Data for plotting
x = np.linspace(0, 10, 15)
y = np.sin(x) * np.exp(-x/10)
yerr = 0.2 + 0.1 * np.random.rand(len(x))

# Create the plot with customized error bars
plt.figure(figsize=(10, 6))
plt.errorbar(x, y, yerr=yerr, fmt='o',
             ecolor='red',  # Color of error bars
             elinewidth=2,  # Thickness of error bars
             capsize=6,
             capthick=2,
             markeredgecolor='blue',  # Color of marker edge
             markerfacecolor='lightblue',  # Color of marker face
             markersize=8,
             linestyle='--',  # Style of the line connecting points
             color='green')  # Color of the line connecting points
plt.title('Customized Error Bar Appearance - how2matplotlib.com')
plt.xlabel('X-axis')
plt.ylabel('Y-axis')
plt.show()
Output:
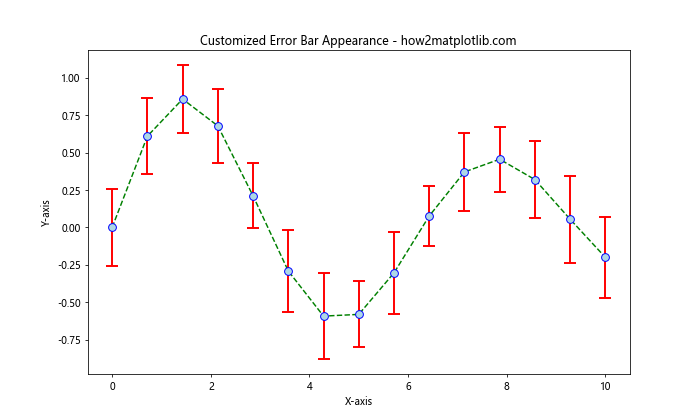
In this example, we’ve used various parameters to customize the appearance of the error bars and data points:
ecolor: Sets the color of the error barselinewidth: Controls the thickness of the error barscapsizeandcapthick: Adjust the size and thickness of the capsmarkeredgecolorandmarkerfacecolor: Set the colors for the marker edges and facesmarkersize: Determines the size of the markerslinestyleandcolor: Control the style and color of the line connecting the data points
By combining these parameters, you can create highly customized error bar plots that effectively communicate your data and uncertainties.
Changing Error Bar Thickness in 3D Plots
Matplotlib also supports 3D plots with error bars. Changing the error bar thickness in 3D plots requires a slightly different approach. Here’s an example:
import matplotlib.pyplot as plt
import numpy as np
from mpl_toolkits.mplot3d import Axes3D

# Data for plotting
x = np.linspace(0, 10, 10)
y = np.linspace(0, 10, 10)
z = np.sin(x) * np.cos(y)
zerr = 0.2 + 0.1 * np.random.rand(len(x))

# Create 3D plot with error bars
fig = plt.figure(figsize=(10, 8))
ax = fig.add_subplot(111, projection='3d')

ax.errorbar(x, y, z, zerr=zerr, fmt='o', elinewidth=2, capsize=5, capthick=2)
ax.set_title('3D Plot with Error Bars - how2matplotlib.com')
ax.set_xlabel('X-axis')
ax.set_ylabel('Y-axis')
ax.set_zlabel('Z-axis')

plt.show()
Output:
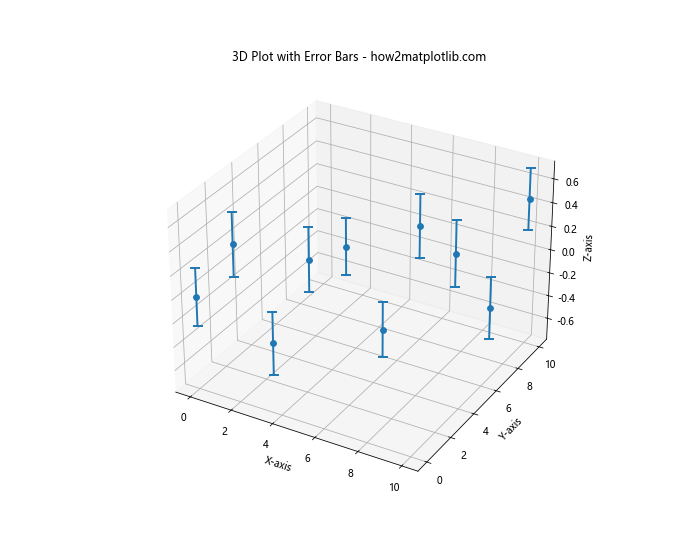
In this example, we create a 3D plot using the Axes3D class from mpl_toolkits.mplot3d. The error bars are added using the errorbar() function, and their thickness is controlled by the elinewidth parameter.
Adjusting Error Bar Thickness in Polar Plots
Polar plots are another type of visualization where you might want to change the error bar thickness. Here’s an example of how to do this:
import matplotlib.pyplot as plt
import numpy as np

# Data for plotting
theta = np.linspace(0, 2*np.pi, 12, endpoint=False)
r = np.random.uniform(0.5, 1, size=12)
rerr = 0.1 + 0.1 * np.random.rand(len(theta))

# Create polar# Create polar plot with error bars
fig = plt.figure(figsize=(10, 8))
ax = fig.add_subplot(111, projection='polar')

ax.errorbar(theta, r, yerr=rerr, fmt='o', elinewidth=2, capsize=5, capthick=2)
ax.set_title('Polar Plot with Error Bars - how2matplotlib.com')
ax.set_rticks([0.5, 0.75, 1])
ax.set_rlabel_position(22.5)

plt.show()
Output:
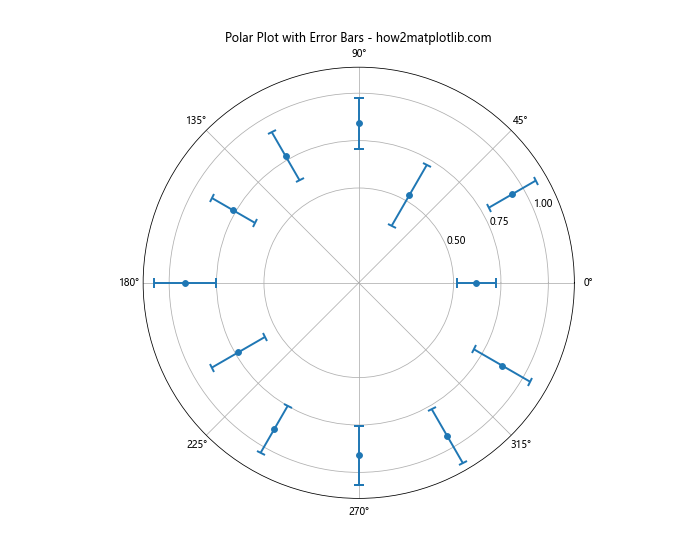
In this example, we create a polar plot using the polar projection. The error bars are added using the errorbar() function, and their thickness is controlled by the elinewidth parameter. The capsize and capthick parameters are used to adjust the appearance of the error bar caps.
Changing Error Bar Thickness in Box Plots
While box plots typically don’t use traditional error bars, they do display statistical information about data distribution. You can adjust the thickness of the whiskers and caps in box plots, which serve a similar purpose to error bars. Here’s an example:
import matplotlib.pyplot as plt
import numpy as np

# Generate sample data
data = [np.random.normal(0, std, 100) for std in range(1, 4)]

# Create box plot with customized whiskers and caps
fig, ax = plt.subplots(figsize=(10, 6))
bp = ax.boxplot(data, patch_artist=True, whiskerprops={'linewidth': 2},
                capprops={'linewidth': 2})

# Customize box colors
colors = ['lightblue', 'lightgreen', 'lightpink']
for patch, color in zip(bp['boxes'], colors):
    patch.set_facecolor(color)

plt.title('Box Plot with Customized Whiskers - how2matplotlib.com')
plt.xlabel('Groups')
plt.ylabel('Values')
plt.show()
Output:
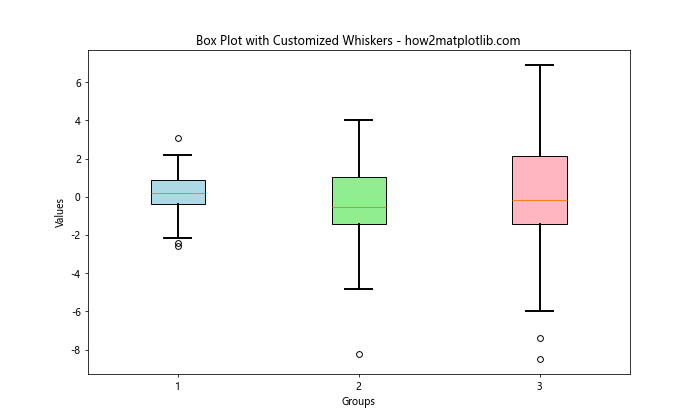
In this example, we use the whiskerprops and capprops parameters to adjust the thickness of the whiskers and caps in the box plot. The linewidth property is set to 2 for both, making them thicker than the default.
Changing Error Bar Thickness in Heatmaps
While heatmaps don’t typically use error bars, you might want to add custom error indicators to your heatmap. Here’s an example of how to add error bars to a heatmap and adjust their thickness:
import matplotlib.pyplot as plt
import numpy as np

# Generate sample data
data = np.random.rand(5, 5)
error = np.random.rand(5, 5) * 0.1

# Create heatmap with error bars
fig, ax = plt.subplots(figsize=(10, 8))
im = ax.imshow(data, cmap='viridis')

# Add colorbar
cbar = ax.figure.colorbar(im, ax=ax)
cbar.ax.set_ylabel('Values', rotation=-90, va="bottom")

# Add error bars
for i in range(5):
    for j in range(5):
        ax.errorbar(j, i, yerr=error[i, j], xerr=error[i, j],
                    ecolor='red', elinewidth=2, capsize=5, capthick=2)

ax.set_title('Heatmap with Error Bars - how2matplotlib.com')
ax.set_xticks(np.arange(data.shape[1]))
ax.set_yticks(np.arange(data.shape[0]))
ax.set_xticklabels(['A', 'B', 'C', 'D', 'E'])
ax.set_yticklabels(['V', 'W', 'X', 'Y', 'Z'])

plt.setp(ax.get_xticklabels(), rotation=45, ha="right", rotation_mode="anchor")

plt.show()
Output:
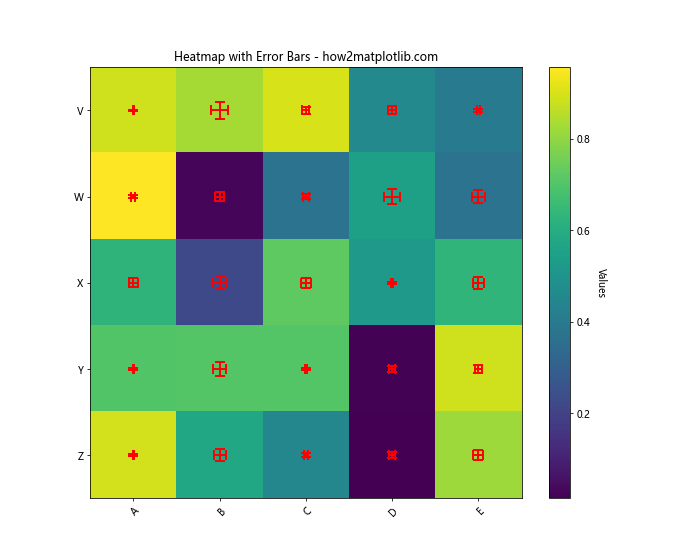
In this example, we create a heatmap and add custom error bars to each cell. The thickness of the error bars is controlled by the elinewidth parameter, which is set to 2 in this case.
Best Practices for Changing Error Bar Thickness
When changing the error bar thickness in Matplotlib, it’s important to keep a few best practices in mind:
- Consistency: Try to maintain consistent error bar thickness across similar plots in your project or publication. This helps in creating a cohesive visual style.
Readability: While thicker error bars can make uncertainties more visible, excessively thick bars can obscure the data points. Strike a balance between visibility and clarity.
Color contrast: Ensure that the error bar color contrasts well with both the background and the data points. This is especially important when using thicker error bars.
Scale appropriately: Adjust the error bar thickness based on the overall size of your plot. Larger plots may benefit from slightly thicker error bars, while smaller plots might require thinner ones.
Consider your audience: If your plot is intended for a presentation or publication, you might want to use slightly thicker error bars to ensure visibility. For detailed analysis, thinner bars might be more appropriate.
Combine with other styles: Use error bar thickness in combination with other style elements like color, cap size, and line style to create visually appealing and informative plots.
Document your choices: If you’re using custom error bar styles in a scientific publication, consider mentioning your styling choices in the figure caption or methods section.
Conclusion
Changing the error bar thickness in Matplotlib is a powerful way to enhance the visual appeal and clarity of your data visualizations. Throughout this article, we’ve explored various methods to adjust error bar thickness, from simple parameter tweaks to more advanced customization techniques. We’ve covered how to change error bar thickness in different types of plots, including basic scatter plots, bar charts, 3D plots, polar plots, and even unconventional applications in box plots and heatmaps. We’ve also discussed best practices to ensure your error bars are both visually appealing and informative. Remember that the key to effective data visualization is not just in the technical implementation, but also in making thoughtful design choices. The thickness of your error bars should be chosen to complement your data and enhance understanding, not to overshadow or confuse.