How to Change the Legend Position in Matplotlib
Change the legend position in Matplotlib is an essential skill for data visualization enthusiasts and professionals alike. This article will delve deep into the various methods and techniques to change the legend position in Matplotlib, providing you with a thorough understanding of this crucial aspect of plot customization. We’ll explore different approaches, from simple built-in options to more advanced customization techniques, all aimed at helping you master the art of legend positioning in Matplotlib.
Understanding the Importance of Legend Position
Before we dive into the specifics of how to change the legend position in Matplotlib, it’s crucial to understand why legend positioning is so important. The legend in a plot serves as a key to interpreting the data presented. By strategically positioning the legend, you can:
- Enhance the readability of your plot
- Avoid obscuring important data points
- Create a more aesthetically pleasing visualization
- Optimize the use of space in your figure
Let’s start with a basic example of how to change the legend position in Matplotlib:
import matplotlib.pyplot as plt

# Data for the plot
x = [1, 2, 3, 4, 5]
y1 = [2, 4, 6, 8, 10]
y2 = [1, 3, 5, 7, 9]

# Create the plot
plt.figure(figsize=(8, 6))
plt.plot(x, y1, label='Line 1')
plt.plot(x, y2, label='Line 2')

# Add a title
plt.title('How to Change Legend Position in Matplotlib - how2matplotlib.com')

# Add a legend with a custom position
plt.legend(loc='upper left')

# Show the plot
plt.show()
Output:
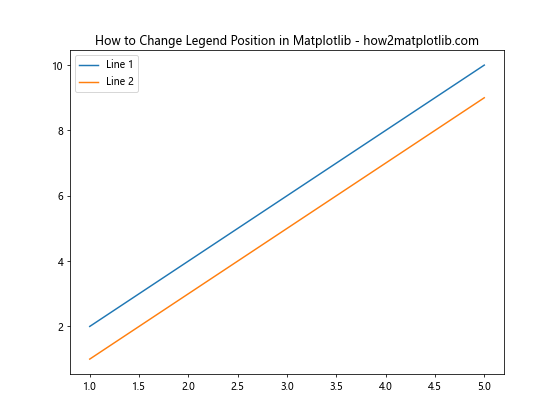
In this example, we’ve used the loc parameter in the plt.legend() function to change the legend position to the upper left corner of the plot. This is one of the simplest ways to change the legend position in Matplotlib.
Built-in Legend Locations
Matplotlib provides several built-in location options for legend positioning. These options make it easy to quickly change the legend position without having to specify exact coordinates. Here’s a list of the available built-in locations:
- ‘best’
- ‘upper right’
- ‘upper left’
- ‘lower left’
- ‘lower right’
- ‘right’
- ‘center left’
- ‘center right’
- ‘lower center’
- ‘upper center’
- ‘center’
Let’s see an example that demonstrates how to use these built-in locations:
import matplotlib.pyplot as plt

# Data for the plot
x = [1, 2, 3, 4, 5]
y1 = [2, 4, 6, 8, 10]
y2 = [1, 3, 5, 7, 9]

# Create a figure with subplots
fig, axs = plt.subplots(3, 3, figsize=(15, 15))
fig.suptitle('Change Legend Position in Matplotlib - how2matplotlib.com', fontsize=16)

# List of legend locations
locations = ['best', 'upper right', 'upper left', 'lower left', 'lower right',
             'right', 'center left', 'center right', 'lower center']

# Create plots with different legend positions
for i, ax in enumerate(axs.flat):
    if i < len(locations):
        ax.plot(x, y1, label='Line 1')
        ax.plot(x, y2, label='Line 2')
        ax.legend(loc=locations[i], title=locations[i])
        ax.set_title(f'Legend at {locations[i]}')

plt.tight_layout()
plt.show()
Output:
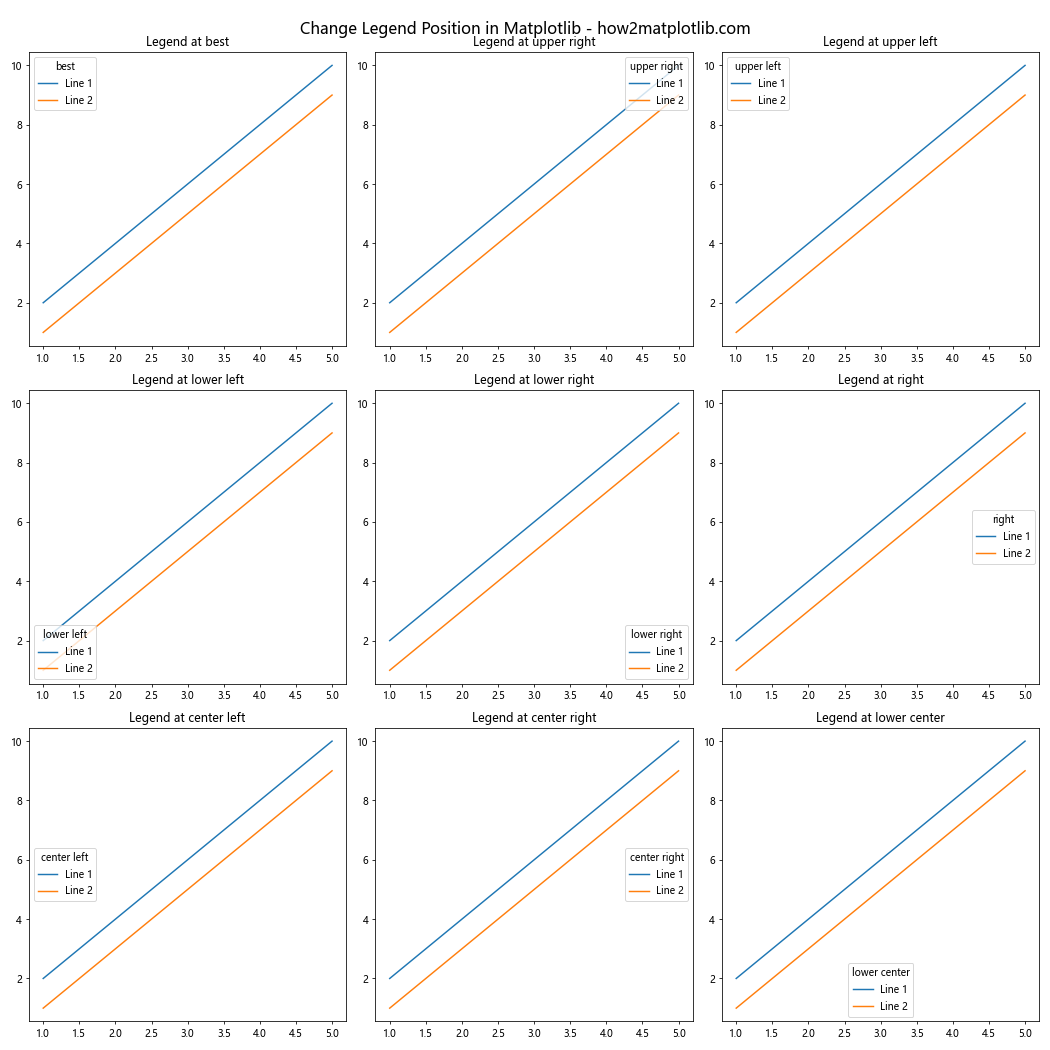
This example creates a 3x3 grid of subplots, each demonstrating a different built-in legend location. It's a great way to visualize how each option affects the legend position.
Changing Legend Position Using Coordinates
While the built-in locations are convenient, sometimes you need more precise control over the legend position. Matplotlib allows you to specify the exact coordinates for the legend position. This is done by passing a tuple of (x, y) coordinates to the loc parameter.
The coordinates are specified in axes fraction units, where (0, 0) represents the lower-left corner of the axes, and (1, 1) represents the upper-right corner. Here's an example:
import matplotlib.pyplot as plt

# Data for the plot
x = [1, 2, 3, 4, 5]
y1 = [2, 4, 6, 8, 10]
y2 = [1, 3, 5, 7, 9]

# Create the plot
plt.figure(figsize=(8, 6))
plt.plot(x, y1, label='Line 1')
plt.plot(x, y2, label='Line 2')

# Add a title
plt.title('Change Legend Position Using Coordinates - how2matplotlib.com')

# Add a legend with custom coordinates
plt.legend(loc=(0.7, 0.5))  # Position at (0.7, 0.5) in axes fraction

plt.show()
Output:
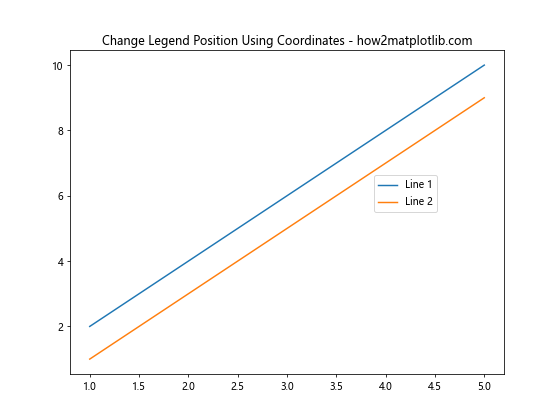
In this example, we've positioned the legend at (0.7, 0.5) in axes fraction units, which places it roughly in the middle-right of the plot.
Using bbox_to_anchor for Advanced Positioning
For even more control over legend positioning, you can use the bbox_to_anchor parameter. This parameter allows you to specify a bounding box that the legend will be anchored to. It's particularly useful when you want to place the legend outside the plot area.
Here's an example of how to use bbox_to_anchor:
import matplotlib.pyplot as plt

# Data for the plot
x = [1, 2, 3, 4, 5]
y1 = [2, 4, 6, 8, 10]
y2 = [1, 3, 5, 7, 9]

# Create the plot
fig, ax = plt.subplots(figsize=(8, 6))
ax.plot(x, y1, label='Line 1')
ax.plot(x, y2, label='Line 2')

# Add a title
ax.set_title('Change Legend Position with bbox_to_anchor - how2matplotlib.com')

# Add a legend outside the plot
ax.legend(bbox_to_anchor=(1.05, 1), loc='upper left')

# Adjust the layout to make room for the legend
plt.tight_layout()

plt.show()
Output:
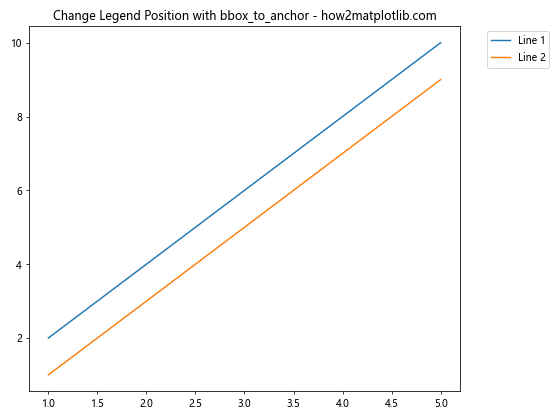
In this example, we've used bbox_to_anchor=(1.05, 1) to place the legend just outside the right edge of the plot. The loc='upper left' parameter specifies which point of the legend should be anchored to the given coordinates.
Changing Legend Position for Multiple Legends
Sometimes, you might want to include multiple legends in your plot. Matplotlib allows you to create and position multiple legends independently. Here's an example:
import matplotlib.pyplot as plt

# Data for the plot
x = [1, 2, 3, 4, 5]
y1 = [2, 4, 6, 8, 10]
y2 = [1, 3, 5, 7, 9]
y3 = [1, 2, 3, 4, 5]

# Create the plot
fig, ax = plt.subplots(figsize=(10, 6))
line1 = ax.plot(x, y1, label='Line 1')
line2 = ax.plot(x, y2, label='Line 2')
line3 = ax.plot(x, y3, label='Line 3')

# Add a title
ax.set_title('Change Legend Position for Multiple Legends - how2matplotlib.com')

# Add multiple legends
legend1 = ax.legend(handles=[line1[0], line2[0]], loc='upper left', title='Legend 1')
ax.add_artist(legend1)  # Add the first legend to the plot
ax.legend(handles=[line3[0]], loc='lower right', title='Legend 2')

plt.show()
Output:
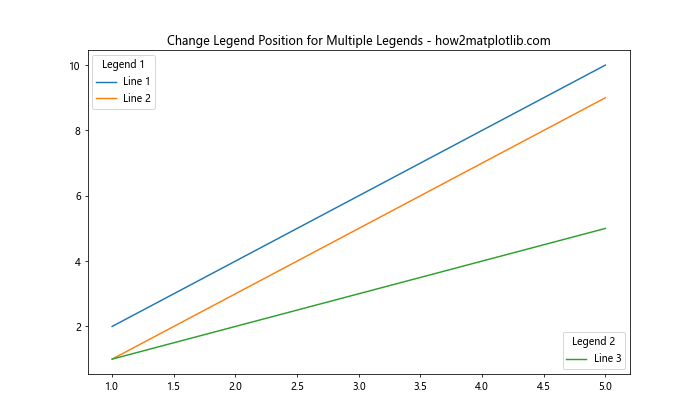
In this example, we've created two separate legends and positioned them at different locations on the plot. The add_artist() method is used to add the first legend to the plot before creating the second one.
Adjusting Legend Size and Position
Sometimes, you might need to adjust both the size and position of the legend. This can be achieved by combining the bbox_to_anchor parameter with the bbox_transform parameter. Here's an example:
import matplotlib.pyplot as plt

# Data for the plot
x = [1, 2, 3, 4, 5]
y1 = [2, 4, 6, 8, 10]
y2 = [1, 3, 5, 7, 9]

# Create the plot
fig, ax = plt.subplots(figsize=(8, 6))
ax.plot(x, y1, label='Line 1')
ax.plot(x, y2, label='Line 2')

# Add a title
ax.set_title('Adjust Legend Size and Position - how2matplotlib.com')

# Add a legend with custom size and position
ax.legend(bbox_to_anchor=(0.5, -0.15), loc='upper center', bbox_transform=fig.transFigure)

# Adjust the layout
plt.tight_layout()

plt.show()
Output:
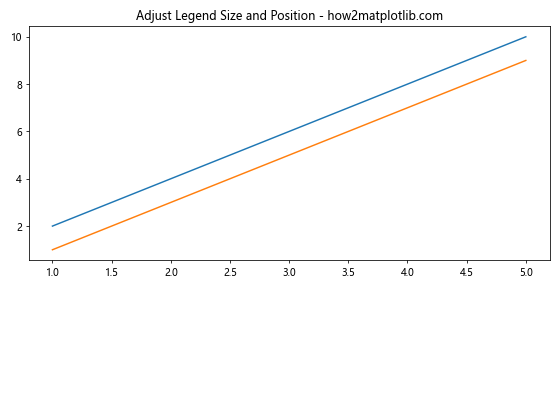
In this example, we've used bbox_to_anchor=(0.5, -0.15) to position the legend below the plot, and bbox_transform=fig.transFigure to use figure coordinates instead of axes coordinates.
Changing Legend Position in Subplots
When working with subplots, you might want to change the legend position for each subplot individually. Here's how you can do that:
import matplotlib.pyplot as plt

# Data for the plots
x = [1, 2, 3, 4, 5]
y1 = [2, 4, 6, 8, 10]
y2 = [1, 3, 5, 7, 9]

# Create a figure with subplots
fig, (ax1, ax2) = plt.subplots(1, 2, figsize=(12, 5))
fig.suptitle('Change Legend Position in Subplots - how2matplotlib.com', fontsize=16)

# First subplot
ax1.plot(x, y1, label='Line 1')
ax1.plot(x, y2, label='Line 2')
ax1.legend(loc='upper left')
ax1.set_title('Subplot 1')

# Second subplot
ax2.plot(x, y1, label='Line 1')
ax2.plot(x, y2, label='Line 2')
ax2.legend(loc='lower right')
ax2.set_title('Subplot 2')

plt.tight_layout()
plt.show()
Output:
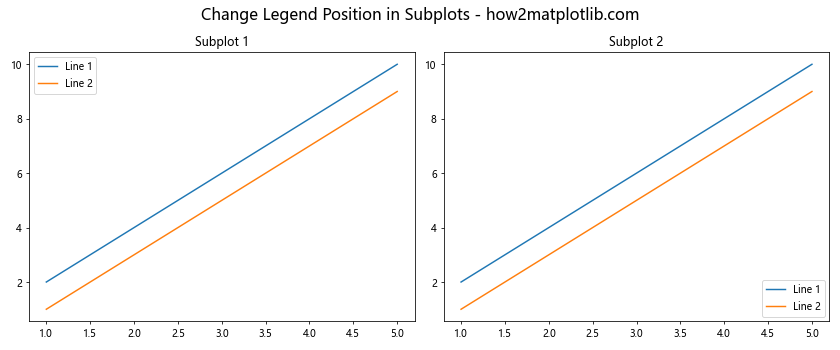
In this example, we've created two subplots and positioned the legend differently in each one.
Using a Custom Legend Position Function
For more complex legend positioning requirements, you can create a custom function to calculate the legend position. This can be particularly useful when you want to dynamically adjust the legend position based on the data or other plot characteristics.
Here's an example of a custom legend position function:
import matplotlib.pyplot as plt

def custom_legend_position(ax, data):
    """Calculate a custom legend position based on the data."""
    y_max = max(max(line) for line in data)
    x_pos = 0.7  # 70% of the way across the x-axis
    y_pos = y_max / ax.get_ylim()[1]  # Normalize y position
    return (x_pos, y_pos)

# Data for the plot
x = [1, 2, 3, 4, 5]
y1 = [2, 4, 6, 8, 10]
y2 = [1, 3, 5, 7, 9]

# Create the plot
fig, ax = plt.subplots(figsize=(8, 6))
ax.plot(x, y1, label='Line 1')
ax.plot(x, y2, label='Line 2')

# Add a title
ax.set_title('Custom Legend Position Function - how2matplotlib.com')

# Calculate custom legend position
legend_pos = custom_legend_position(ax, [y1, y2])

# Add the legend with the custom position
ax.legend(loc=legend_pos)

plt.show()
Output:
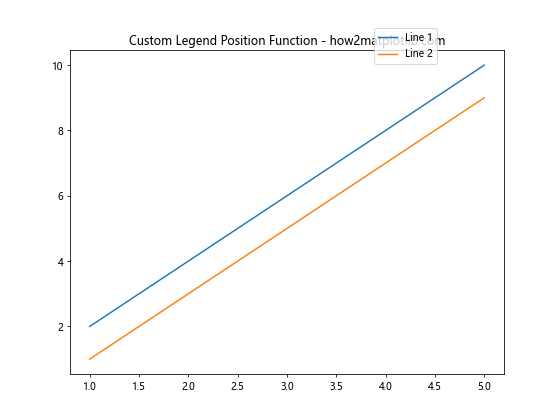
In this example, we've created a custom_legend_position function that calculates the legend position based on the maximum y-value in the data. This ensures that the legend is always positioned relative to the data, regardless of the specific values.
Changing Legend Position with Draggable Legends
Matplotlib also provides the option to create draggable legends, which can be particularly useful for interactive plots. Here's how you can create a draggable legend:
import matplotlib.pyplot as plt

# Data for the plot
x = [1, 2, 3, 4, 5]
y1 = [2, 4, 6, 8, 10]
y2 = [1, 3, 5, 7, 9]

# Create the plot
fig, ax = plt.subplots(figsize=(8, 6))
ax.plot(x, y1, label='Line 1')
ax.plot(x, y2, label='Line 2')

# Add a title
ax.set_title('Draggable Legend - how2matplotlib.com')

# Add a draggable legend
legend = ax.legend(loc='upper left', draggable=True)

plt.show()
Output:
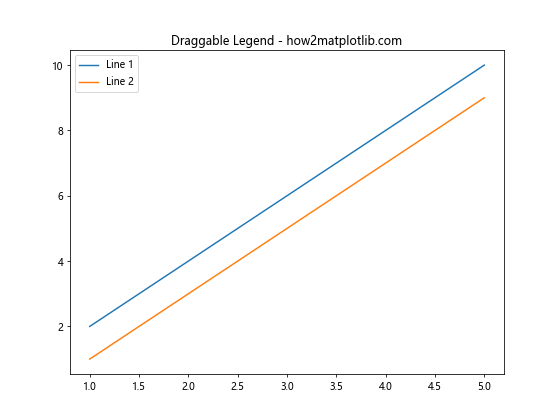
In this example, we've set draggable=True when creating the legend. This allows users to click and drag the legend to any position on the plot.
Changing Legend Position with Automatic Layout Adjustment
When changing the legend position, especially when placing it outside the plot area, you might need to adjust the layout to ensure everything fits properly. Matplotlib's tight_layout() function can help with this, but sometimes you need more control. Here's an example of how to manually adjust the layout when changing the legend position:
import matplotlib.pyplot as plt

# Data for the plot
x = [1, 2, 3, 4, 5]
y1 = [2, 4, 6, 8, 10]
y2 = [1, 3, 5, 7, 9]

# Create the plot
fig, ax = plt.subplots(figsize=(8, 6))
ax.plot(x, y1, label='Line 1')
ax.plot(x, y2, label='Line 2')

# Add a title
ax.set_title('Legend Position with Layout Adjustment - how2matplotlib.com')

# Add a legend outside the plot
ax.legend(bbox_to_anchor=(1.05, 1), loc='upper left')

# Adjust the layout
plt.subplots_adjust(right=0.75)

plt.show()
Output:
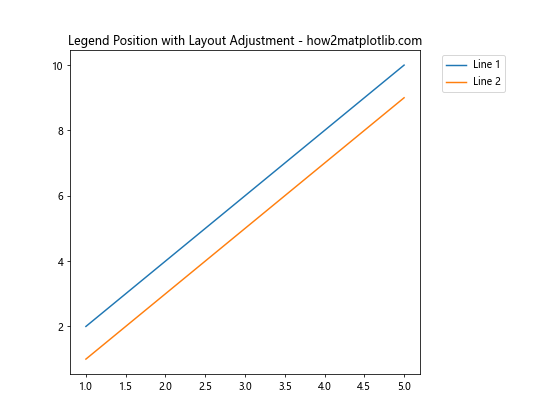
In this example, we've used plt.subplots_adjust(right=0.75) to make room for the legend on the right side of the plot.
Changing Legend Position with Constrained Layout
Matplotlib's constrained layout feature can be very helpful when changing legend positions, especially when dealing with multiple subplots or complex layouts. Here's an example:
import matplotlib.pyplot as plt

# Data for the plots
x = [1, 2, 3, 4, 5]
y1 = [2, 4, 6, 8, 10]
y2 = [1, 3, 5, 7, 9]

# Create a figure with constrained layout
fig, (ax1, ax2) = plt.subplots(1, 2, figsize=(12, 5), constrained_layout=True)
fig.suptitle('Change Legend Position with Constrained Layout - how2matplotlib.com', fontsize=16)

# First subplot
ax1.plot(x, y1, label='Line 1')
ax1.plot(x, y2, label='Line 2')
ax1.legend(loc='center left', bbox_to_anchor=(1, 0.5))
ax1.set_title('Subplot 1')

# Second subplot
ax2.plot(x, y1, label='Line 1')
ax2.plot(x, y2, label='Line 2')
ax2.legend(loc='center left', bbox_to_anchor=(1, 0.5))
ax2.set_title('Subplot 2')

plt.show()
Output:
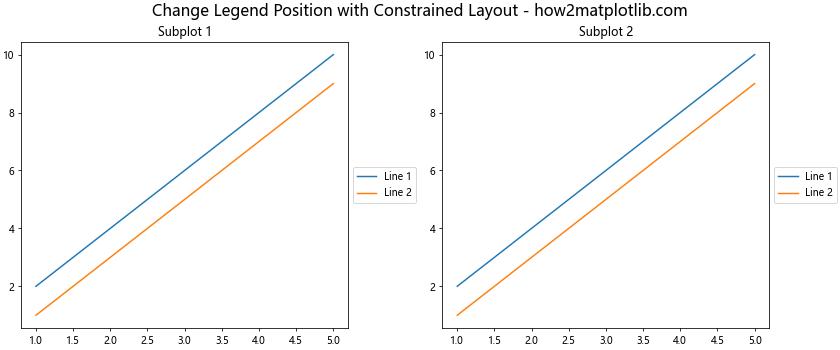
In this example, we've used constrained_layout=True when creating the figure. This automatically adjusts the layout to accommodate the legends placed outside the plot areas.
Changing Legend Position with Annotations
Sometimes, you might want to combine legends with annotations for a more informative plot. Here's an example of how to change the legend position while also adding annotations:
import matplotlib.pyplot as plt

# Data for the plot
x = [1, 2, 3, 4, 5]
y1 = [2, 4, 6, 8, 10]
y2 = [1, 3, 5, 7, 9]

# Create the plot
fig, ax = plt.subplots(figsize=(10, 6))
ax.plot(x, y1, label='Line 1')
ax.plot(x, y2, label='Line 2')

# Add a title
ax.set_title('Change Legend Position with Annotations - how2matplotlib.com')

# Add the legend
ax.legend(loc='upper left')

# Add annotations
ax.annotate('Peak', xy=(5, 10), xytext=(5.5, 9),
            arrowprops=dict(facecolor='black', shrink=0.05))
ax.annotate('Valley', xy=(1, 1), xytext=(1.5, 2),
            arrowprops=dict(facecolor='black', shrink=0.05))

plt.show()
Output:
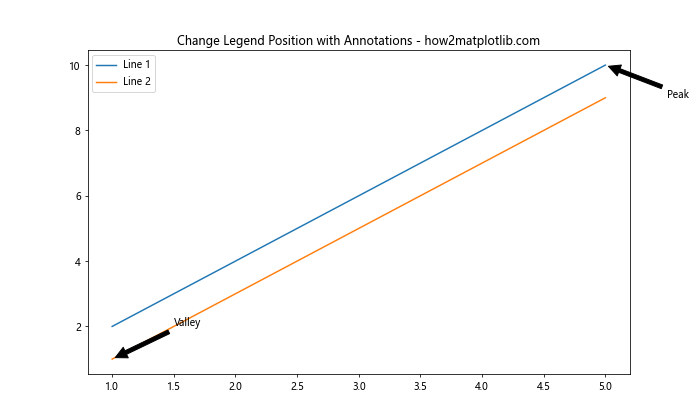
In this example, we've positioned the legend in the upper left corner and added annotations to highlight specific points on the plot.
Changing Legend Position in Polar Plots
Changing the legend position in polar plots requires a slightly different approach. Here's an example:
import matplotlib.pyplot as plt
import numpy as np

# Data for the plot
r = np.arange(0, 2, 0.01)
theta1 = 2 * np.pi * r
theta2 = 4 * np.pi * r

# Create the polar plot
fig, ax = plt.subplots(subplot_kw=dict(projection='polar'), figsize=(8, 8))
ax.plot(theta1, r, label='Spiral 1')
ax.plot(theta2, r, label='Spiral 2')

# Add a title
ax.set_title('Change Legend Position in Polar Plot - how2matplotlib.com')

# Add the legend
ax.legend(loc='lower left', bbox_to_anchor=(0.1, -0.1))

plt.show()
Output:
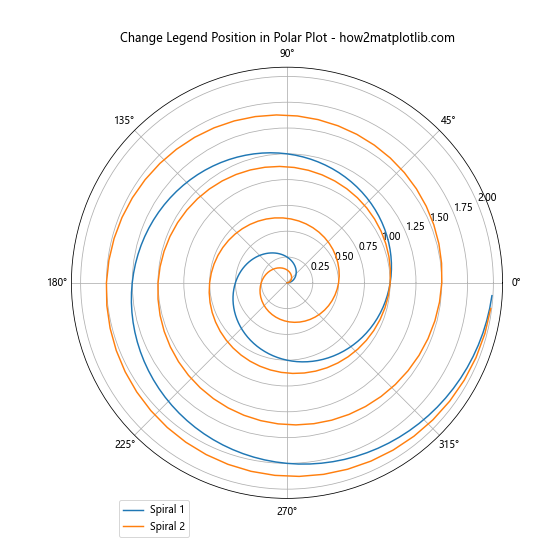
In this example, we've created a polar plot and positioned the legend outside the plot area using bbox_to_anchor.
Changing Legend Position with Custom Styling
You can also combine legend positioning with custom styling to create more visually appealing plots. Here's an example:
import matplotlib.pyplot as plt

# Data for the plot
x = [1, 2, 3, 4, 5]
y1 = [2, 4, 6, 8, 10]
y2 = [1, 3, 5, 7, 9]

# Create the plot
fig, ax = plt.subplots(figsize=(8, 6))
ax.plot(x, y1, label='Line 1', color='#FF5733')
ax.plot(x, y2, label='Line 2', color='#33FF57')

# Add a title
ax.set_title('Change Legend Position with Custom Styling - how2matplotlib.com')

# Add a styled legend
legend = ax.legend(loc='upper left', frameon=True, facecolor='#F0F0F0', edgecolor='#D3D3D3')
legend.get_frame().set_alpha(0.9)

plt.show()
Output:
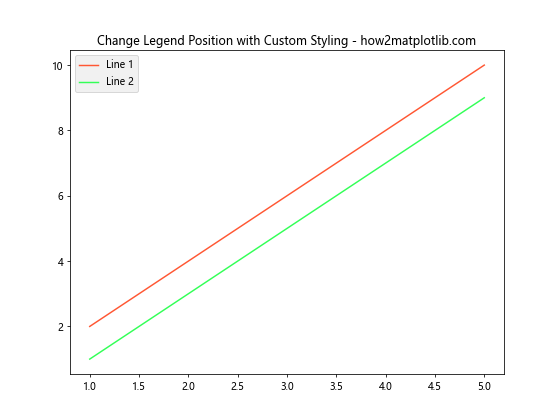
In this example, we've positioned the legend in the upper left corner and added custom styling including a frame, background color, and transparency.
Conclusion
Changing the legend position in Matplotlib is a powerful tool for creating clear, informative, and visually appealing plots. Whether you're using built-in locations, custom coordinates, or advanced techniques like bbox_to_anchor, Matplotlib provides a wide range of options to suit your needs.