Mastering Event Handling in Matplotlib
Event Handling in Matplotlib is a crucial aspect of creating interactive and dynamic visualizations. This comprehensive guide will explore the various techniques and methods for implementing event handling in Matplotlib, providing you with the knowledge and skills to create responsive and engaging plots. We’ll cover everything from basic mouse events to advanced keyboard interactions, ensuring you have a thorough understanding of event handling in Matplotlib.
Introduction to Event Handling in Matplotlib
Event Handling in Matplotlib allows you to create interactive visualizations that respond to user input. By capturing and processing events such as mouse clicks, keyboard presses, and figure resizes, you can enhance the user experience and provide additional functionality to your plots. Event Handling in Matplotlib is essential for creating dynamic and responsive visualizations that can adapt to user interactions in real-time.
Let’s start with a simple example of event handling in Matplotlib:
import matplotlib.pyplot as plt

def on_click(event):
    print(f"Clicked at position: ({event.xdata}, {event.ydata})")

fig, ax = plt.subplots()
ax.plot([1, 2, 3, 4], [1, 4, 2, 3])
ax.set_title("Event Handling in Matplotlib - how2matplotlib.com")
fig.canvas.mpl_connect('button_press_event', on_click)

plt.show()
Output:
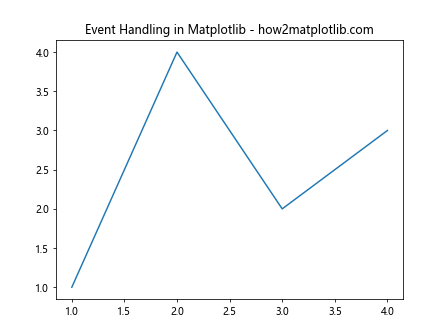
In this example, we’ve created a simple line plot and connected a mouse click event to a function that prints the coordinates of the click. This demonstrates the basic concept of event handling in Matplotlib.
Types of Events in Matplotlib
Matplotlib supports a wide range of events that you can handle in your visualizations. Understanding these events is crucial for effective event handling in Matplotlib. Here are some of the most common types of events:
- Mouse events
- Keyboard events
- Figure events
- Axes events
Let’s explore each of these event types in more detail and see how we can implement event handling in Matplotlib for each of them.
Mouse Events in Matplotlib
Mouse events are among the most common types of events you’ll handle in Matplotlib. These events include:
- button_press_event
- button_release_event
- motion_notify_event
- scroll_event
Here’s an example of handling multiple mouse events in Matplotlib:
import matplotlib.pyplot as plt

def on_click(event):
    print(f"Clicked at position: ({event.xdata}, {event.ydata})")

def on_move(event):
    print(f"Mouse moved to position: ({event.xdata}, {event.ydata})")

def on_scroll(event):
    print(f"Scrolled with step: {event.step}")

fig, ax = plt.subplots()
ax.plot([1, 2, 3, 4], [1, 4, 2, 3])
ax.set_title("Mouse Events in Matplotlib - how2matplotlib.com")

fig.canvas.mpl_connect('button_press_event', on_click)
fig.canvas.mpl_connect('motion_notify_event', on_move)
fig.canvas.mpl_connect('scroll_event', on_scroll)

plt.show()
Output:
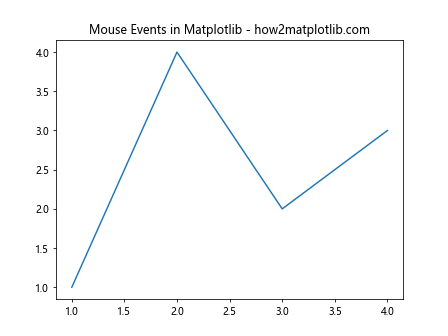
This example demonstrates how to handle multiple mouse events in a single Matplotlib plot. We’ve connected three different event types to their respective handler functions, allowing us to respond to clicks, mouse movements, and scrolling.
Keyboard Events in Matplotlib
Keyboard events allow you to respond to key presses and releases in your Matplotlib visualizations. The main keyboard events are:
- key_press_event
- key_release_event
Here’s an example of handling keyboard events in Matplotlib:
import matplotlib.pyplot as plt

def on_key_press(event):
    print(f"Key pressed: {event.key}")

def on_key_release(event):
    print(f"Key released: {event.key}")

fig, ax = plt.subplots()
ax.plot([1, 2, 3, 4], [1, 4, 2, 3])
ax.set_title("Keyboard Events in Matplotlib - how2matplotlib.com")

fig.canvas.mpl_connect('key_press_event', on_key_press)
fig.canvas.mpl_connect('key_release_event', on_key_release)

plt.show()
Output:
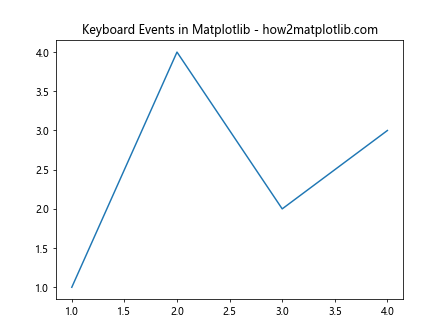
This example shows how to handle keyboard events in Matplotlib. We’ve connected both key press and key release events to their respective handler functions, allowing us to respond to keyboard interactions with the plot.
Figure Events in Matplotlib
Figure events are related to changes in the figure itself, such as resizing or closing. The main figure events are:
- resize_event
- close_event
Here’s an example of handling figure events in Matplotlib:
import matplotlib.pyplot as plt

def on_resize(event):
    print(f"Figure resized to: {event.width} x {event.height}")

def on_close(event):
    print("Figure closed")

fig, ax = plt.subplots()
ax.plot([1, 2, 3, 4], [1, 4, 2, 3])
ax.set_title("Figure Events in Matplotlib - how2matplotlib.com")

fig.canvas.mpl_connect('resize_event', on_resize)
fig.canvas.mpl_connect('close_event', on_close)

plt.show()
Output:
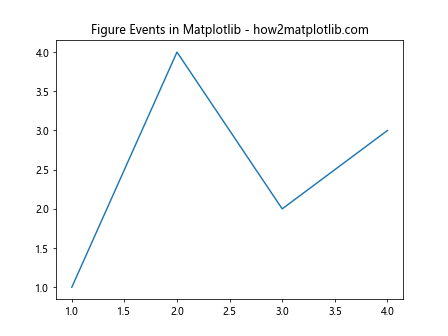
This example demonstrates how to handle figure events in Matplotlib. We’ve connected both resize and close events to their respective handler functions, allowing us to respond to changes in the figure’s size and when it’s closed.
Axes Events in Matplotlib
Axes events are specific to interactions with the axes of a plot. The main axes events are:
- xlim_changed
- ylim_changed
Here’s an example of handling axes events in Matplotlib:
import matplotlib.pyplot as plt

def on_xlim_change(event):
    print(f"X-axis limits changed to: {event.get_xlim()}")

def on_ylim_change(event):
    print(f"Y-axis limits changed to: {event.get_ylim()}")

fig, ax = plt.subplots()
ax.plot([1, 2, 3, 4], [1, 4, 2, 3])
ax.set_title("Axes Events in Matplotlib - how2matplotlib.com")

ax.callbacks.connect('xlim_changed', on_xlim_change)
ax.callbacks.connect('ylim_changed', on_ylim_change)

plt.show()
Output:
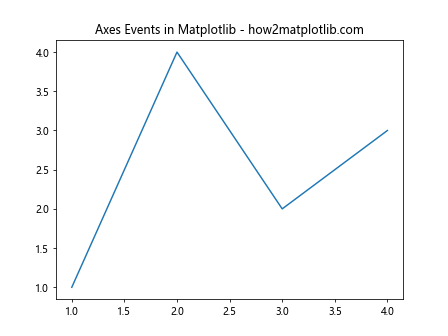
This example shows how to handle axes events in Matplotlib. We’ve connected both x-axis and y-axis limit change events to their respective handler functions, allowing us to respond to changes in the plot’s axis limits.
Advanced Event Handling Techniques in Matplotlib
Now that we’ve covered the basics of event handling in Matplotlib, let’s explore some more advanced techniques that can enhance your interactive visualizations.
Combining Multiple Event Types
Often, you’ll want to handle multiple event types in a single visualization. Here’s an example that combines mouse and keyboard events:
import matplotlib.pyplot as plt

class InteractivePlot:
    def __init__(self):
        self.fig, self.ax = plt.subplots()
        self.ax.plot([1, 2, 3, 4], [1, 4, 2, 3])
        self.ax.set_title("Interactive Plot - how2matplotlib.com")

        self.fig.canvas.mpl_connect('button_press_event', self.on_click)
        self.fig.canvas.mpl_connect('key_press_event', self.on_key_press)

    def on_click(self, event):
        print(f"Clicked at position: ({event.xdata}, {event.ydata})")

    def on_key_press(self, event):
        if event.key == 'r':
            self.ax.set_title("Title Reset - how2matplotlib.com")
        elif event.key == 'c':
            self.ax.clear()
        self.fig.canvas.draw()

plot = InteractivePlot()
plt.show()
Output:
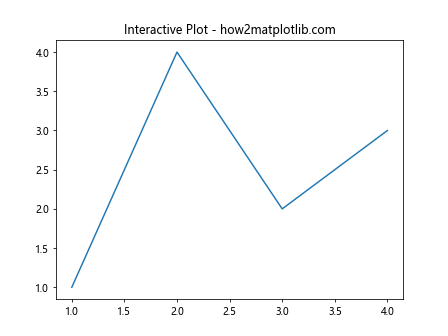
In this example, we’ve created a class that handles both mouse clicks and keyboard events. Clicking on the plot will print the coordinates, while pressing ‘r’ will reset the title, and pressing ‘c’ will clear the plot.
Using Event Handling for Data Exploration
Event handling in Matplotlib can be particularly useful for data exploration. Here’s an example that allows users to zoom into a specific region of a plot:
import matplotlib.pyplot as plt
import numpy as np

class ZoomablePlot:
    def __init__(self):
        self.fig, self.ax = plt.subplots()
        x = np.linspace(0, 10, 100)
        y = np.sin(x)
        self.ax.plot(x, y)
        self.ax.set_title("Zoomable Plot - how2matplotlib.com")

        self.zoom_start = None
        self.fig.canvas.mpl_connect('button_press_event', self.on_press)
        self.fig.canvas.mpl_connect('button_release_event', self.on_release)

    def on_press(self, event):
        self.zoom_start = (event.xdata, event.ydata)

    def on_release(self, event):
        if self.zoom_start:
            x_start, y_start = self.zoom_start
            x_end, y_end = event.xdata, event.ydata
            self.ax.set_xlim(min(x_start, x_end), max(x_start, x_end))
            self.ax.set_ylim(min(y_start, y_end), max(y_start, y_end))
            self.fig.canvas.draw()
            self.zoom_start = None

plot = ZoomablePlot()
plt.show()
Output:
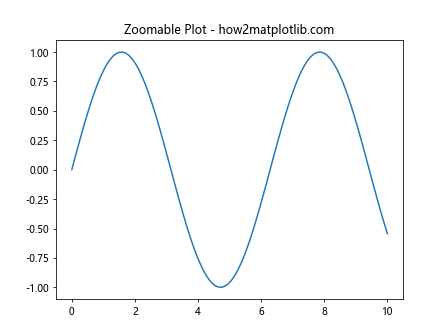
This example creates a zoomable plot where users can click and drag to zoom into a specific region. This kind of interactivity can be incredibly useful for exploring complex datasets.
Creating Custom Tooltips with Event Handling
Tooltips can provide additional information about data points when hovering over them. Here’s an example of how to create custom tooltips using event handling in Matplotlib:
import matplotlib.pyplot as plt
import numpy as np

class TooltipPlot:
    def __init__(self):
        self.fig, self.ax = plt.subplots()
        self.x = np.linspace(0, 10, 10)
        self.y = np.sin(self.x)
        self.scatter = self.ax.scatter(self.x, self.y)
        self.ax.set_title("Tooltip Plot - how2matplotlib.com")

        self.annot = self.ax.annotate("", xy=(0,0), xytext=(20,20),
                                      textcoords="offset points",
                                      bbox=dict(boxstyle="round", fc="w"),
                                      arrowprops=dict(arrowstyle="->"))
        self.annot.set_visible(False)

        self.fig.canvas.mpl_connect("motion_notify_event", self.hover)

    def update_annot(self, ind):
        pos = self.scatter.get_offsets()[ind["ind"][0]]
        self.annot.xy = pos
        text = f"({pos[0]:.2f}, {pos[1]:.2f})"
        self.annot.set_text(text)

    def hover(self, event):
        vis = self.annot.get_visible()
        if event.inaxes == self.ax:
            cont, ind = self.scatter.contains(event)
            if cont:
                self.update_annot(ind)
                self.annot.set_visible(True)
                self.fig.canvas.draw_idle()
            else:
                if vis:
                    self.annot.set_visible(False)
                    self.fig.canvas.draw_idle()

plot = TooltipPlot()
plt.show()
Output:
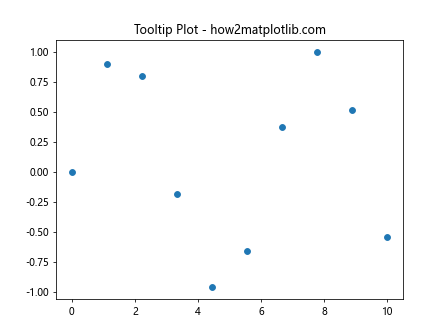
This example creates a scatter plot where hovering over a point displays a tooltip with the point’s coordinates. This technique can be extended to show more complex information about data points.
Best Practices for Event Handling in Matplotlib
When implementing event handling in Matplotlib, it’s important to follow some best practices to ensure your code is efficient, maintainable, and user-friendly. Here are some key considerations:
- Use meaningful function names for event handlers
- Keep event handling logic separate from plotting code
- Implement error handling for robust event processing
- Optimize performance for large datasets or complex interactions
- Provide clear user instructions for interactive elements
Let’s explore each of these best practices with examples.
Using Meaningful Function Names
Clear and descriptive function names make your code more readable and easier to maintain. Here’s an example:
import matplotlib.pyplot as plt

def handle_left_click(event):
    if event.button == 1:
        print(f"Left-clicked at ({event.xdata}, {event.ydata})")

def handle_right_click(event):
    if event.button == 3:
        print(f"Right-clicked at ({event.xdata}, {event.ydata})")

fig, ax = plt.subplots()
ax.plot([1, 2, 3, 4], [1, 4, 2, 3])
ax.set_title("Click Handling - how2matplotlib.com")

fig.canvas.mpl_connect('button_press_event', handle_left_click)
fig.canvas.mpl_connect('button_press_event', handle_right_click)

plt.show()
Output:
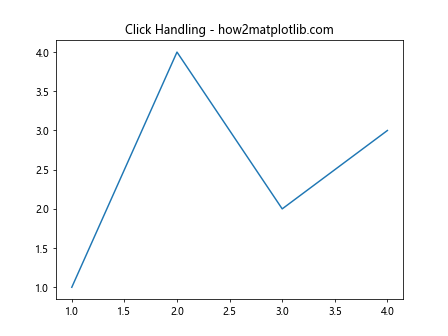
In this example, we’ve used clear function names that describe exactly what each handler does, making the code more self-documenting.
Separating Event Handling Logic
Keeping your event handling logic separate from your plotting code can make your programs easier to understand and maintain. Here’s an example:
import matplotlib.pyplot as plt

class PlotManager:
    def __init__(self):
        self.fig, self.ax = plt.subplots()
        self.ax.plot([1, 2, 3, 4], [1, 4, 2, 3])
        self.ax.set_title("Separated Logic - how2matplotlib.com")

    def setup_events(self):
        self.fig.canvas.mpl_connect('button_press_event', self.on_click)
        self.fig.canvas.mpl_connect('key_press_event', self.on_key_press)

    def on_click(self, event):
        print(f"Clicked at ({event.xdata}, {event.ydata})")

    def on_key_press(self, event):
        print(f"Pressed key: {event.key}")

manager = PlotManager()
manager.setup_events()
plt.show()
Output:
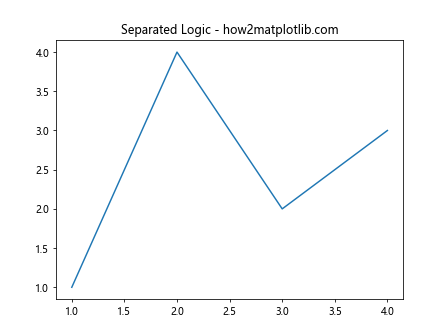
This example separates the plotting logic from the event handling logic, making the code more modular and easier to maintain.
Implementing Error Handling
Robust error handling is crucial for creating reliable interactive visualizations. Here’s an example that demonstrates error handling in event callbacks:
import matplotlib.pyplot as plt

def safe_event_handler(event):
    try:
        if event.inaxes:
            print(f"Event occurred at ({event.xdata}, {event.ydata})")
        else:
            print("Event occurred outside plot axes")
    except AttributeError:
        print("Invalid event data")
    except Exception as e:
        print(f"An error occurred: {str(e)}")

fig, ax = plt.subplots()
ax.plot([1, 2, 3, 4], [1, 4, 2, 3])
ax.set_title("Error Handling - how2matplotlib.com")

fig.canvas.mpl_connect('button_press_event', safe_event_handler)

plt.show()
Output:
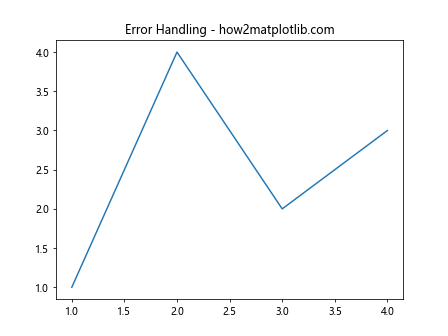
This example demonstrates how to implement error handling in your event callbacks, ensuring that your program can gracefully handle unexpected situations.
Optimizing Performance
When working with large datasets or complex interactions, it’s important to optimize your event handling code for performance. Here’s an example that demonstrates a more efficient way to update a plot:
import matplotlib.pyplot as plt
import numpy as np

class EfficientPlot:
    def __init__(self):
        self.fig, self.ax = plt.subplots()
        self.x = np.linspace(0, 10, 1000)
        self.y = np.sin(self.x)
        self.line, = self.ax.plot(self.x, self.y)
        self.ax.set_title("Efficient Plot - how2matplotlib.com")

        self.fig.canvas.mpl_connect('button_press_event', self.on_click)

    def on_click(self, event):
        if event.inaxes == self.ax:
            self.y = np.sin(self.x + event.xdata)
            self.line.set_ydata(self.y)
            self.fig.canvas.draw_idle()

plot = EfficientPlot()
plt.show()
Output:
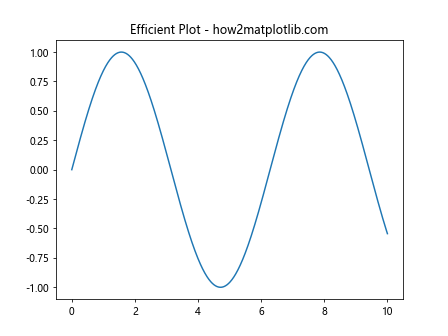
In this example, we’re updating the plot data efficiently by only changing the y-data of the existing line, rather than redrawing the entire plot. This can significantly improve performance for large datasets or frequent updates.
Providing Clear User Instructions
When creating interactive visualizations, it’s important to provide clear instructions to users. Here’s an example that demonstrates how to add user instructions to your plot:
import matplotlib.pyplot as plt

class InstructivePlot:
    def __init__(self):
        self.fig, self.ax = plt.subplots()
        self.ax.plot([1, 2, 3, 4], [1, 4, 2, 3])
        self.ax.set_title("Interactive Plot - how2matplotlib.com")

        self.instructions = self.fig.text(0.5, 0.02,
                                          "Left-click to add point, Right-click to remove",
                                          ha='center', va='center')

        self.fig.canvas.mpl_connect('button_press_event', self.on_click)

    def on_click(self, event):
        if event.button == 1:  # Left click
            self.ax.plot(event.xdata, event.ydata, 'ro')
        elif event.button == 3:  # Right click
            for artist in self.ax.get_children():
                if isinstance(artist, plt.Line2D) and artist.get_marker() == 'o':
                    if artist.contains(event)[0]:
                        artist.remove()
        self.fig.canvas.draw()

plot = InstructivePlot()
plt.show()
Output:
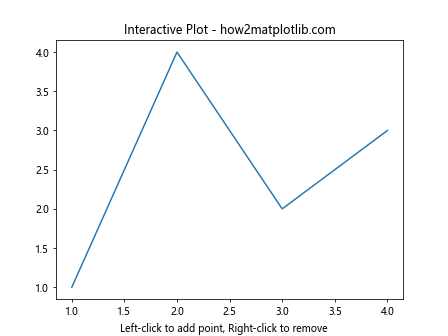
This example adds clear instructions to the plot, helping users understand how to interact with the visualization.
Advanced Topics in Event Handling in Matplotlib
As you become more comfortable with event handling in Matplotlib, you can explore more advanced topics to create even more sophisticated interactive visualizations. Let’s look at some of these advanced concepts.
Event Handling with Multiple Subplots
When working with multiple subplots, you might want to handle events differently for each subplot. Here’s an example that demonstrates event handling with multiple subplots:
import matplotlib.pyplot as plt

class MultiSubplotHandler:
    def __init__(self):
        self.fig, (self.ax1, self.ax2) = plt.subplots(1, 2)
        self.ax1.plot([1, 2, 3, 4], [1, 4, 2, 3])
        self.ax2.plot([1, 2, 3, 4], [3, 2, 4, 1])
        self.ax1.set_title("Subplot 1 - how2matplotlib.com")
        self.ax2.set_title("Subplot 2 - how2matplotlib.com")

        self.fig.canvas.mpl_connect('button_press_event', self.on_click)

    def on_click(self, event):
        if event.inaxes == self.ax1:
            print(f"Clicked in subplot 1 at ({event.xdata}, {event.ydata})")
        elif event.inaxes == self.ax2:
            print(f"Clicked in subplot 2 at ({event.xdata}, {event.ydata})")
        else:
            print("Clicked outside of subplots")

handler = MultiSubplotHandler()
plt.show()
Output:
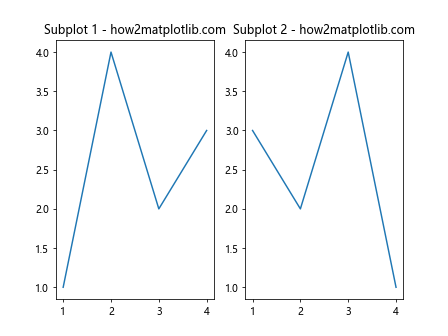
This example shows how to handle events differently for each subplot, allowing you to create more complex interactive visualizations with multiple components.
Draggable Legend
Creating a draggable legend can enhance the user experience by allowing users to reposition the legend for better visibility. Here’s an example of how to implement a draggable legend:
import matplotlib.pyplot as plt

class DraggableLegendPlot:
    def __init__(self):
        self.fig, self.ax = plt.subplots()
        self.ax.plot([1, 2, 3, 4], [1, 4, 2, 3], label='Line 1')
        self.ax.plot([1, 2, 3, 4], [3, 2, 4, 1], label='Line 2')
        self.ax.set_title("Draggable Legend - how2matplotlib.com")

        self.legend = self.ax.legend()
        self.legend.set_draggable(True)

        self.fig.canvas.mpl_connect('pick_event', self.on_pick)

    def on_pick(self, event):
        if event.artist == self.legend:
            print("Legend picked")

plot = DraggableLegendPlot()
plt.show()
Output:
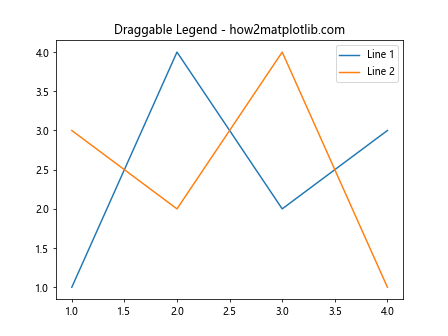
This example creates a plot with a draggable legend. Users can click and drag the legend to reposition it within the plot.
Conclusion
Event Handling in Matplotlib is a powerful tool for creating interactive and dynamic visualizations. Throughout this comprehensive guide, we’ve explored various aspects of event handling, from basic concepts to advanced techniques. We’ve covered mouse events, keyboard events, figure events, and axes events, as well as more complex topics like custom event creation and interactive data selection.
By mastering event handling in Matplotlib, you can create visualizations that respond to user input, allowing for more engaging and informative data exploration. Whether you’re building simple interactive plots or complex data analysis tools, the techniques we’ve discussed will help you leverage the full power of Matplotlib’s event handling capabilities.
Remember to follow best practices such as using meaningful function names, separating event handling logic, implementing error handling, optimizing performance, and providing clear user instructions. These practices will help you create robust, efficient, and user-friendly interactive visualizations.