How to Create a Cumulative Histogram in Matplotlib
Create a cumulative histogram in Matplotlib is an essential skill for data visualization and analysis. This article will provide a detailed exploration of creating cumulative histograms using Matplotlib, one of the most popular plotting libraries in Python. We’ll cover various aspects of cumulative histograms, from basic concepts to advanced techniques, and provide numerous examples to help you master this powerful visualization tool.
Understanding Cumulative Histograms
Before we dive into creating a cumulative histogram in Matplotlib, let’s first understand what a cumulative histogram is and why it’s useful.
A cumulative histogram is a graphical representation of the cumulative frequency distribution of a dataset. Unlike a regular histogram, which shows the frequency of data points falling into each bin, a cumulative histogram displays the running total of all frequencies up to each bin. This makes it particularly useful for visualizing the distribution of data and identifying percentiles.
To create a cumulative histogram in Matplotlib, we’ll use the hist() function with the cumulative=True parameter. Let’s start with a simple example:
import matplotlib.pyplot as plt
import numpy as np

# Generate sample data
data = np.random.normal(0, 1, 1000)

# Create a cumulative histogram
plt.hist(data, bins=30, cumulative=True, density=True, label='Cumulative')
plt.title('How to Create a Cumulative Histogram in Matplotlib')
plt.xlabel('Value')
plt.ylabel('Cumulative Frequency')
plt.legend()
plt.text(0.5, 0.5, 'how2matplotlib.com', transform=plt.gca().transAxes)
plt.show()
Output:
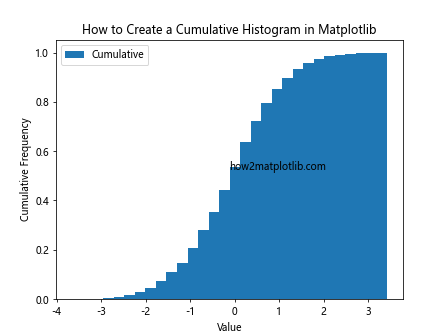
In this example, we generate random data from a normal distribution and create a cumulative histogram using Matplotlib. The cumulative=True parameter tells Matplotlib to create a cumulative histogram instead of a regular one.
Customizing Cumulative Histograms
Now that we’ve created a basic cumulative histogram, let’s explore how to customize it to better suit our needs.
Adjusting Bin Size
The number of bins in a histogram can significantly affect its appearance and interpretation. To create a cumulative histogram in Matplotlib with a specific number of bins, we can use the bins parameter:
import matplotlib.pyplot as plt
import numpy as np

data = np.random.exponential(scale=2, size=1000)

plt.hist(data, bins=50, cumulative=True, density=True, label='50 bins')
plt.title('Create a Cumulative Histogram in Matplotlib with Custom Bins')
plt.xlabel('Value')
plt.ylabel('Cumulative Frequency')
plt.legend()
plt.text(0.5, 0.5, 'how2matplotlib.com', transform=plt.gca().transAxes)
plt.show()
Output:
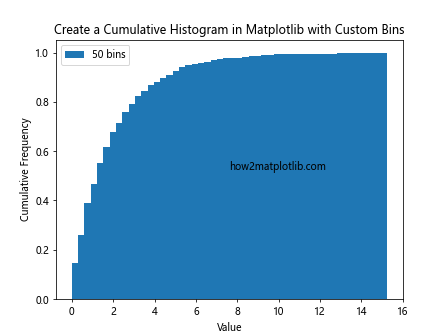
This example creates a cumulative histogram with 50 bins using exponentially distributed data.
Changing Histogram Style
Matplotlib offers various styles for histograms. To create a cumulative histogram in Matplotlib with a different style, we can use the histtype parameter:
import matplotlib.pyplot as plt
import numpy as np

data = np.random.gamma(2, 2, 1000)

plt.hist(data, bins=30, cumulative=True, density=True, histtype='step', label='Step')
plt.title('Create a Cumulative Histogram in Matplotlib with Step Style')
plt.xlabel('Value')
plt.ylabel('Cumulative Frequency')
plt.legend()
plt.text(0.5, 0.5, 'how2matplotlib.com', transform=plt.gca().transAxes)
plt.show()
Output:
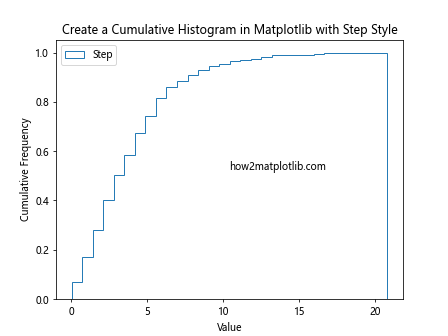
This example creates a cumulative histogram using the ‘step’ style, which displays the histogram as a single line.
Adding Multiple Datasets
To compare multiple datasets, we can create a cumulative histogram in Matplotlib with multiple histograms on the same plot:
import matplotlib.pyplot as plt
import numpy as np

data1 = np.random.normal(0, 1, 1000)
data2 = np.random.normal(2, 1.5, 1000)

plt.hist(data1, bins=30, cumulative=True, density=True, alpha=0.7, label='Dataset 1')
plt.hist(data2, bins=30, cumulative=True, density=True, alpha=0.7, label='Dataset 2')
plt.title('Create a Cumulative Histogram in Matplotlib with Multiple Datasets')
plt.xlabel('Value')
plt.ylabel('Cumulative Frequency')
plt.legend()
plt.text(0.5, 0.5, 'how2matplotlib.com', transform=plt.gca().transAxes)
plt.show()
Output:
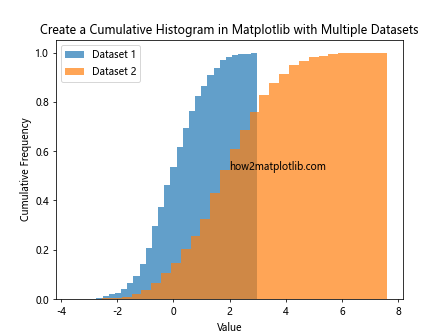
This example creates two cumulative histograms on the same plot, allowing for easy comparison between datasets.
Advanced Techniques for Cumulative Histograms
Let’s explore some more advanced techniques to create a cumulative histogram in Matplotlib.
Logarithmic Scale
For datasets with a wide range of values, a logarithmic scale can be useful. Here’s how to create a cumulative histogram in Matplotlib with a logarithmic y-axis:
import matplotlib.pyplot as plt
import numpy as np

data = np.random.lognormal(0, 1, 1000)

plt.hist(data, bins=50, cumulative=True, density=True)
plt.yscale('log')
plt.title('Create a Cumulative Histogram in Matplotlib with Log Scale')
plt.xlabel('Value')
plt.ylabel('Cumulative Frequency (log scale)')
plt.text(0.5, 0.5, 'how2matplotlib.com', transform=plt.gca().transAxes)
plt.show()
Output:
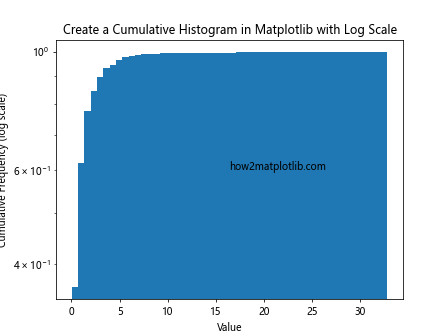
This example creates a cumulative histogram with a logarithmic y-axis, which can be helpful for visualizing data with exponential growth.
Reverse Cumulative Histogram
Sometimes, it’s useful to create a reverse cumulative histogram, which shows the probability of a value being greater than or equal to each bin. Here’s how to create a cumulative histogram in Matplotlib with reverse cumulative distribution:
import matplotlib.pyplot as plt
import numpy as np

data = np.random.weibull(1.5, 1000)

plt.hist(data, bins=30, cumulative=-1, density=True, label='Reverse Cumulative')
plt.title('Create a Cumulative Histogram in Matplotlib (Reverse)')
plt.xlabel('Value')
plt.ylabel('Reverse Cumulative Frequency')
plt.legend()
plt.text(0.5, 0.5, 'how2matplotlib.com', transform=plt.gca().transAxes)
plt.show()
Output:
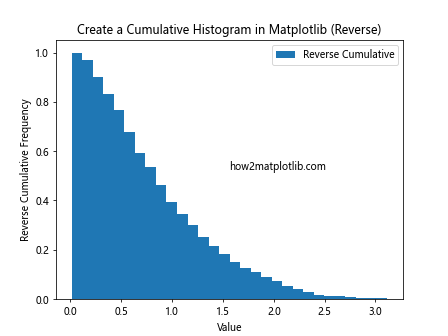
In this example, we use cumulative=-1 to create a reverse cumulative histogram.
Stacked Cumulative Histogram
For categorical data, we can create a stacked cumulative histogram in Matplotlib:
import matplotlib.pyplot as plt
import numpy as np

categories = ['A', 'B', 'C', 'D']
data1 = np.random.randint(10, 50, 4)
data2 = np.random.randint(10, 50, 4)

plt.hist([data1, data2], bins=4, cumulative=True, density=True, label=['Group 1', 'Group 2'])
plt.title('Create a Cumulative Histogram in Matplotlib (Stacked)')
plt.xlabel('Category')
plt.ylabel('Cumulative Frequency')
plt.xticks(range(4), categories)
plt.legend()
plt.text(0.5, 0.5, 'how2matplotlib.com', transform=plt.gca().transAxes)
plt.show()
Output:
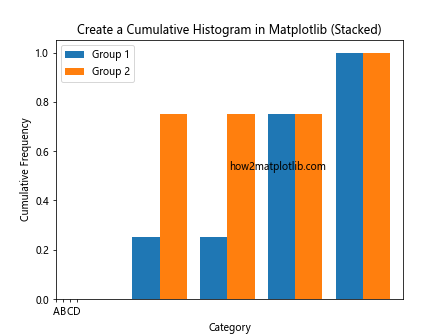
This example creates a stacked cumulative histogram for categorical data, showing the cumulative distribution for two groups across different categories.
Customizing Appearance
To make your cumulative histograms more visually appealing and informative, let’s explore some appearance customization options.
Color and Transparency
You can customize the color and transparency of your cumulative histogram:
import matplotlib.pyplot as plt
import numpy as np

data = np.random.normal(0, 1, 1000)

plt.hist(data, bins=30, cumulative=True, density=True, color='skyblue', alpha=0.8, edgecolor='navy')
plt.title('Create a Cumulative Histogram in Matplotlib with Custom Colors')
plt.xlabel('Value')
plt.ylabel('Cumulative Frequency')
plt.text(0.5, 0.5, 'how2matplotlib.com', transform=plt.gca().transAxes)
plt.show()
Output:
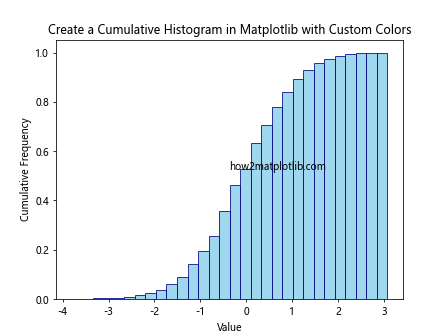
This example creates a cumulative histogram with a custom color (skyblue) and transparency (alpha=0.8), as well as a custom edge color (navy).
Grid Lines
Adding grid lines can make it easier to read values from your cumulative histogram:
import matplotlib.pyplot as plt
import numpy as np

data = np.random.gamma(2, 2, 1000)

plt.hist(data, bins=30, cumulative=True, density=True)
plt.grid(True, linestyle='--', alpha=0.7)
plt.title('Create a Cumulative Histogram in Matplotlib with Grid Lines')
plt.xlabel('Value')
plt.ylabel('Cumulative Frequency')
plt.text(0.5, 0.5, 'how2matplotlib.com', transform=plt.gca().transAxes)
plt.show()
Output:
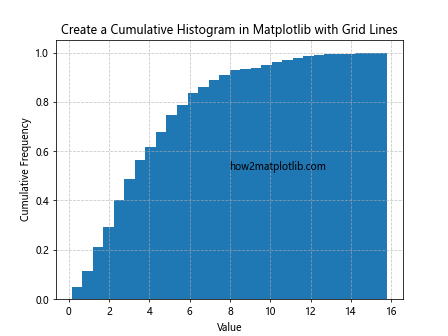
This example adds dashed grid lines to the cumulative histogram, making it easier to read specific values.
Custom Tick Labels
You can customize the tick labels on your axes for better readability:
import matplotlib.pyplot as plt
import numpy as np

data = np.random.exponential(scale=2, size=1000)

plt.hist(data, bins=30, cumulative=True, density=True)
plt.title('Create a Cumulative Histogram in Matplotlib with Custom Ticks')
plt.xlabel('Value')
plt.ylabel('Cumulative Frequency')
plt.xticks(np.arange(0, 15, 2))
plt.yticks(np.arange(0, 1.1, 0.1))
plt.text(0.5, 0.5, 'how2matplotlib.com', transform=plt.gca().transAxes)
plt.show()
Output:
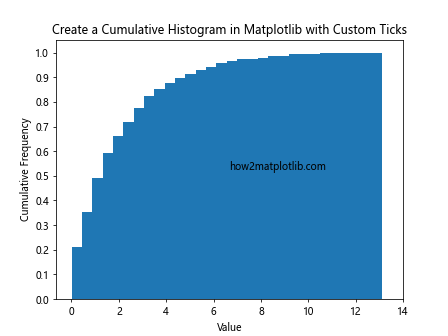
This example sets custom tick locations for both the x and y axes, making the scale more intuitive.
Analyzing Data with Cumulative Histograms
Cumulative histograms are powerful tools for data analysis. Let’s explore some ways to use them effectively.
Percentile Calculation
You can use a cumulative histogram to easily identify percentiles in your data:
import matplotlib.pyplot as plt
import numpy as np

data = np.random.normal(0, 1, 1000)

counts, bins, _ = plt.hist(data, bins=100, cumulative=True, density=True)
plt.title('Create a Cumulative Histogram in Matplotlib for Percentiles')
plt.xlabel('Value')
plt.ylabel('Cumulative Frequency')

# Find the 25th, 50th, and 75th percentiles
percentiles = [0.25, 0.5, 0.75]
for p in percentiles:
    idx = np.searchsorted(counts, p)
    plt.axvline(bins[idx], color='r', linestyle='--', label=f'{p*100}th percentile')

plt.legend()
plt.text(0.5, 0.5, 'how2matplotlib.com', transform=plt.gca().transAxes)
plt.show()
Output:
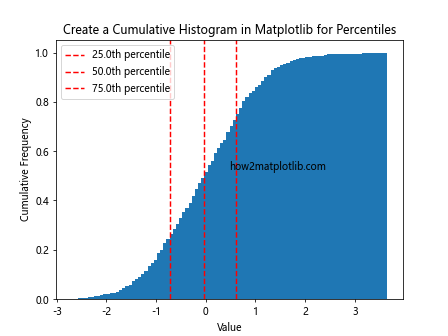
This example creates a cumulative histogram and marks the 25th, 50th, and 75th percentiles with vertical lines.
Comparing Distributions
Cumulative histograms are excellent for comparing distributions:
import matplotlib.pyplot as plt
import numpy as np

data1 = np.random.normal(0, 1, 1000)
data2 = np.random.normal(0.5, 1.5, 1000)

plt.hist(data1, bins=50, cumulative=True, density=True, alpha=0.7, label='Distribution 1')
plt.hist(data2, bins=50, cumulative=True, density=True, alpha=0.7, label='Distribution 2')
plt.title('Create a Cumulative Histogram in Matplotlib to Compare Distributions')
plt.xlabel('Value')
plt.ylabel('Cumulative Frequency')
plt.legend()
plt.text(0.5, 0.5, 'how2matplotlib.com', transform=plt.gca().transAxes)
plt.show()
Output:
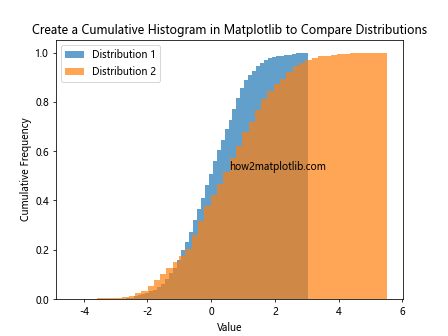
This example creates cumulative histograms for two different distributions, allowing for easy comparison of their characteristics.
Handling Large Datasets
When working with large datasets, creating a cumulative histogram in Matplotlib might require some additional considerations.
Binning Strategy
For large datasets, choosing the right binning strategy is crucial:
import matplotlib.pyplot as plt
import numpy as np

data = np.random.normal(0, 1, 1000000)

plt.hist(data, bins='auto', cumulative=True, density=True)
plt.title('Create a Cumulative Histogram in Matplotlib with Auto Bins')
plt.xlabel('Value')
plt.ylabel('Cumulative Frequency')
plt.text(0.5, 0.5, 'how2matplotlib.com', transform=plt.gca().transAxes)
plt.show()
Output:
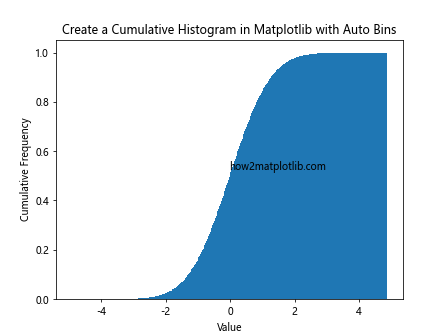
This example uses the ‘auto’ binning strategy, which automatically determines the optimal number of bins based on the data.
Subsampling
For extremely large datasets, you might want to subsample your data:
import matplotlib.pyplot as plt
import numpy as np

data = np.random.normal(0, 1, 1000000)
subsample = np.random.choice(data, size=10000, replace=False)

plt.hist(subsample, bins=50, cumulative=True, density=True)
plt.title('Create a Cumulative Histogram in Matplotlib with Subsampled Data')
plt.xlabel('Value')
plt.ylabel('Cumulative Frequency')
plt.text(0.5, 0.5, 'how2matplotlib.com', transform=plt.gca().transAxes)
plt.show()
Output:
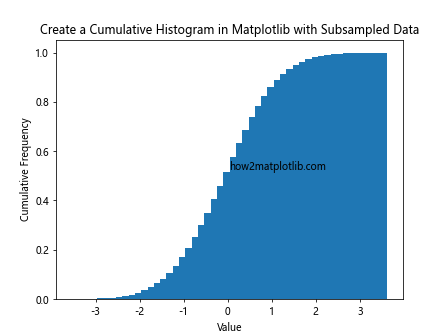
This example creates a cumulative histogram using a random subsample of the original large dataset.
Combining with Other Plot Types
Cumulative histograms can be combined with other plot types for more comprehensive visualizations.
Cumulative Histogram with KDE
You can overlay a Kernel Density Estimation (KDE) plot on your cumulative histogram:
import matplotlib.pyplot as plt
import numpy as np
from scipy import stats

data = np.random.normal(0, 1, 1000)

plt.hist(data, bins=30, cumulative=True, density=True, alpha=0.7, label='Cumulative Histogram')
kde = stats.gaussian_kde(data)
x = np.linspace(data.min(), data.max(), 100)
plt.plot(x, np.cumsum(kde(x))/sum(kde(x)), 'r-', label='KDE')
plt.title('Create a Cumulative Histogram in Matplotlib with KDE')
plt.xlabel('Value')
plt.ylabel('Cumulative Frequency')
plt.legend()
plt.text(0.5, 0.5, 'how2matplotlib.com', transform=plt.gca().transAxes)
plt.show()
Output:
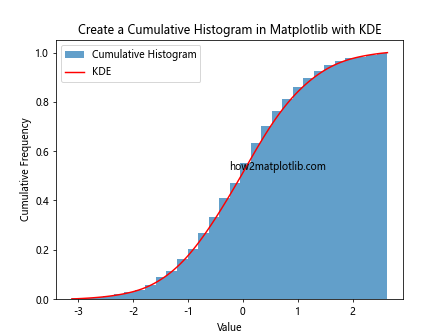
This example creates a cumulative histogram and overlays a cumulative KDE plot for comparison.
Cumulative Histogram with Box Plot
Combining a cumulative histogram with a box plot can provide a comprehensive view of your data:
import matplotlib.pyplot as plt
import numpy as np

data = np.random.normal(0, 1, 1000)

fig, (ax1, ax2) = plt.subplots(2, 1, figsize=(8, 10), sharex=True)

ax1.hist(data, bins=30, cumulative=True, density=True)
ax1.set_title('Create a Cumulative Histogram in Matplotlib with Box Plot')
ax1.set_ylabel('Cumulative Frequency')

ax2.boxplot(data, vert=False)ax2.set_xlabel('Value')
plt.text(0.5, 0.5, 'how2matplotlib.com', transform=fig.transFigure)
plt.tight_layout()
plt.show()
This example creates a figure with two subplots: a cumulative histogram on top and a box plot below, providing multiple perspectives on the same dataset.
Best Practices for Creating Cumulative Histograms
When you create a cumulative histogram in Matplotlib, it’s important to follow some best practices to ensure your visualizations are effective and informative.
Choose Appropriate Bin Sizes
The choice of bin size can significantly affect the appearance and interpretation of your cumulative histogram. Here’s an example comparing different bin sizes:
import matplotlib.pyplot as plt
import numpy as np

data = np.random.normal(0, 1, 1000)

fig, axs = plt.subplots(2, 2, figsize=(12, 10))
bin_sizes = [10, 30, 50, 100]

for ax, bins in zip(axs.ravel(), bin_sizes):
    ax.hist(data, bins=bins, cumulative=True, density=True)
    ax.set_title(f'Create a Cumulative Histogram in Matplotlib ({bins} bins)')
    ax.set_xlabel('Value')
    ax.set_ylabel('Cumulative Frequency')

plt.tight_layout()
plt.text(0.5, 0.5, 'how2matplotlib.com', transform=fig.transFigure)
plt.show()
Output:
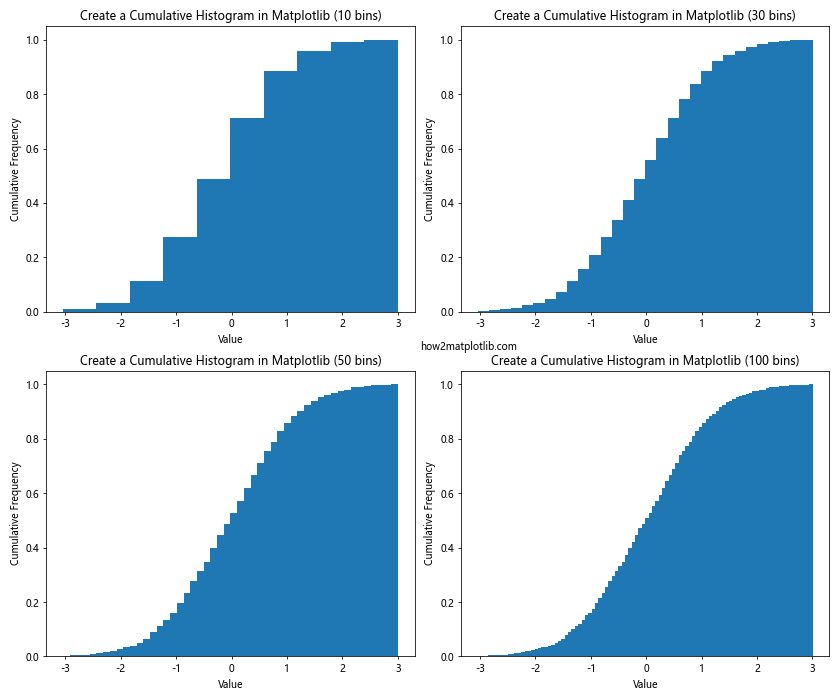
This example creates four cumulative histograms with different numbers of bins, allowing you to compare how bin size affects the visualization.
Use Appropriate Scales
Depending on your data, you may need to use different scales for your axes. Here’s an example comparing linear and logarithmic scales:
import matplotlib.pyplot as plt
import numpy as np

data = np.random.lognormal(0, 1, 1000)

fig, (ax1, ax2) = plt.subplots(1, 2, figsize=(12, 5))

ax1.hist(data, bins=50, cumulative=True, density=True)
ax1.set_title('Create a Cumulative Histogram in Matplotlib (Linear Scale)')
ax1.set_xlabel('Value')
ax1.set_ylabel('Cumulative Frequency')

ax2.hist(data, bins=50, cumulative=True, density=True)
ax2.set_xscale('log')
ax2.set_title('Create a Cumulative Histogram in Matplotlib (Log Scale)')
ax2.set_xlabel('Value (log scale)')
ax2.set_ylabel('Cumulative Frequency')

plt.tight_layout()
plt.text(0.5, 0.5, 'how2matplotlib.com', transform=fig.transFigure)
plt.show()
Output:
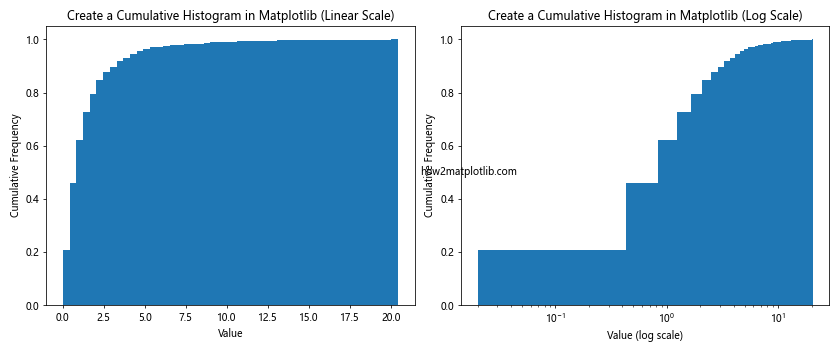
This example creates two cumulative histograms of the same lognormal data, one with a linear x-axis and one with a logarithmic x-axis.
Include Clear Labels and Titles
Always include clear, descriptive labels and titles when you create a cumulative histogram in Matplotlib:
import matplotlib.pyplot as plt
import numpy as np

data = np.random.normal(0, 1, 1000)

plt.figure(figsize=(10, 6))
plt.hist(data, bins=30, cumulative=True, density=True)
plt.title('Create a Cumulative Histogram in Matplotlib: Normal Distribution', fontsize=16)
plt.xlabel('Value', fontsize=14)
plt.ylabel('Cumulative Frequency', fontsize=14)
plt.xticks(fontsize=12)
plt.yticks(fontsize=12)
plt.text(0.5, 0.5, 'how2matplotlib.com', transform=plt.gca().transAxes)
plt.show()
Output:
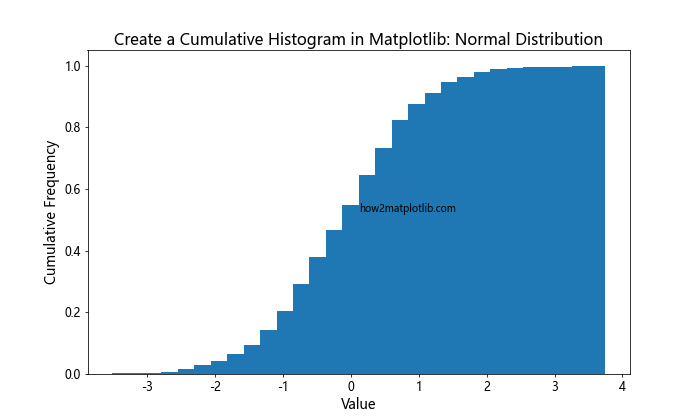
This example demonstrates how to add clear, well-sized labels and titles to your cumulative histogram.
Advanced Applications of Cumulative Histograms
Let’s explore some more advanced applications of cumulative histograms in data analysis and visualization.
Comparing Multiple Datasets
Cumulative histograms are excellent for comparing multiple datasets. Here’s an example comparing three different distributions:
import matplotlib.pyplot as plt
import numpy as np

data1 = np.random.normal(0, 1, 1000)
data2 = np.random.exponential(1, 1000)
data3 = np.random.uniform(-2, 2, 1000)

plt.hist(data1, bins=50, cumulative=True, density=True, alpha=0.7, label='Normal')
plt.hist(data2, bins=50, cumulative=True, density=True, alpha=0.7, label='Exponential')
plt.hist(data3, bins=50, cumulative=True, density=True, alpha=0.7, label='Uniform')
plt.title('Create a Cumulative Histogram in Matplotlib: Comparing Distributions')
plt.xlabel('Value')
plt.ylabel('Cumulative Frequency')
plt.legend()
plt.text(0.5, 0.5, 'how2matplotlib.com', transform=plt.gca().transAxes)
plt.show()
Output:
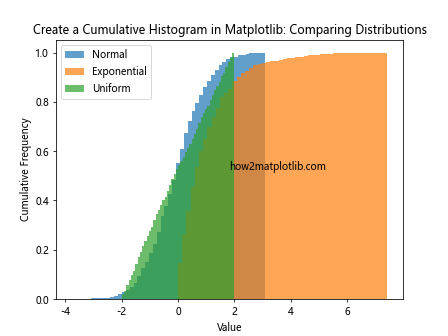
This example creates cumulative histograms for normal, exponential, and uniform distributions, allowing for easy comparison of their characteristics.
Analyzing Time Series Data
Cumulative histograms can be useful for analyzing time series data. Here’s an example using a simulated time series:
import matplotlib.pyplot as plt
import numpy as np

np.random.seed(42)
time = np.arange(365)
data = np.cumsum(np.random.normal(0, 1, 365))

plt.figure(figsize=(12, 6))
plt.hist(data, bins=50, cumulative=True, density=True)
plt.title('Create a Cumulative Histogram in Matplotlib: Time Series Analysis')
plt.xlabel('Cumulative Value')
plt.ylabel('Frequency')
plt.text(0.5, 0.5, 'how2matplotlib.com', transform=plt.gca().transAxes)
plt.show()
Output:
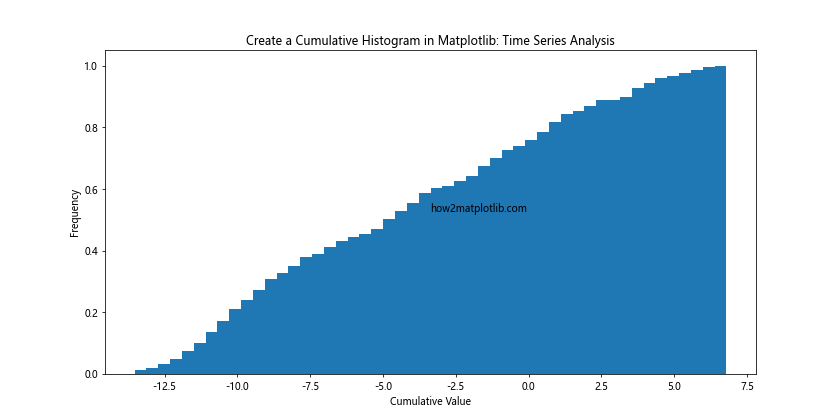
This example creates a cumulative histogram of cumulative values from a simulated time series, which can be useful for analyzing trends and patterns over time.
Visualizing Probability Distributions
Cumulative histograms are closely related to cumulative distribution functions (CDFs) in probability theory. Here’s an example comparing an empirical CDF (cumulative histogram) with a theoretical CDF:
import matplotlib.pyplot as plt
import numpy as np
from scipy import stats

data = np.random.normal(0, 1, 1000)

plt.hist(data, bins=50, cumulative=True, density=True, alpha=0.7, label='Empirical CDF')
x = np.linspace(-4, 4, 100)
plt.plot(x, stats.norm.cdf(x), 'r-', label='Theoretical CDF')
plt.title('Create a Cumulative Histogram in Matplotlib: Empirical vs Theoretical CDF')
plt.xlabel('Value')
plt.ylabel('Cumulative Probability')
plt.legend()
plt.text(0.5, 0.5, 'how2matplotlib.com', transform=plt.gca().transAxes)
plt.show()
Output:
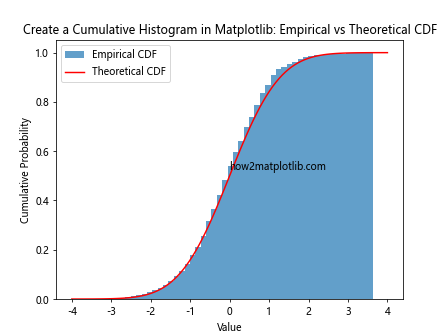
This example creates a cumulative histogram of normally distributed data and overlays the theoretical cumulative distribution function for comparison.
Troubleshooting Common Issues
When you create a cumulative histogram in Matplotlib, you might encounter some common issues. Let’s address a few of these and how to resolve them.
Dealing with Outliers
Outliers can sometimes skew your cumulative histogram. Here’s how to handle them:
import matplotlib.pyplot as plt
import numpy as np

data = np.random.normal(0, 1, 1000)
data = np.append(data, [10, -10])  # Add outliers

fig, (ax1, ax2) = plt.subplots(1, 2, figsize=(12, 5))

ax1.hist(data, bins=50, cumulative=True, density=True)
ax1.set_title('Create a Cumulative Histogram in Matplotlib with Outliers')
ax1.set_xlabel('Value')
ax1.set_ylabel('Cumulative Frequency')

q1, q3 = np.percentile(data, [25, 75])
iqr = q3 - q1
lower_bound = q1 - (1.5 * iqr)
upper_bound = q3 + (1.5 * iqr)
filtered_data = data[(data >= lower_bound) & (data <= upper_bound)]

ax2.hist(filtered_data, bins=50, cumulative=True, density=True)
ax2.set_title('Create a Cumulative Histogram in Matplotlib without Outliers')
ax2.set_xlabel('Value')
ax2.set_ylabel('Cumulative Frequency')

plt.tight_layout()
plt.text(0.5, 0.5, 'how2matplotlib.com', transform=fig.transFigure)
plt.show()
Output:
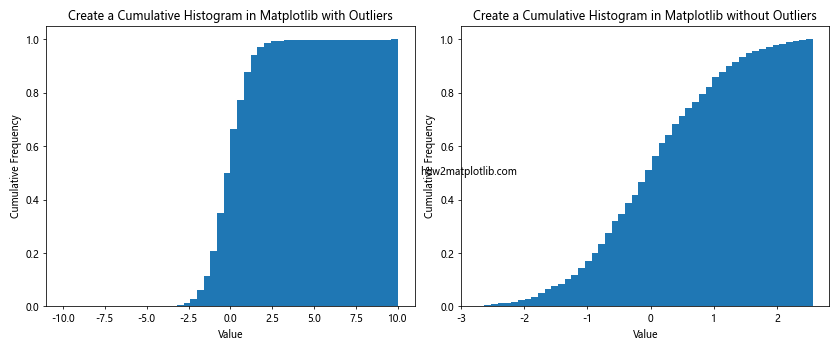
This example shows how to create cumulative histograms with and without outliers, using the interquartile range method to filter out extreme values.
Handling Unequal Bin Widths
Sometimes, you might want to use unequal bin widths. Here's how to handle this situation:
import matplotlib.pyplot as plt
import numpy as np

data = np.random.lognormal(0, 1, 1000)

bins = [0, 1, 2, 5, 10, 20, 50, 100]
plt.hist(data, bins=bins, cumulative=True, density=True)
plt.title('Create a Cumulative Histogram in Matplotlib with Unequal Bin Widths')
plt.xlabel('Value (log scale)')
plt.ylabel('Cumulative Frequency')
plt.xscale('log')
plt.text(0.5, 0.5, 'how2matplotlib.com', transform=plt.gca().transAxes)
plt.show()
Output:
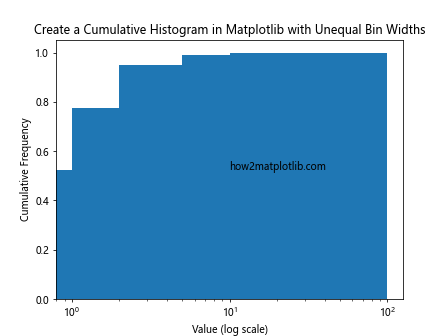
This example creates a cumulative histogram with custom, unequal bin widths, which can be useful for data with a wide range of values.
Conclusion
Creating a cumulative histogram in Matplotlib is a powerful tool for data analysis and visualization. Throughout this article, we've explored various aspects of cumulative histograms, from basic concepts to advanced techniques. We've covered how to create and customize cumulative histograms, how to use them for data analysis, and how to handle common issues that may arise.
Remember, when you create a cumulative histogram in Matplotlib, consider the following key points:
- Choose appropriate bin sizes for your data.
- Use suitable scales (linear or logarithmic) depending on your data distribution.
- Always include clear labels and titles to make your visualizations informative.
- Consider combining cumulative histograms with other plot types for more comprehensive analysis.
- Be aware of how outliers can affect your visualization and handle them appropriately.