How to Add Perpendicular Caps to Error Bars in Matplotlib
Add perpendicular caps to error bars in Matplotlib to enhance the visual representation of your data’s uncertainty. This article will provide a detailed exploration of how to add perpendicular caps to error bars in Matplotlib, covering various aspects and techniques. We’ll dive deep into the process, offering numerous examples and explanations to help you master this essential data visualization skill.
Understanding Error Bars and Perpendicular Caps in Matplotlib
Before we delve into how to add perpendicular caps to error bars in Matplotlib, let’s first understand what error bars and perpendicular caps are and why they’re important in data visualization.
Error bars in Matplotlib are graphical representations of the variability of data. They give a general idea of how precise a measurement is or how far from the reported value the true value might be. When you add perpendicular caps to error bars in Matplotlib, you’re adding short horizontal lines at the ends of the error bars, which can make them more visually distinct and easier to read.
Here’s a simple example of how to create a basic plot with error bars in Matplotlib:
import matplotlib.pyplot as plt
import numpy as np

x = np.array([1, 2, 3, 4])
y = np.array([2, 4, 6, 8])
yerr = np.array([0.5, 0.4, 0.6, 0.5])

plt.errorbar(x, y, yerr=yerr, fmt='o', capsize=5)
plt.title('Error Bars with Perpendicular Caps - how2matplotlib.com')
plt.xlabel('X-axis')
plt.ylabel('Y-axis')
plt.show()
Output:
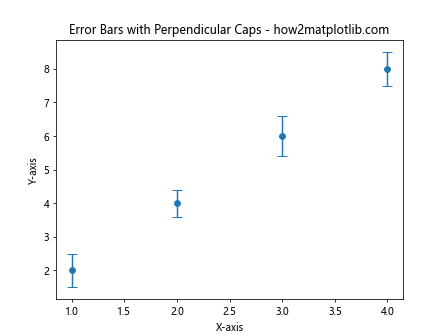
In this example, we’re creating a simple scatter plot with error bars. The capsize=5 parameter in the errorbar() function is what adds the perpendicular caps to the error bars in Matplotlib. The number 5 determines the length of the cap in points.
Why Add Perpendicular Caps to Error Bars in Matplotlib?
Adding perpendicular caps to error bars in Matplotlib serves several purposes:
- Visual Clarity: Caps make the ends of error bars more distinct, especially when multiple error bars overlap.
- Precision: Caps can help in precisely identifying the extent of the error range.
- Aesthetic Appeal: Many researchers and data scientists prefer the look of error bars with caps.
Let’s look at an example that compares error bars with and without caps:
import matplotlib.pyplot as plt
import numpy as np

x = np.array([1, 2, 3, 4])
y = np.array([2, 4, 6, 8])
yerr = np.array([0.5, 0.4, 0.6, 0.5])

fig, (ax1, ax2) = plt.subplots(1, 2, figsize=(10, 5))

ax1.errorbar(x, y, yerr=yerr, fmt='o', capsize=0)
ax1.set_title('Without Caps - how2matplotlib.com')

ax2.errorbar(x, y, yerr=yerr, fmt='o', capsize=5)
ax2.set_title('With Caps - how2matplotlib.com')

plt.tight_layout()
plt.show()
Output:
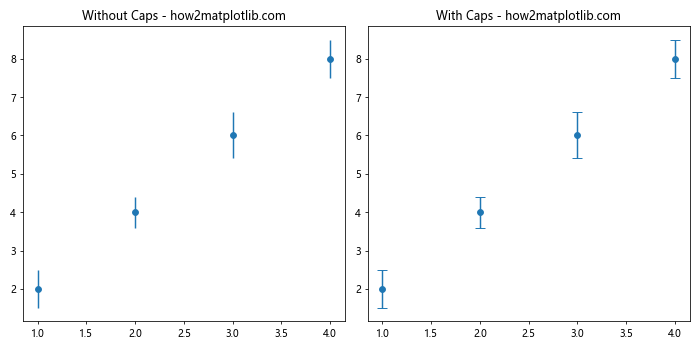
This example creates two side-by-side plots, one without caps and one with caps, allowing you to see the difference when you add perpendicular caps to error bars in Matplotlib.
Basic Syntax to Add Perpendicular Caps to Error Bars in Matplotlib
The basic syntax to add perpendicular caps to error bars in Matplotlib is straightforward. You simply need to include the capsize parameter in the errorbar() function:
plt.errorbar(x, y, yerr=yerr, fmt='o', capsize=5)
Here’s a breakdown of the parameters:
xandy: The data points for your plotyerr: The error values for the y-axisfmt: The format of the plot points (in this case, ‘o’ for circular markers)capsize: The size of the error bar caps in points
Let’s see this in action with a more detailed example:
import matplotlib.pyplot as plt
import numpy as np

x = np.linspace(0, 10, 50)
y = np.sin(x)
yerr = np.random.rand(50) * 0.1

plt.figure(figsize=(10, 6))
plt.errorbar(x, y, yerr=yerr, fmt='o', capsize=5, capthick=2, ecolor='red', markeredgecolor='blue', markerfacecolor='green')
plt.title('Sine Wave with Error Bars and Caps - how2matplotlib.com')
plt.xlabel('X-axis')
plt.ylabel('Y-axis')
plt.grid(True)
plt.show()
Output:
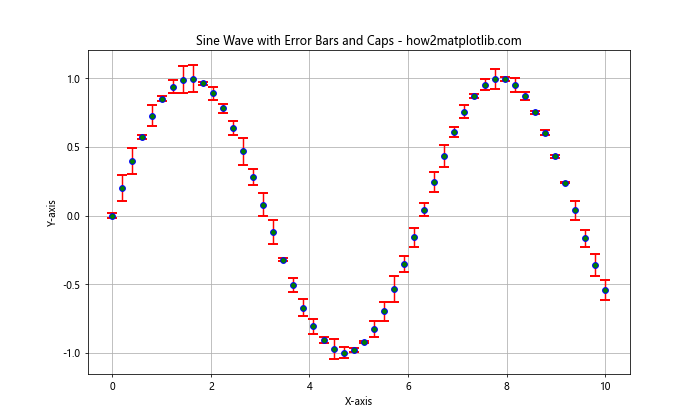
In this example, we’ve added perpendicular caps to error bars in Matplotlib for a sine wave plot. We’ve also customized various aspects of the error bars and caps, which we’ll explore in more detail in the next section.
Customizing Error Bars and Caps in Matplotlib
When you add perpendicular caps to error bars in Matplotlib, you have several options for customization. Let’s explore some of these options:
Adjusting Cap Size
The capsize parameter controls the length of the caps. Here’s an example showing different cap sizes:
import matplotlib.pyplot as plt
import numpy as np

x = np.array([1, 2, 3, 4])
y = np.array([2, 4, 6, 8])
yerr = np.array([0.5, 0.4, 0.6, 0.5])

fig, (ax1, ax2, ax3) = plt.subplots(1, 3, figsize=(15, 5))

ax1.errorbar(x, y, yerr=yerr, fmt='o', capsize=2)
ax1.set_title('Small Caps - how2matplotlib.com')

ax2.errorbar(x, y, yerr=yerr, fmt='o', capsize=5)
ax2.set_title('Medium Caps - how2matplotlib.com')

ax3.errorbar(x, y, yerr=yerr, fmt='o', capsize=10)
ax3.set_title('Large Caps - how2matplotlib.com')

plt.tight_layout()
plt.show()
Output:
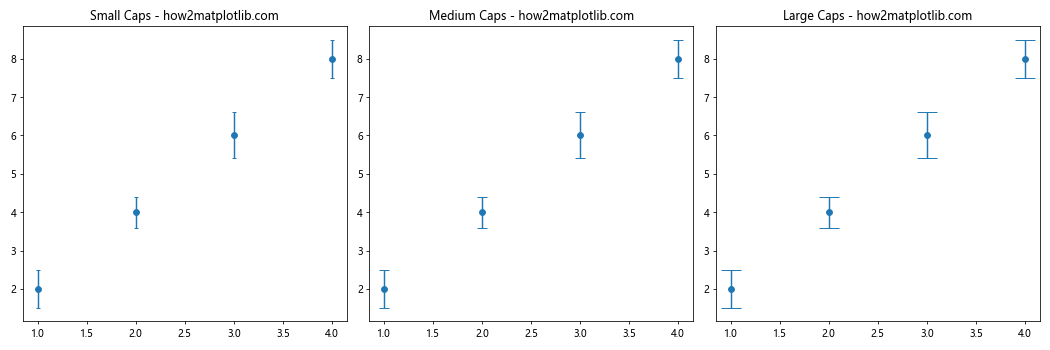
This example demonstrates how different capsize values affect the appearance when you add perpendicular caps to error bars in Matplotlib.
Changing Cap Thickness
You can adjust the thickness of the caps using the capthick parameter:
import matplotlib.pyplot as plt
import numpy as np

x = np.array([1, 2, 3, 4])
y = np.array([2, 4, 6, 8])
yerr = np.array([0.5, 0.4, 0.6, 0.5])

fig, (ax1, ax2, ax3) = plt.subplots(1, 3, figsize=(15, 5))

ax1.errorbar(x, y, yerr=yerr, fmt='o', capsize=5, capthick=1)
ax1.set_title('Thin Caps - how2matplotlib.com')

ax2.errorbar(x, y, yerr=yerr, fmt='o', capsize=5, capthick=2)
ax2.set_title('Medium Caps - how2matplotlib.com')

ax3.errorbar(x, y, yerr=yerr, fmt='o', capsize=5, capthick=3)
ax3.set_title('Thick Caps - how2matplotlib.com')

plt.tight_layout()
plt.show()
Output:
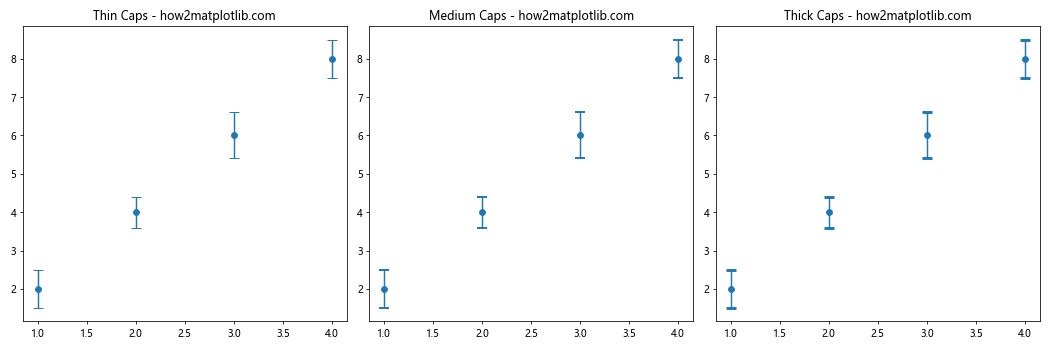
This example shows how the capthick parameter affects the appearance when you add perpendicular caps to error bars in Matplotlib.
Changing Error Bar and Cap Colors
You can change the color of the error bars and caps using the ecolor parameter:
import matplotlib.pyplot as plt
import numpy as np

x = np.array([1, 2, 3, 4])
y = np.array([2, 4, 6, 8])
yerr = np.array([0.5, 0.4, 0.6, 0.5])

fig, (ax1, ax2, ax3) = plt.subplots(1, 3, figsize=(15, 5))

ax1.errorbar(x, y, yerr=yerr, fmt='o', capsize=5, ecolor='red')
ax1.set_title('Red Error Bars - how2matplotlib.com')

ax2.errorbar(x, y, yerr=yerr, fmt='o', capsize=5, ecolor='green')
ax2.set_title('Green Error Bars - how2matplotlib.com')

ax3.errorbar(x, y, yerr=yerr, fmt='o', capsize=5, ecolor='blue')
ax3.set_title('Blue Error Bars - how2matplotlib.com')

plt.tight_layout()
plt.show()
Output:
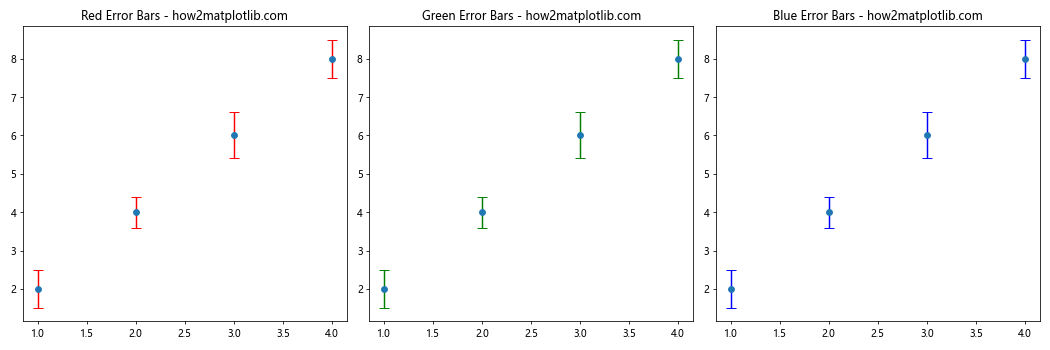
This example demonstrates how to change the color of error bars and caps when you add perpendicular caps to error bars in Matplotlib.
Adding Perpendicular Caps to Horizontal Error Bars in Matplotlib
So far, we’ve focused on vertical error bars. However, you can also add perpendicular caps to horizontal error bars in Matplotlib. Here’s how:
import matplotlib.pyplot as plt
import numpy as np

y = np.array([1, 2, 3, 4])
x = np.array([2, 4, 6, 8])
xerr = np.array([0.5, 0.4, 0.6, 0.5])

plt.figure(figsize=(8, 6))
plt.errorbar(x, y, xerr=xerr, fmt='o', capsize=5, capthick=2, ecolor='red')
plt.title('Horizontal Error Bars with Caps - how2matplotlib.com')
plt.xlabel('X-axis')
plt.ylabel('Y-axis')
plt.grid(True)
plt.show()
Output:
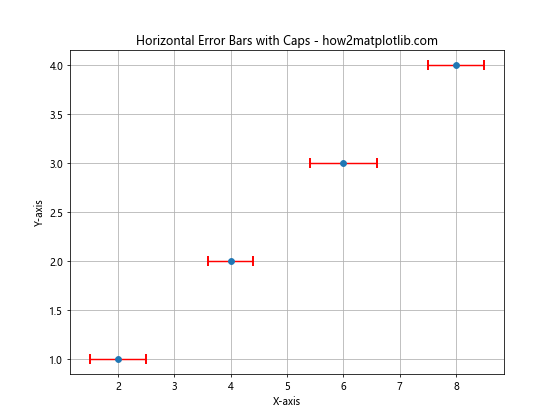
In this example, we use xerr instead of yerr to add perpendicular caps to horizontal error bars in Matplotlib.
Adding Perpendicular Caps to Both Horizontal and Vertical Error Bars in Matplotlib
You can also add perpendicular caps to both horizontal and vertical error bars in Matplotlib simultaneously:
import matplotlib.pyplot as plt
import numpy as np

x = np.array([1, 2, 3, 4])
y = np.array([2, 4, 6, 8])
xerr = np.array([0.3, 0.2, 0.4, 0.3])
yerr = np.array([0.5, 0.4, 0.6, 0.5])

plt.figure(figsize=(8, 6))
plt.errorbar(x, y, xerr=xerr, yerr=yerr, fmt='o', capsize=5, capthick=2, ecolor='red')
plt.title('Horizontal and Vertical Error Bars with Caps - how2matplotlib.com')
plt.xlabel('X-axis')
plt.ylabel('Y-axis')
plt.grid(True)
plt.show()
Output:
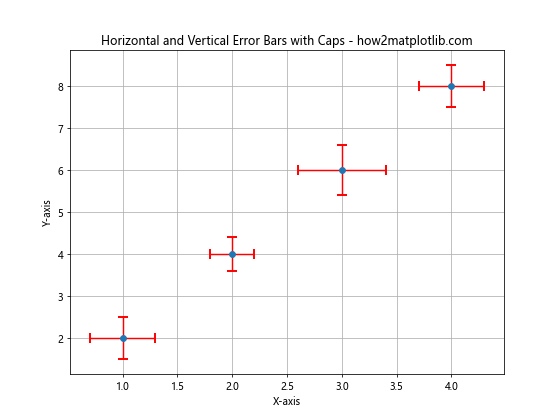
This example demonstrates how to add perpendicular caps to error bars in Matplotlib for both x and y directions.
Adding Perpendicular Caps to Asymmetric Error Bars in Matplotlib
Sometimes, your error bars might be asymmetric, meaning the upper and lower errors are different. You can still add perpendicular caps to these error bars in Matplotlib:
import matplotlib.pyplot as plt
import numpy as np

x = np.array([1, 2, 3, 4])
y = np.array([2, 4, 6, 8])
yerr = np.array([[0.1, 0.2, 0.3, 0.4], [0.2, 0.4, 0.6, 0.8]])

plt.figure(figsize=(8, 6))
plt.errorbar(x, y, yerr=yerr, fmt='o', capsize=5, capthick=2, ecolor='red')
plt.title('Asymmetric Error Bars with Caps - how2matplotlib.com')
plt.xlabel('X-axis')
plt.ylabel('Y-axis')
plt.grid(True)
plt.show()
Output:
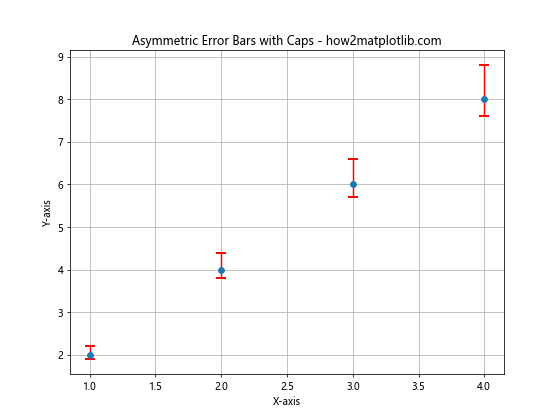
In this example, yerr is a 2D array where the first row represents the lower errors and the second row represents the upper errors.
Adding Perpendicular Caps to Error Bars in Matplotlib Scatter Plots
Scatter plots are another common type of plot where you might want to add perpendicular caps to error bars in Matplotlib:
import matplotlib.pyplot as plt
import numpy as np

x = np.random.rand(20)
y = np.random.rand(20)
xerr = np.random.rand(20) * 0.1
yerr = np.random.rand(20) * 0.1

plt.figure(figsize=(8, 6))
plt.scatter(x, y)
plt.errorbar(x, y, xerr=xerr, yerr=yerr, fmt='none', capsize=5, capthick=2, ecolor='red')
plt.title('Scatter Plot with Error Bars and Caps - how2matplotlib.com')
plt.xlabel('X-axis')
plt.ylabel('Y-axis')
plt.grid(True)
plt.show()
Output:
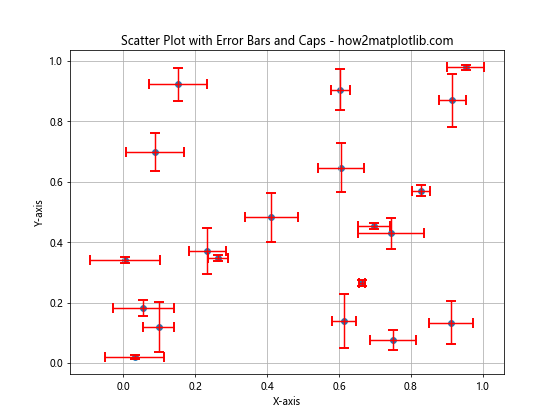
In this example, we first create a scatter plot, then add error bars with perpendicular caps on top of it.
Adding Perpendicular Caps to Error Bars in Matplotlib for Multiple Data Series
When working with multiple data series, you might want to add perpendicular caps to error bars in Matplotlib for each series:
import matplotlib.pyplot as plt
import numpy as np

x = np.array([1, 2, 3, 4])
y1 = np.array([2, 4, 6, 8])
y2 = np.array([1, 3, 5, 7])
yerr1 = np.array([0.5, 0.4, 0.6, 0.5])
yerr2 = np.array([0.3, 0.5, 0.2, 0.4])

plt.figure(figsize=(8, 6))
plt.errorbar(x, y1, yerr=yerr1, fmt='o-', capsize=5, capthick=2, label='Series 1')
plt.errorbar(x, y2, yerr=yerr2, fmt='s-', capsize=5, capthick=2, label='Series 2')
plt.title('Multiple Series with Error Bars and Caps - how2matplotlib.com')
plt.xlabel('X-axis')
plt.ylabel('Y-axis')
plt.legend()
plt.grid(True)
plt.show()
Output:
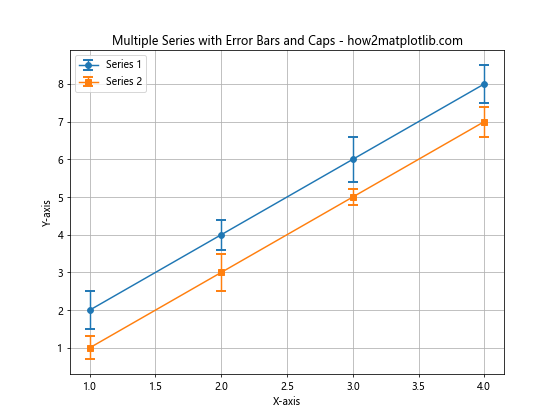
This example demonstrates how to add perpendicular caps to error bars in Matplotlib for two different data series.
Adding Perpendicular Caps to Error Bars in Matplotlib Subplots
When working with subplots, you can add perpendicular caps to error bars in Matplotlib for each subplot:
import matplotlib.pyplot as plt
import numpy as np

x = np.array([1, 2, 3, 4])
y1 = np.array([2, 4, 6, 8])
y2 = np.array([1, 3, 5, 7])
yerr1 = np.array([0.5, 0.4, 0.6, 0.5])
yerr2 = np.array([0.3, 0.5, 0.2, 0.4])

fig, (ax1, ax2) = plt.subplots(1, 2, figsize=(12, 5))

ax1.errorbar(x, y1, yerr=yerr1, fmt='o-', capsize=5, capthick=2)
ax1.set_title('Subplot 1 - how2matplotlib.com')
ax1.set_xlabel('X-axis')
ax1.set_ylabel('Y-axis')
ax1.grid(True)

ax2.errorbar(x, y2, yerr=yerr2, fmt='s-', capsize=5, capthick=2)
ax2.set_title('Subplot 2 - how2matplotlib.com')
ax2.set_xlabel('X-axis')
ax2.set_ylabel('Y-axis')
ax2.grid(True)

plt.tight_layout()
plt.show()
Output:
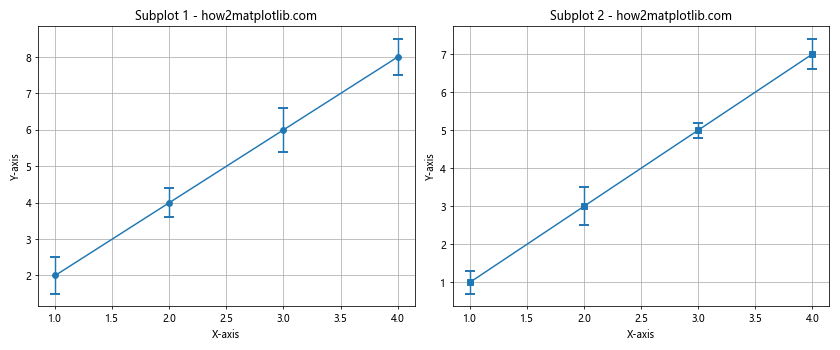
This example shows how to add perpendicular caps to error bars in Matplotlib for two separate subplots.
Advanced Techniques to Add Perpendicular Caps to Error Bars in Matplotlib
Now that we’ve covered the basics, let’s explore some more advanced techniques to add perpendicular caps to error bars in Matplotlib.
Customizing Cap Width Independently
While the capsize parameter sets both the width and length of the cap, you can customize the width independently using the markeredgewidth parameter:
import matplotlib.pyplot as plt
import numpy as np

x = np.array([1, 2, 3, 4])
y = np.array([2, 4, 6, 8])
yerr = np.array([0.5, 0.4, 0.6, 0.5])

plt.figure(figsize=(8, 6))
plt.errorbar(x, y, yerr=yerr, fmt='o', capsize=10, capthick=1, ecolor='red', markeredgewidth=3)
plt.title('Custom Cap Width - how2matplotlib.com')
plt.xlabel('X-axis')
plt.ylabel('Y-axis')
plt.grid(True)
plt.show()
Output:
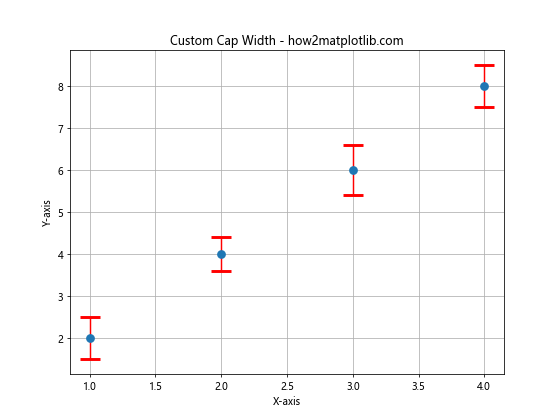
In this example, we’ve set a large capsize but a small capthick, while using a larger markeredgewidth to create wide but thin caps.
Adding Caps to Only One Side of the Error Bar
Sometimes, you might want to add perpendicular caps to error bars in Matplotlib on only one side. You can achieve this by setting the uplims and lolims parameters:
import matplotlib.pyplot as plt
import numpy as np

x = np.array([1, 2, 3, 4])
y = np.array([2, 4, 6, 8])
yerr = np.array([0.5, 0.4, 0.6, 0.5])

plt.figure(figsize=(8, 6))
plt.errorbar(x, y, yerr=yerr, fmt='o', capsize=5, capthick=2, uplims=True, lolims=False)
plt.title('Caps on Upper Limits Only - how2matplotlib.com')
plt.xlabel('X-axis')
plt.ylabel('Y-axis')
plt.grid(True)
plt.show()
Output:
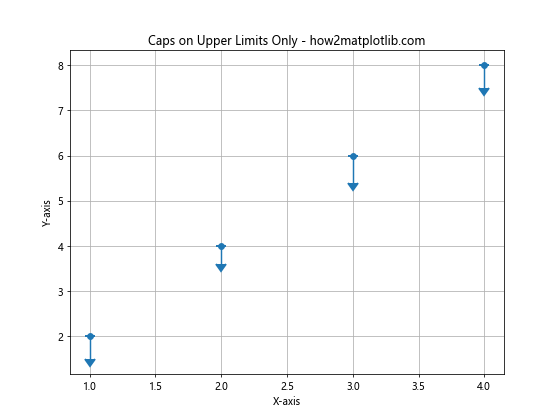
This example adds caps only to the upper limits of the error bars.
Combining Error Bars with Filled Regions
You can combine error bars with filled regions to create a more comprehensive visualization of uncertainty:
import matplotlib.pyplot as plt
import numpy as np

x = np.linspace(0, 10, 50)
y = np.sin(x)
yerr = np.random.rand(50) * 0.1

plt.figure(figsize=(10, 6))
plt.fill_between(x, y-yerr, y+yerr, alpha=0.3)
plt.errorbar(x, y, yerr=yerr, fmt='o', capsize=5, capthick=2, ecolor='red', zorder=10)
plt.title('Error Bars with Filled Region - how2matplotlib.com')
plt.xlabel('X-axis')
plt.ylabel('Y-axis')
plt.grid(True)
plt.show()
Output:
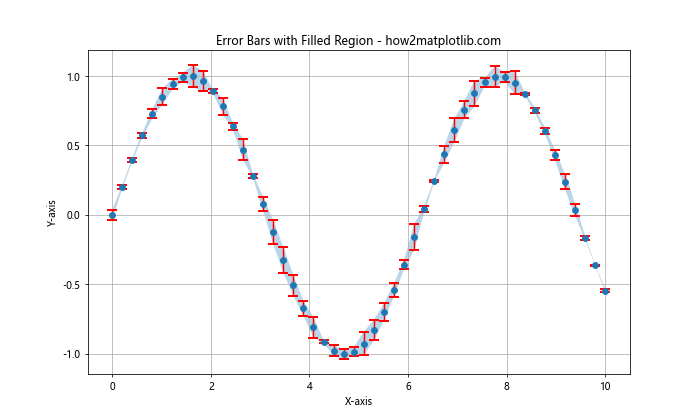
This example combines a filled region representing the error range with error bars that have perpendicular caps.
Common Issues When Adding Perpendicular Caps to Error Bars in Matplotlib
While adding perpendicular caps to error bars in Matplotlib is generally straightforward, there are a few common issues you might encounter:
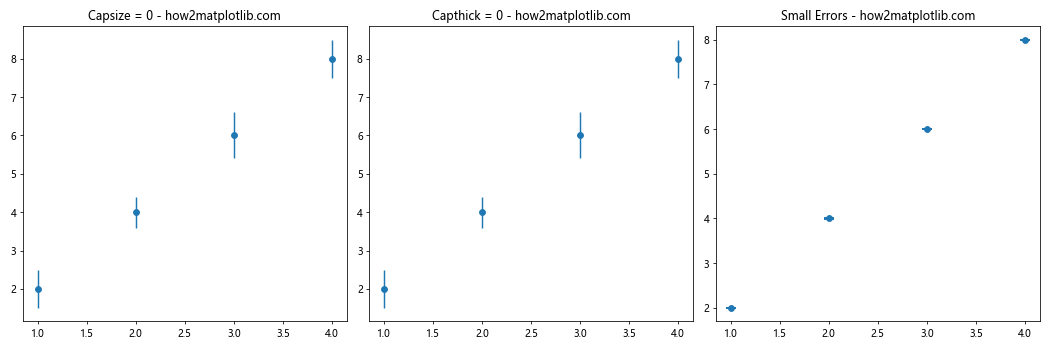
Caps Not Visible
If your caps are not visible, it could be due to one of these reasons:
- The
capsizeis set to 0 or a very small value. - The
capthickis set to 0 or a very small value. - The error values are too small relative to the scale of your plot.
Here’s an example demonstrating these issues and their solutions:
import matplotlib.pyplot as plt
import numpy as np

x = np.array([1, 2, 3, 4])
y = np.array([2, 4, 6, 8])
yerr = np.array([0.5, 0.4, 0.6, 0.5])

fig, (ax1, ax2, ax3) = plt.subplots(1, 3, figsize=(15, 5))

ax1.errorbar(x, y, yerr=yerr, fmt='o', capsize=0)
ax1.set_title('Capsize = 0 - how2matplotlib.com')

ax2.errorbar(x, y, yerr=yerr, fmt='o', capsize=5, capthick=0)
ax2.set_title('Capthick = 0 - how2matplotlib.com')

ax3.errorbar(x, y, yerr=yerr*0.01, fmt='o', capsize=5, capthick=2)
ax3.set_title('Small Errors - how2matplotlib.com')

plt.tight_layout()
plt.show()
Output:
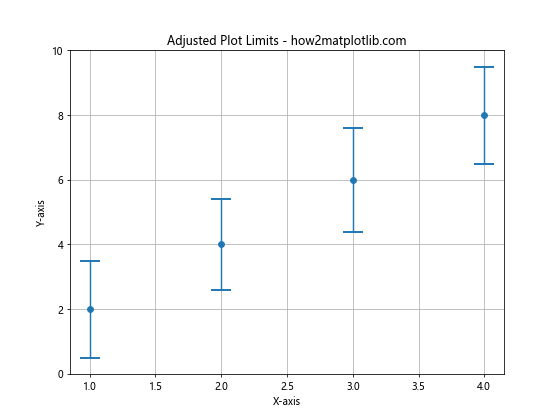
Caps Extending Beyond Plot Limits
If your caps extend beyond the plot limits, they might get cut off. You can solve this by adjusting the plot limits:
import matplotlib.pyplot as plt
import numpy as np

x = np.array([1, 2, 3, 4])
y = np.array([2, 4, 6, 8])
yerr = np.array([1.5, 1.4, 1.6, 1.5])

plt.figure(figsize=(8, 6))
plt.errorbar(x, y, yerr=yerr, fmt='o', capsize=10, capthick=2)
plt.ylim(0, 10)  # Adjust y-axis limits to accommodate caps
plt.title('Adjusted Plot Limits - how2matplotlib.com')
plt.xlabel('X-axis')
plt.ylabel('Y-axis')
plt.grid(True)
plt.show()
Output:
Caps Not Aligning with Error Bars
If your caps don’t align properly with the error bars, it might be due to conflicting settings. Ensure that you’re not using conflicting parameters like uplims and lolims unintentionally:
import matplotlib.pyplot as plt
import numpy as np

x = np.array([1, 2, 3, 4])
y = np.array([2, 4, 6, 8])
yerr = np.array([0.5, 0.4, 0.6, 0.5])

plt.figure(figsize=(8, 6))
plt.errorbar(x, y, yerr=yerr, fmt='o', capsize=5, capthick=2, uplims=True, lolims=True)
plt.title('Misaligned Caps - how2matplotlib.com')
plt.xlabel('X-axis')
plt.ylabel('Y-axis')
plt.grid(True)
plt.show()
Output:
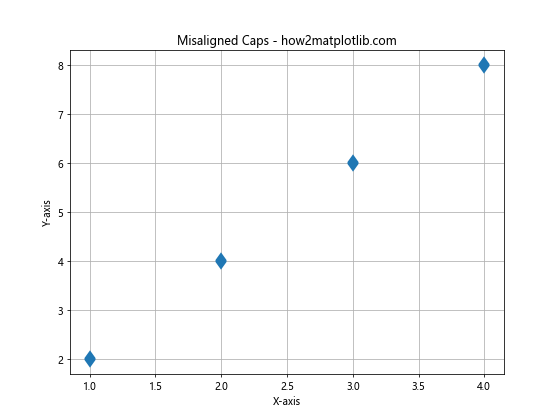
In this example, setting both uplims and lolims to True causes the caps to misalign.
Best Practices When Adding Perpendicular Caps to Error Bars in Matplotlib
To ensure your error bars with perpendicular caps are effective and visually appealing, consider these best practices:
- Choose an appropriate
capsize: Too small, and the caps may be hard to see; too large, and they may overwhelm the data points. Match
capthickto your error bar thickness: This creates a consistent look.Use contrasting colors: Make your error bars and caps stand out from your data points and background.
Consider your data scale: Adjust your error bar and cap sizes based on the scale of your data and the size of your plot.
Be consistent: If you’re using multiple plots or data series, try to keep your error bar and cap styles consistent unless you have a specific reason to differentiate them.
Here’s an example incorporating these best practices: