How to Decrease Size of Colorbar Labels in Python Matplotlib
Python Matplotlib: Decrease Size of Colorbar Labels is an essential skill for data visualization enthusiasts and professionals alike. In this comprehensive guide, we’ll explore various techniques to effectively decrease the size of colorbar labels in Matplotlib, enhancing the overall aesthetics and readability of your plots. We’ll cover everything from basic concepts to advanced customization options, providing you with the knowledge and tools to create stunning visualizations with appropriately sized colorbar labels.
Understanding Colorbars and Labels in Matplotlib
Before we dive into decreasing the size of colorbar labels, let’s first understand what colorbars and their labels are in the context of Matplotlib. A colorbar is a visual representation of the mapping between color-coded values and their corresponding numerical values. Labels on a colorbar provide context and help interpret the color-coded data in your plot.
In Matplotlib, colorbars are typically added to plots that use color-coding to represent data, such as heatmaps, contour plots, or scatter plots with color-coded points. The colorbar labels show the numerical values associated with different colors, allowing viewers to understand the relationship between color and data magnitude.
Let’s start with a basic example of creating a plot with a colorbar:
import matplotlib.pyplot as plt
import numpy as np

# Create sample data
data = np.random.rand(10, 10)

# Create a figure and axis
fig, ax = plt.subplots(figsize=(8, 6))

# Create a heatmap
im = ax.imshow(data, cmap='viridis')

# Add a colorbar
cbar = plt.colorbar(im)

# Set the title
plt.title("How2Matplotlib.com: Basic Colorbar Example")

# Show the plot
plt.show()
Output:
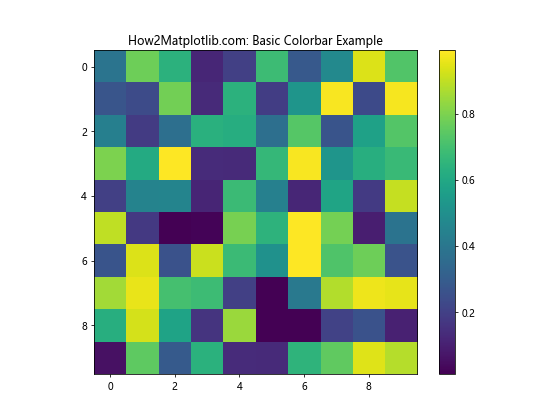
In this example, we create a simple heatmap with a colorbar. By default, Matplotlib automatically sets the size of the colorbar labels. However, in many cases, you may want to decrease the size of these labels to better fit your visualization or to emphasize other aspects of your plot.
Why Decrease the Size of Colorbar Labels?
There are several reasons why you might want to decrease the size of colorbar labels in Python Matplotlib:
- Improved aesthetics: Smaller labels can make your plot look cleaner and more professional.
- Space optimization: Reducing label size can free up space for other plot elements or allow for a larger main plot area.
- Emphasis on data: Smaller colorbar labels can help shift focus to the main plot content.
- Consistency: Matching colorbar label size with other text elements in your plot can create a more cohesive look.
- Readability: In some cases, smaller labels can actually improve readability, especially when dealing with dense colorbars or small plot sizes.
Now that we understand the importance of decreasing colorbar label size, let’s explore various methods to achieve this in Matplotlib.
Method 1: Using tick_params on the Colorbar
Another way to decrease the size of colorbar labels is by using the tick_params method on the colorbar object. This method allows you to customize various aspects of the colorbar ticks and labels, including their size.
Here’s an example:
import matplotlib.pyplot as plt
import numpy as np

# Create sample data
data = np.random.rand(10, 10)

# Create a figure and axis
fig, ax = plt.subplots(figsize=(8, 6))

# Create a heatmap
im = ax.imshow(data, cmap='viridis')

# Add a colorbar
cbar = plt.colorbar(im)

# Decrease the size of colorbar labels
cbar.ax.tick_params(labelsize=6)

# Set the title
plt.title("How2Matplotlib.com: Colorbar Labels Sized with tick_params")

# Show the plot
plt.show()
Output:
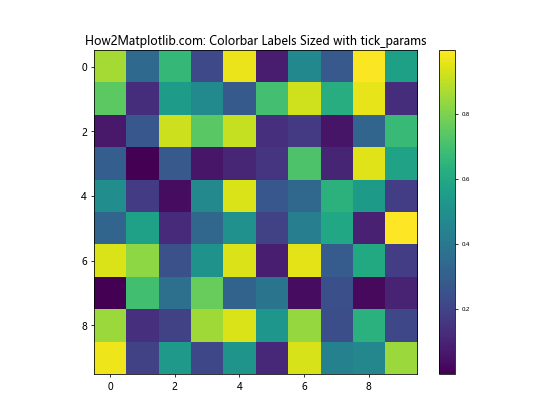
In this example, we first create the colorbar as usual, then use cbar.ax.tick_params(labelsize=6) to decrease the label size to 6 points. This method gives you more control over the colorbar appearance, as you can adjust other tick parameters simultaneously.
Method 2: Using rcParams to Set Global Font Size
If you want to decrease the size of colorbar labels globally for all plots in your script or notebook, you can use Matplotlib’s rcParams. This approach allows you to set a default font size for all text elements, including colorbar labels.
Here’s an example:
import matplotlib.pyplot as plt
import numpy as np

# Set global font size
plt.rcParams.update({'font.size': 8})

# Create sample data
data = np.random.rand(10, 10)

# Create a figure and axis
fig, ax = plt.subplots(figsize=(8, 6))

# Create a heatmap
im = ax.imshow(data, cmap='viridis')

# Add a colorbar
cbar = plt.colorbar(im)

# Set the title
plt.title("How2Matplotlib.com: Global Font Size for Colorbar Labels")

# Show the plot
plt.show()
Output:
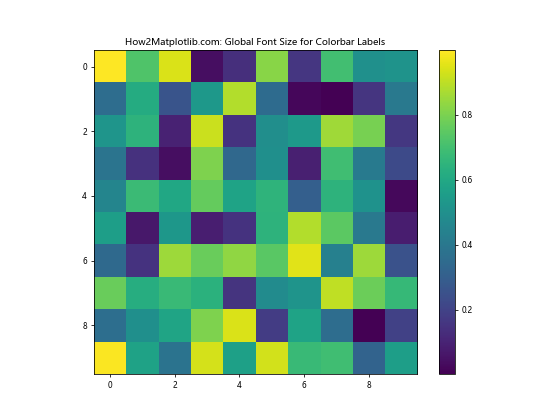
In this example, we use plt.rcParams.update({'font.size': 8}) to set the global font size to 8 points. This affects all text elements in the plot, including colorbar labels, axis labels, and titles. Note that you can still override this global setting for specific elements if needed.
Method 3: Using set_yticklabels for Fine-Grained Control
For more precise control over colorbar label size, you can use the set_yticklabels method. This approach allows you to customize each label individually, which can be useful when you want different sizes for different labels or when you want to combine size changes with other label modifications.
Here’s an example:
import matplotlib.pyplot as plt
import numpy as np

# Create sample data
data = np.random.rand(10, 10)

# Create a figure and axis
fig, ax = plt.subplots(figsize=(8, 6))

# Create a heatmap
im = ax.imshow(data, cmap='viridis')

# Add a colorbar
cbar = plt.colorbar(im)

# Get current labels
labels = cbar.ax.get_yticklabels()

# Create new labels with decreased size
new_labels = [plt.Text(t.get_position()[0], t.get_position()[1], t.get_text(), fontsize=6) for t in labels]

# Set new labels
cbar.ax.set_yticklabels(new_labels)

# Set the title
plt.title("How2Matplotlib.com: Fine-Grained Colorbar Label Sizing")

# Show the plot
plt.show()
Output:
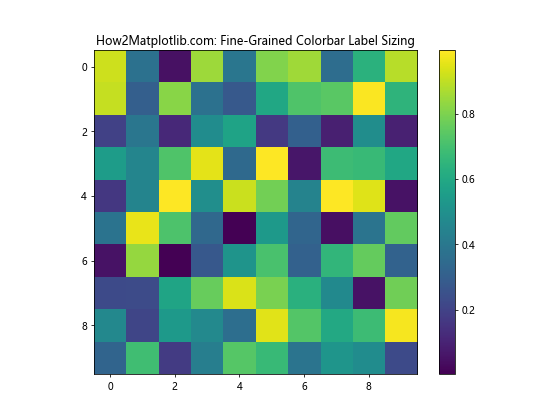
In this example, we first get the current colorbar labels using cbar.ax.get_yticklabels(). Then, we create new label objects with a decreased font size of 6 points. Finally, we set these new labels using cbar.ax.set_yticklabels(new_labels). This method gives you the most control over individual label properties.
Method 4: Using ScalarFormatter for Scientific Notation
When dealing with very large or very small numbers in your colorbar, you might want to use scientific notation to make the labels more readable. In this case, you can combine decreasing the label size with formatting the labels using ScalarFormatter.
Here’s an example:
import matplotlib.pyplot as plt
import numpy as np
from matplotlib.ticker import ScalarFormatter

# Create sample data with large values
data = np.random.rand(10, 10) * 1e6

# Create a figure and axis
fig, ax = plt.subplots(figsize=(8, 6))

# Create a heatmap
im = ax.imshow(data, cmap='viridis')

# Add a colorbar
cbar = plt.colorbar(im)

# Set scientific notation and decrease label size
formatter = ScalarFormatter(useMathText=True)
formatter.set_scientific(True)
formatter.set_powerlimits((-2, 2))
cbar.ax.yaxis.set_major_formatter(formatter)
cbar.ax.tick_params(labelsize=8)

# Set the title
plt.title("How2Matplotlib.com: Scientific Notation with Decreased Label Size")

# Show the plot
plt.show()
Output:
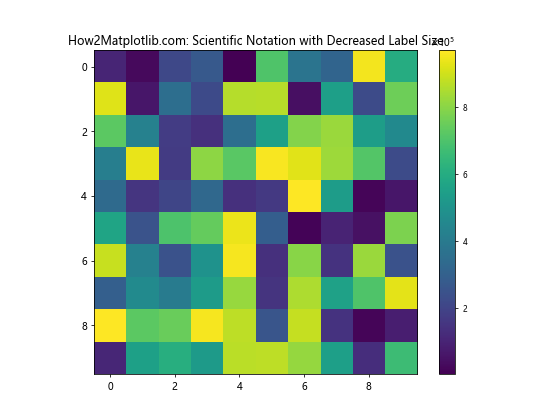
In this example, we use ScalarFormatter to format the colorbar labels in scientific notation. We then decrease the label size using cbar.ax.tick_params(labelsize=8). This combination allows for clear representation of large numbers while maintaining a compact colorbar design.
Method 5: Adjusting Colorbar Size and Position
Sometimes, decreasing the label size alone may not be sufficient to achieve the desired look. In such cases, you might want to adjust the size and position of the entire colorbar. This can help balance the proportion between the main plot and the colorbar, making the smaller labels look more appropriate.
Here’s an example:
import matplotlib.pyplot as plt
import numpy as np

# Create sample data
data = np.random.rand(10, 10)

# Create a figure and axis
fig, ax = plt.subplots(figsize=(8, 6))

# Create a heatmap
im = ax.imshow(data, cmap='viridis')

# Add a colorbar with custom size and position
cbar = plt.colorbar(im, ax=ax, fraction=0.046, pad=0.04)

# Decrease the size of colorbar labels
cbar.ax.tick_params(labelsize=6)

# Set the title
plt.title("How2Matplotlib.com: Adjusted Colorbar Size and Position")

# Show the plot
plt.show()
Output:
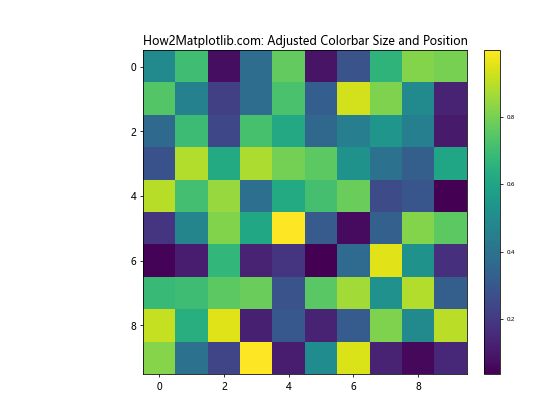
In this example, we use the fraction and pad parameters when creating the colorbar to adjust its size and position. fraction determines the width of the colorbar as a fraction of the parent axes, while pad sets the padding between the main axes and the colorbar. By making the colorbar slightly smaller and adjusting its position, we create a more balanced look with the decreased label size.
Method 6: Using LogNorm for Logarithmic Color Scaling
When working with data that spans several orders of magnitude, a logarithmic color scale can be more appropriate. In such cases, you might want to combine a logarithmic norm with decreased colorbar label size for optimal visualization.
Here’s an example:
import matplotlib.pyplot as plt
import numpy as np
from matplotlib.colors import LogNorm

# Create sample data with logarithmic distribution
data = np.random.lognormal(mean=0, sigma=2, size=(10, 10))

# Create a figure and axis
fig, ax = plt.subplots(figsize=(8, 6))

# Create a heatmap with logarithmic color scaling
im = ax.imshow(data, cmap='viridis', norm=LogNorm())

# Add a colorbar with decreased label size
cbar = plt.colorbar(im)
cbar.ax.tick_params(labelsize=7)

# Set the title
plt.title("How2Matplotlib.com: Logarithmic Colorbar with Small Labels")

# Show the plot
plt.show()
Output:
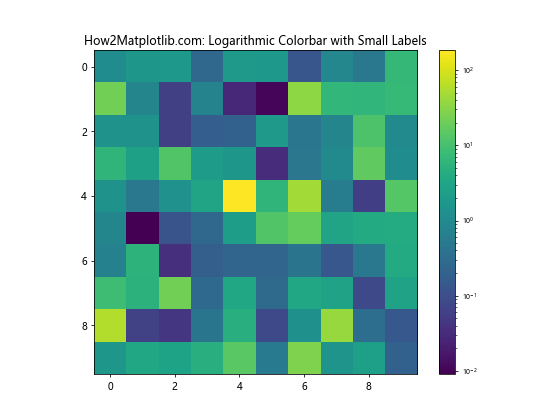
In this example, we use LogNorm() to create a logarithmic color scale. We then decrease the colorbar label size using cbar.ax.tick_params(labelsize=7). This combination allows for effective visualization of data with large value ranges while maintaining readable, compact colorbar labels.
Method 7: Custom Colorbar Ticks and Labels
In some cases, you might want to have full control over the colorbar ticks and labels. This can be particularly useful when you want to display specific values or use custom formatting. You can combine this approach with decreased label size for a tailored colorbar appearance.
Here’s an example:
import matplotlib.pyplot as plt
import numpy as np

# Create sample data
data = np.random.rand(10, 10)

# Create a figure and axis
fig, ax = plt.subplots(figsize=(8, 6))

# Create a heatmap
im = ax.imshow(data, cmap='viridis')

# Add a colorbar with custom ticks and labels
cbar = plt.colorbar(im, ticks=[0, 0.25, 0.5, 0.75, 1])
cbar.ax.set_yticklabels(['How2Matplotlib.com: Low', 'Quarter', 'Half', 'Three Quarters', 'High'], fontsize=6)

# Set the title
plt.title("How2Matplotlib.com: Custom Colorbar Labels with Decreased Size")

# Show the plot
plt.show()
Output:
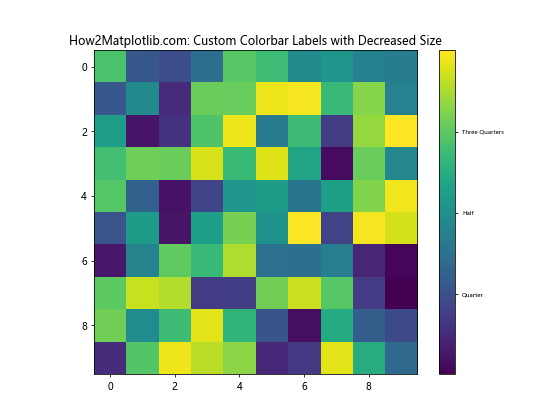
In this example, we specify custom ticks when creating the colorbar, then use set_yticklabels to set custom labels with a decreased font size. This approach gives you complete control over the content and appearance of colorbar labels.
Method 8: Colorbar Label Size in Subplots
When working with multiple subplots, you might want to decrease the size of colorbar labels consistently across all subplots. Here’s how you can achieve this:
import matplotlib.pyplot as plt
import numpy as np

# Create sample data
data1 = np.random.rand(10, 10)
data2 = np.random.rand(10, 10)

# Create a figure with two subplots
fig, (ax1, ax2) = plt.subplots(1, 2, figsize=(12, 5))

# Create heatmaps
im1 = ax1.imshow(data1, cmap='viridis')
im2 = ax2.imshow(data2, cmap='plasma')

# Add colorbars with decreased label size
cbar1 = plt.colorbar(im1, ax=ax1)
cbar2 = plt.colorbar(im2, ax=ax2)

cbar1.ax.tick_params(labelsize=6)
cbar2.ax.tick_params(labelsize=6)

# Set titles
ax1.set_title("How2Matplotlib.com: Subplot 1")
ax2.set_title("How2Matplotlib.com: Subplot 2")

# Adjust layout
plt.tight_layout()

## Show the plot
plt.show()
Output:

In this example, we create two subplots, each with its own colorbar. We then decrease the label size for both colorbars using tick_params. This ensures consistency across the entire figure while maintaining readability.
Method 9: Colorbar Label Size in 3D Plots
When working with 3D plots in Matplotlib, you may also want to decrease the size of colorbar labels. The process is similar to 2D plots, but there are some nuances to consider.
Here’s an example of how to decrease colorbar label size in a 3D surface plot:
import matplotlib.pyplot as plt
import numpy as np
from mpl_toolkits.mplot3d import Axes3D

# Create sample data
x = np.linspace(-5, 5, 50)
y = np.linspace(-5, 5, 50)
X, Y = np.meshgrid(x, y)
Z = np.sin(np.sqrt(X**2 + Y**2))

# Create a figure and 3D axis
fig = plt.figure(figsize=(10, 7))
ax = fig.add_subplot(111, projection='3d')

# Create a surface plot
surf = ax.plot_surface(X, Y, Z, cmap='viridis')

# Add a colorbar with decreased label size
cbar = fig.colorbar(surf, shrink=0.5, aspect=5)
cbar.ax.tick_params(labelsize=7)

# Set labels and title
ax.set_xlabel('X')
ax.set_ylabel('Y')
ax.set_zlabel('Z')
ax.set_title("How2Matplotlib.com: 3D Plot with Small Colorbar Labels")

# Show the plot
plt.show()
Output:
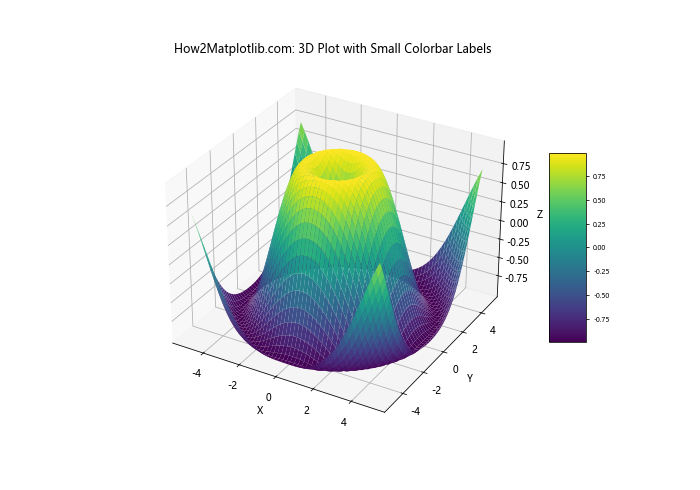
In this example, we create a 3D surface plot and add a colorbar with decreased label size. The shrink parameter in fig.colorbar() is used to adjust the size of the colorbar itself, which can be helpful in 3D plots where space might be more constrained.
Method 10: Colorbar Label Size with Discrete Color Maps
When working with discrete color maps, you might want to adjust the colorbar label size to match the discrete nature of the data. Here’s an example of how to do this:
import matplotlib.pyplot as plt
import numpy as np
from matplotlib.colors import BoundaryNorm
from matplotlib.ticker import MaxNLocator

# Create sample data
data = np.random.randint(0, 5, (10, 10))

# Create a figure and axis
fig, ax = plt.subplots(figsize=(8, 6))

# Define the color map and normalization
cmap = plt.get_cmap('viridis', 5)
norm = BoundaryNorm(np.arange(-0.5, 5.5, 1), cmap.N)

# Create a heatmap
im = ax.imshow(data, cmap=cmap, norm=norm)

# Add a colorbar with decreased label size
cbar = plt.colorbar(im, ticks=np.arange(0, 5))
cbar.ax.tick_params(labelsize=7)

# Set the colorbar label
cbar.set_label('How2Matplotlib.com Categories', fontsize=8)

# Set the title
plt.title("How2Matplotlib.com: Discrete Colorbar with Small Labels")

# Show the plot
plt.show()
Output:
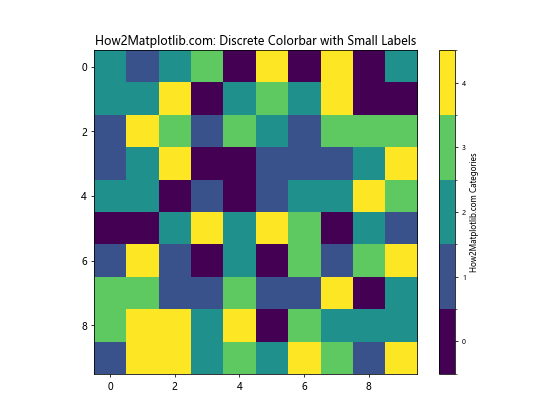
In this example, we create a discrete color map with 5 categories. We use BoundaryNorm to ensure that the colors are properly aligned with integer values. The colorbar labels are then decreased in size to match the discrete nature of the data.
Method 11: Colorbar Label Size in Polar Plots
Polar plots present unique challenges when it comes to colorbar placement and label sizing. Here’s an example of how to decrease colorbar label size in a polar plot:
import matplotlib.pyplot as plt
import numpy as np

# Create sample data
r = np.linspace(0, 2, 100)
theta = np.linspace(0, 2*np.pi, 100)
R, Theta = np.meshgrid(r, theta)
Z = R**2 * (1 - R/2) * np.cos(5*Theta)

# Create a figure and polar axis
fig, ax = plt.subplots(figsize=(8, 8), subplot_kw=dict(projection='polar'))

# Create a polar contour plot
im = ax.contourf(Theta, R, Z, cmap='viridis')

# Add a colorbar with decreased label size
cbar = plt.colorbar(im, pad=0.1)
cbar.ax.tick_params(labelsize=7)

# Set the colorbar label
cbar.set_label('How2Matplotlib.com Values', fontsize=8)

# Set the title
plt.title("How2Matplotlib.com: Polar Plot with Small Colorbar Labels")

# Show the plot
plt.show()
Output:
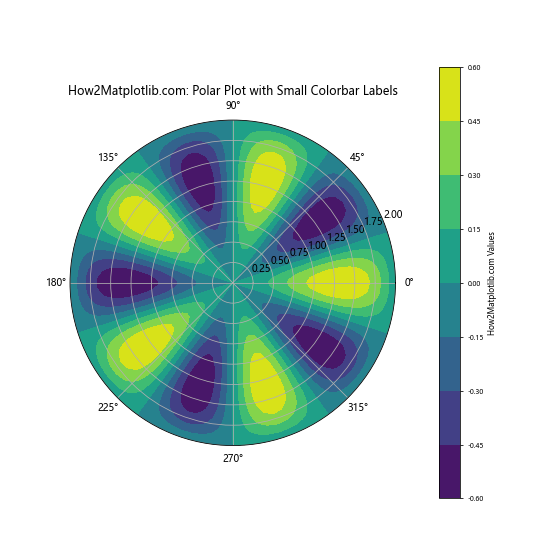
In this example, we create a polar contour plot and add a colorbar with decreased label size. The pad parameter in plt.colorbar() is used to adjust the position of the colorbar, which can be particularly important in polar plots to avoid overlap with the main plot area.
Method 12: Colorbar Label Size in Streamplot
When creating streamplots, you might want to add a colorbar to represent the stream speed or another variable. Here’s how you can decrease the colorbar label size in a streamplot:
import matplotlib.pyplot as plt
import numpy as np

# Create sample data
Y, X = np.mgrid[-3:3:100j, -3:3:100j]
U = -1 - X**2 + Y
V = 1 + X - Y**2
speed = np.sqrt(U**2 + V**2)

# Create a figure and axis
fig, ax = plt.subplots(figsize=(8, 6))

# Create a streamplot
strm = ax.streamplot(X, Y, U, V, color=speed, cmap='viridis')

# Add a colorbar with decreased label size
cbar = fig.colorbar(strm.lines)
cbar.ax.tick_params(labelsize=7)

# Set the colorbar label
cbar.set_label('How2Matplotlib.com Stream Speed', fontsize=8)

# Set the title
plt.title("How2Matplotlib.com: Streamplot with Small Colorbar Labels")

# Show the plot
plt.show()
Output:
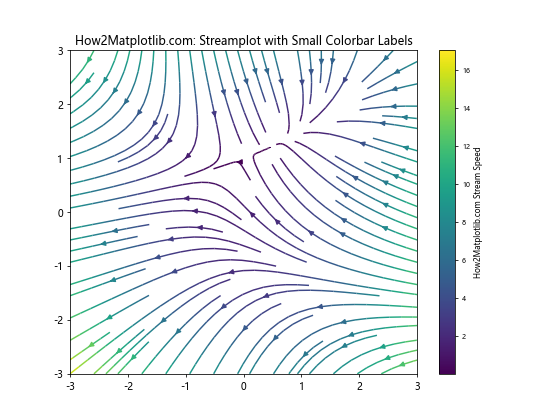
In this example, we create a streamplot where the color represents the stream speed. We then add a colorbar with decreased label size to provide a legend for the speed values.
Method 13: Colorbar Label Size in Quiver Plots
Quiver plots are useful for visualizing vector fields. When adding a colorbar to a quiver plot, you might want to decrease the label size for better integration with the plot. Here’s how:
import matplotlib.pyplot as plt
import numpy as np

# Create sample data
X, Y = np.meshgrid(np.arange(-2, 2, 0.2), np.arange(-2, 2, 0.2))
U = X*Y
V = X + Y
C = np.sqrt(U**2 + V**2)

# Create a figure and axis
fig, ax = plt.subplots(figsize=(8, 6))

# Create a quiver plot
q = ax.quiver(X, Y, U, V, C, cmap='viridis')

# Add a colorbar with decreased label size
cbar = fig.colorbar(q)
cbar.ax.tick_params(labelsize=7)

# Set the colorbar label
cbar.set_label('How2Matplotlib.com Vector Magnitude', fontsize=8)

# Set the title
plt.title("How2Matplotlib.com: Quiver Plot with Small Colorbar Labels")

# Show the plot
plt.show()
Output:
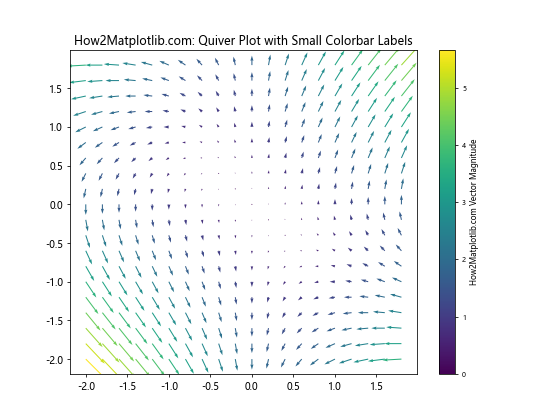
In this example, we create a quiver plot where the color represents the magnitude of the vectors. We then add a colorbar with decreased label size to provide a legend for the magnitude values.
Conclusion
Decreasing the size of colorbar labels in Python Matplotlib is a powerful technique that can significantly enhance the visual appeal and readability of your plots. Throughout this comprehensive guide, we’ve explored various methods to achieve this, from simple parameter adjustments to more advanced customization techniques.