How to Create a Legend for a Contour Plot in Matplotlib
Creating a legend for a contour plot is an essential skill for data visualization using Matplotlib. This article will provide a detailed exploration of the process of creating a legend for a contour plot, covering various aspects and techniques. We’ll dive deep into the world of contour plots and legends, offering practical examples and explanations to help you master this important visualization tool.
Understanding Contour Plots and Legends
Before we delve into creating a legend for a contour plot, it’s crucial to understand what contour plots are and why legends are important. A contour plot is a graphical technique for representing a 3-dimensional surface by plotting constant z slices, called contours, on a 2-dimensional format. These contours are sometimes called isolines, isopleth, or isarithms.
Creating a legend for a contour plot is essential because it provides a key to interpret the data represented in the plot. The legend typically shows the relationship between colors or line styles used in the plot and the corresponding data values. This makes it easier for viewers to understand and analyze the information presented in the contour plot.
Let’s start with a basic example of creating a contour plot with a legend:
import numpy as np
import matplotlib.pyplot as plt

# Generate sample data
x = np.linspace(-5, 5, 100)
y = np.linspace(-5, 5, 100)
X, Y = np.meshgrid(x, y)
Z = np.sin(np.sqrt(X**2 + Y**2))

# Create the contour plot
fig, ax = plt.subplots(figsize=(10, 8))
contour = ax.contourf(X, Y, Z, cmap='viridis')

# Add a colorbar legend
cbar = plt.colorbar(contour)
cbar.set_label('Value')

# Set labels and title
ax.set_xlabel('X-axis')
ax.set_ylabel('Y-axis')
ax.set_title('Contour Plot with Legend - how2matplotlib.com')

plt.show()
Output:
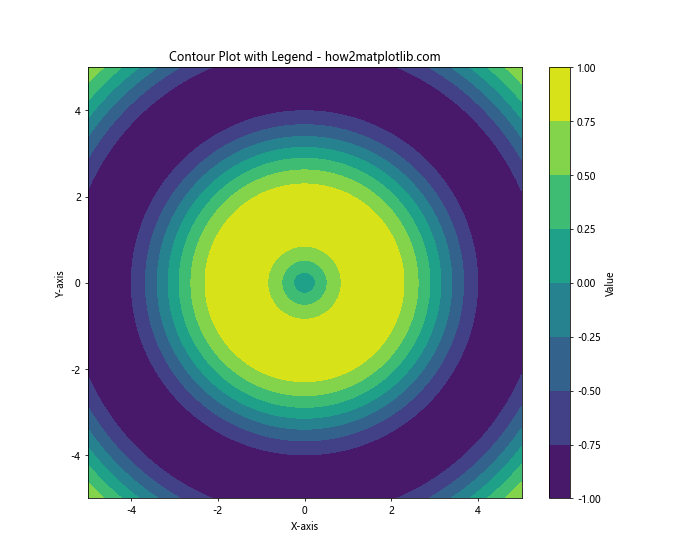
In this example, we create a simple contour plot using sample data and add a colorbar legend to it. The contourf() function creates a filled contour plot, and plt.colorbar() adds the legend.
Customizing the Legend for a Contour Plot
Creating a legend for a contour plot offers various customization options. Let’s explore some of these options to enhance the appearance and informativeness of our legend.
Adjusting the Colorbar Position
You can adjust the position of the colorbar legend using the location parameter:
import numpy as np
import matplotlib.pyplot as plt

# Generate sample data
x = np.linspace(-5, 5, 100)
y = np.linspace(-5, 5, 100)
X, Y = np.meshgrid(x, y)
Z = np.cos(X) * np.sin(Y)

# Create the contour plot
fig, ax = plt.subplots(figsize=(10, 8))
contour = ax.contourf(X, Y, Z, cmap='coolwarm')

# Add a colorbar legend with custom position
cbar = plt.colorbar(contour, location='left')
cbar.set_label('Value')

# Set labels and title
ax.set_xlabel('X-axis')
ax.set_ylabel('Y-axis')
ax.set_title('Contour Plot with Left-positioned Legend - how2matplotlib.com')

plt.show()
Output:
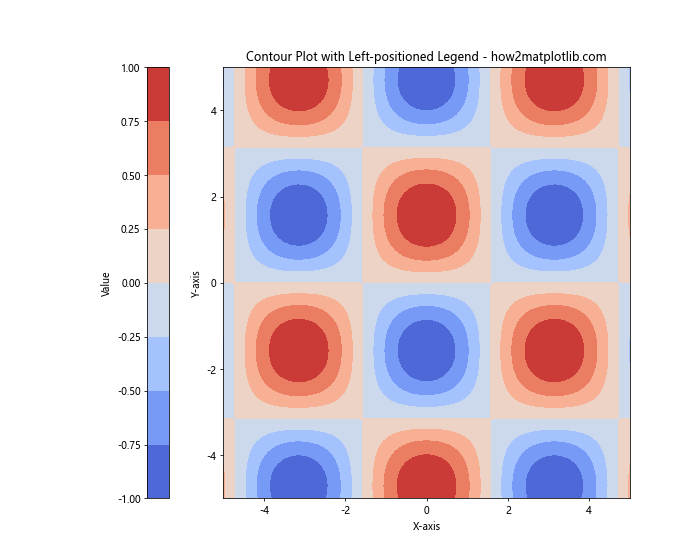
In this example, we set the location parameter to ‘left’ to position the colorbar on the left side of the plot.
Customizing Colorbar Ticks
You can customize the ticks on the colorbar to better represent your data:
import numpy as np
import matplotlib.pyplot as plt

# Generate sample data
x = np.linspace(-5, 5, 100)
y = np.linspace(-5, 5, 100)
X, Y = np.meshgrid(x, y)
Z = X**2 - Y**2

# Create the contour plot
fig, ax = plt.subplots(figsize=(10, 8))
contour = ax.contourf(X, Y, Z, levels=20, cmap='RdYlBu')

# Add a colorbar legend with custom ticks
cbar = plt.colorbar(contour, ticks=[-20, -10, 0, 10, 20])
cbar.set_label('Value')

# Set labels and title
ax.set_xlabel('X-axis')
ax.set_ylabel('Y-axis')
ax.set_title('Contour Plot with Custom Colorbar Ticks - how2matplotlib.com')

plt.show()
Output:
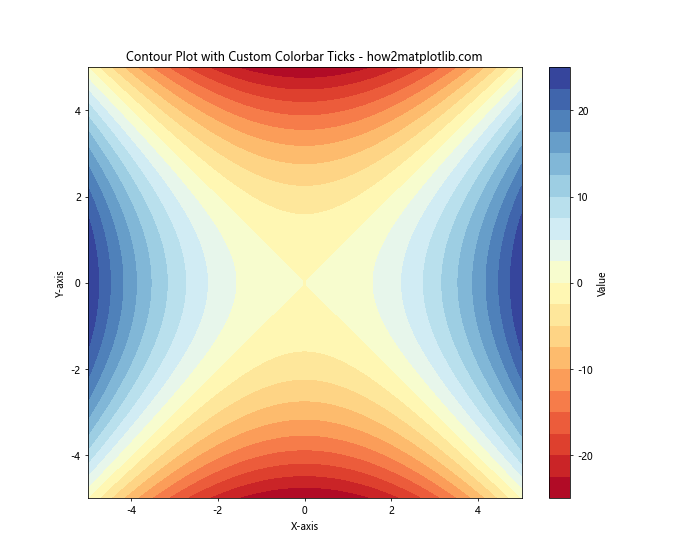
Here, we use the ticks parameter in plt.colorbar() to specify custom tick locations on the colorbar.
Adding a Discrete Colorbar
For some contour plots, you might want to use a discrete colorbar instead of a continuous one:
import numpy as np
import matplotlib.pyplot as plt
from matplotlib.colors import BoundaryNorm
from matplotlib.ticker import MaxNLocator

# Generate sample data
x = np.linspace(-3, 3, 100)
y = np.linspace(-3, 3, 100)
X, Y = np.meshgrid(x, y)
Z = np.sin(X) * np.cos(Y)

# Create discrete levels and a normalized boundary
levels = MaxNLocator(nbins=15).tick_values(Z.min(), Z.max())
norm = BoundaryNorm(levels, ncolors=len(levels) - 1)

# Create the contour plot
fig, ax = plt.subplots(figsize=(10, 8))
contour = ax.contourf(X, Y, Z, levels=levels, cmap='viridis', norm=norm)

# Add a discrete colorbar legend
cbar = plt.colorbar(contour, ticks=levels)
cbar.set_label('Value')

# Set labels and title
ax.set_xlabel('X-axis')
ax.set_ylabel('Y-axis')
ax.set_title('Contour Plot with Discrete Colorbar - how2matplotlib.com')

plt.show()
Output:

In this example, we use MaxNLocator to create discrete levels and BoundaryNorm to normalize the colormap. This results in a discrete colorbar legend.
Creating Legends for Multiple Contour Plots
When working with multiple contour plots in a single figure, you might want to create separate legends for each plot or a combined legend for all plots. Let’s explore both scenarios.
Separate Legends for Multiple Contour Plots
Here’s an example of creating separate legends for multiple contour plots:
import numpy as np
import matplotlib.pyplot as plt

# Generate sample data
x = np.linspace(-5, 5, 100)
y = np.linspace(-5, 5, 100)
X, Y = np.meshgrid(x, y)
Z1 = np.sin(np.sqrt(X**2 + Y**2))
Z2 = np.cos(np.sqrt(X**2 + Y**2))

# Create the figure with two subplots
fig, (ax1, ax2) = plt.subplots(1, 2, figsize=(15, 6))

# Create the first contour plot
contour1 = ax1.contourf(X, Y, Z1, cmap='viridis')
cbar1 = plt.colorbar(contour1, ax=ax1)
cbar1.set_label('Value (Plot 1)')
ax1.set_title('Contour Plot 1 - how2matplotlib.com')

# Create the second contour plot
contour2 = ax2.contourf(X, Y, Z2, cmap='plasma')
cbar2 = plt.colorbar(contour2, ax=ax2)
cbar2.set_label('Value (Plot 2)')
ax2.set_title('Contour Plot 2 - how2matplotlib.com')

# Set labels
for ax in (ax1, ax2):
    ax.set_xlabel('X-axis')
    ax.set_ylabel('Y-axis')

plt.tight_layout()
plt.show()
Output:
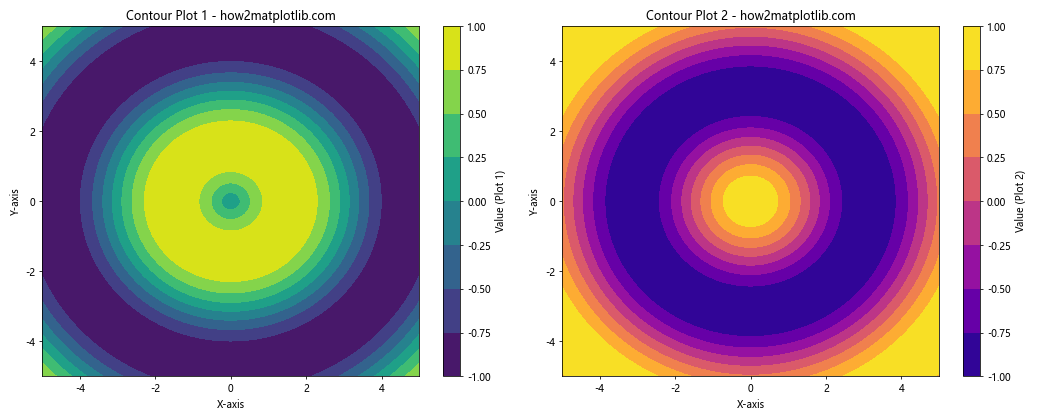
In this example, we create two contour plots side by side, each with its own colorbar legend.
Combined Legend for Multiple Contour Plots
Now, let’s create a combined legend for multiple contour plots:
import numpy as np
import matplotlib.pyplot as plt

# Generate sample data
x = np.linspace(-5, 5, 100)
y = np.linspace(-5, 5, 100)
X, Y = np.meshgrid(x, y)
Z1 = np.sin(np.sqrt(X**2 + Y**2))
Z2 = np.cos(np.sqrt(X**2 + Y**2))

# Create the figure with two subplots
fig, (ax1, ax2) = plt.subplots(1, 2, figsize=(15, 6))

# Create the first contour plot
contour1 = ax1.contourf(X, Y, Z1, cmap='viridis')
ax1.set_title('Contour Plot 1 - how2matplotlib.com')

# Create the second contour plot
contour2 = ax2.contourf(X, Y, Z2, cmap='viridis')
ax2.set_title('Contour Plot 2 - how2matplotlib.com')

# Set labels
for ax in (ax1, ax2):
    ax.set_xlabel('X-axis')
    ax.set_ylabel('Y-axis')

# Add a single colorbar for both plots
cbar = plt.colorbar(contour1, ax=(ax1, ax2))
cbar.set_label('Value')

plt.tight_layout()
plt.show()
Output:
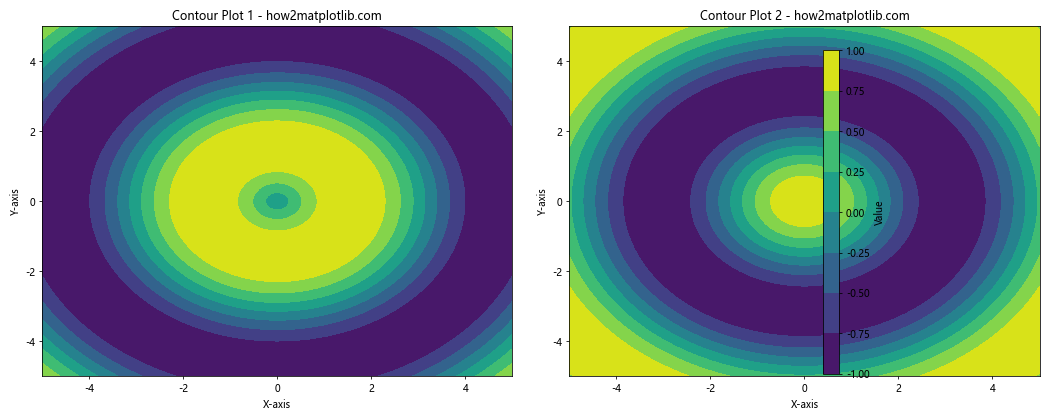
In this example, we create a single colorbar legend that applies to both contour plots.
Advanced Legend Techniques for Contour Plots
Let’s explore some advanced techniques for creating legends for contour plots.
Creating a Legend for Contour Lines
Sometimes, you might want to create a legend for specific contour lines rather than using a colorbar. Here’s how you can do that:
import numpy as np
import matplotlib.pyplot as plt

# Generate sample data
x = np.linspace(-5, 5, 100)
y = np.linspace(-5, 5, 100)
X, Y = np.meshgrid(x, y)
Z = np.sin(X) * np.cos(Y)

# Create the contour plot
fig, ax = plt.subplots(figsize=(10, 8))
levels = [-0.5, 0, 0.5]
contour = ax.contour(X, Y, Z, levels=levels, colors=['blue', 'green', 'red'])

# Add labels to the contour lines
ax.clabel(contour, inline=True, fontsize=10)

# Create a legend for the contour lines
legend_elements = [plt.Line2D([0], [0], color=c, label=f'Level {l}')
                   for c, l in zip(['blue', 'green', 'red'], levels)]
ax.legend(handles=legend_elements, loc='upper right')

# Set labels and title
ax.set_xlabel('X-axis')
ax.set_ylabel('Y-axis')
ax.set_title('Contour Plot with Line Legend - how2matplotlib.com')

plt.show()
Output:
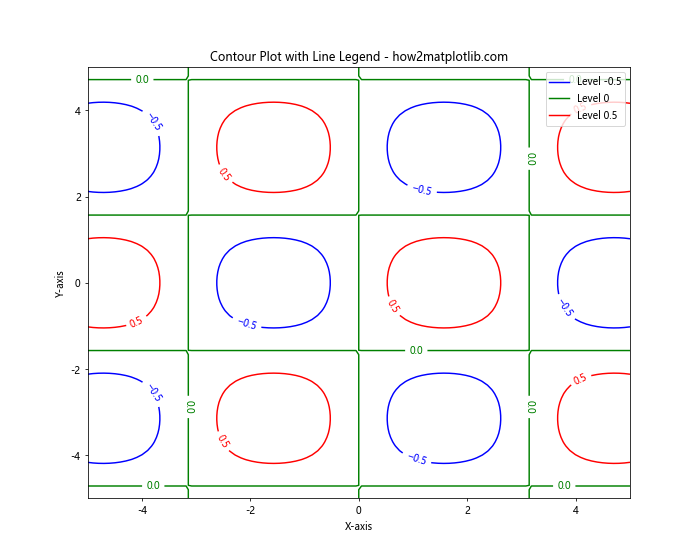
In this example, we create a legend for specific contour lines using plt.Line2D objects.
Combining Colorbar and Line Legends
You can combine both a colorbar legend and a line legend for a more comprehensive visualization:
import numpy as np
import matplotlib.pyplot as plt

# Generate sample data
x = np.linspace(-5, 5, 100)
y = np.linspace(-5, 5, 100)
X, Y = np.meshgrid(x, y)
Z = np.sin(X) * np.cos(Y)

# Create the contour plot
fig, ax = plt.subplots(figsize=(12, 9))
filled_contour = ax.contourf(X, Y, Z, cmap='viridis')
line_contour = ax.contour(X, Y, Z, colors='black', linewidths=0.5)

# Add a colorbar legend
cbar = plt.colorbar(filled_contour)
cbar.set_label('Value')

# Add labels to the contour lines
ax.clabel(line_contour, inline=True, fontsize=8)

# Create a legend for the contour lines
legend_elements = [plt.Line2D([0], [0], color='black', label='Contour Lines')]
ax.legend(handles=legend_elements, loc='upper right')

# Set labels and title
ax.set_xlabel('X-axis')
ax.set_ylabel('Y-axis')
ax.set_title('Contour Plot with Colorbar and Line Legends - how2matplotlib.com')

plt.show()
Output:
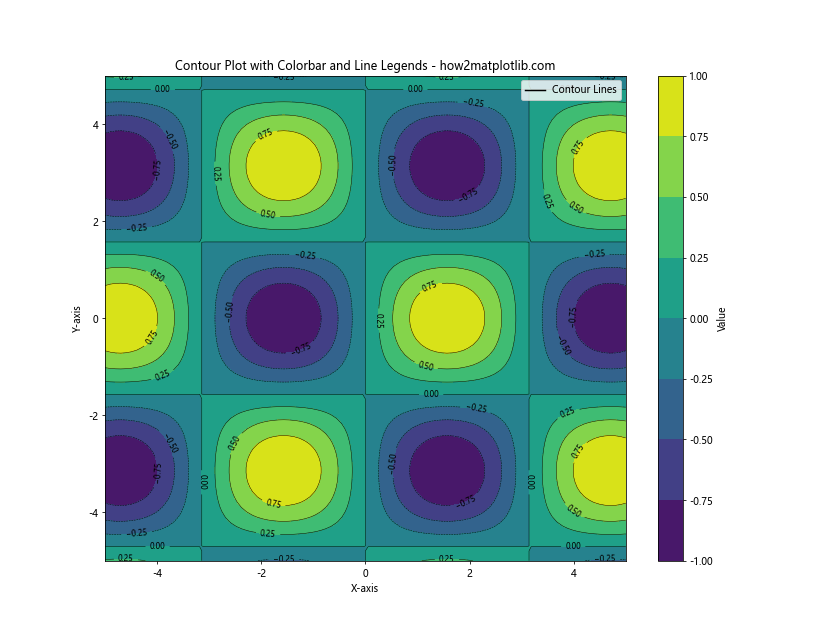
This example demonstrates how to combine a colorbar legend for the filled contours with a line legend for the contour lines.
Customizing Legend Appearance
The appearance of your legend can greatly impact the overall look of your contour plot. Let’s explore some ways to customize the legend’s appearance.
Changing Legend Font Size and Style
You can adjust the font size and style of your legend to make it more readable or to match the style of your plot:
import numpy as np
import matplotlib.pyplot as plt

# Generate sample data
x = np.linspace(-5, 5, 100)
y = np.linspace(-5, 5, 100)
X, Y = np.meshgrid(x, y)
Z = np.sin(X) * np.cos(Y)

# Create the contour plot
fig, ax = plt.subplots(figsize=(10, 8))
contour = ax.contourf(X, Y, Z, cmap='coolwarm')

# Add a colorbar legend with custom font
cbar = plt.colorbar(contour)
cbar.set_label('Value', fontsize=14, fontweight='bold')
cbar.ax.tick_params(labelsize=12)

# Set labels and title with custom font
ax.set_xlabel('X-axis', fontsize=12)
ax.set_ylabel('Y-axis', fontsize=12)
ax.set_title('Contour Plot with Custom Legend Font - how2matplotlib.com', fontsize=16)

plt.show()
Output:

In this example, we customize the font size and style of the colorbar label and tick labels.
Adding a Box Around the Legend
You can add a box around your legend to make it stand out more:
import numpy as np
import matplotlib.pyplot as plt

# Generate sample data
x = np.linspace(-5, 5, 100)
y = np.linspace(-5, 5, 100)
X, Y = np.meshgrid(x, y)
Z = np.sin(X) * np.cos(Y)

# Create the contour plot
fig, ax = plt.subplots(figsize=(10, 8))
contour = ax.contourf(X, Y, Z, cmap='viridis')

# Add a colorbar legend with a box
cbar = plt.colorbar(contour)
cbar.set_label('Value')
cbar.outline.set_visible(True)
cbar.outline.set_linewidth(1)

# Set labels and title
ax.set_xlabel('X-axis')
ax.set_ylabel('Y-axis')
ax.set_title('Contour Plot with Boxed Legend - how2matplotlib.com')

plt.show()
Output:
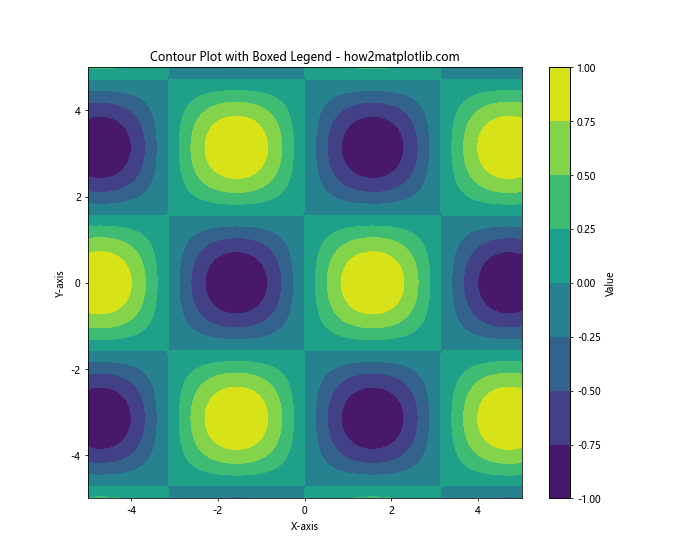
Here, we use cbar.outline.set_visible(True) to add a box around the colorbar legend.
Handling Special Cases
Sometimes, you might encounter special cases when creating legends for contour plots. Let’s look at a couple of these scenarios.
Creating a Legend for Logarithmic Contour Plots
When dealing with data that spans several orders of magnitude, a logarithmic scale can be useful. Here’s how to create alegend for a logarithmic contour plot:
import numpy as np
import matplotlib.pyplot as plt
from matplotlib.colors import LogNorm

# Generate sample data
x = np.logspace(0, 2, 100)
y = np.logspace(0, 2, 100)
X, Y = np.meshgrid(x, y)
Z = X * Y

# Create the logarithmic contour plot
fig, ax = plt.subplots(figsize=(10, 8))
contour = ax.contourf(X, Y, Z, levels=10, norm=LogNorm(), cmap='viridis')

# Add a logarithmic colorbar legend
cbar = plt.colorbar(contour)
cbar.set_label('Value')

# Set labels and title
ax.set_xlabel('X-axis')
ax.set_ylabel('Y-axis')
ax.set_xscale('log')
ax.set_yscale('log')
ax.set_title('Logarithmic Contour Plot with Legend - how2matplotlib.com')

plt.show()
Output:
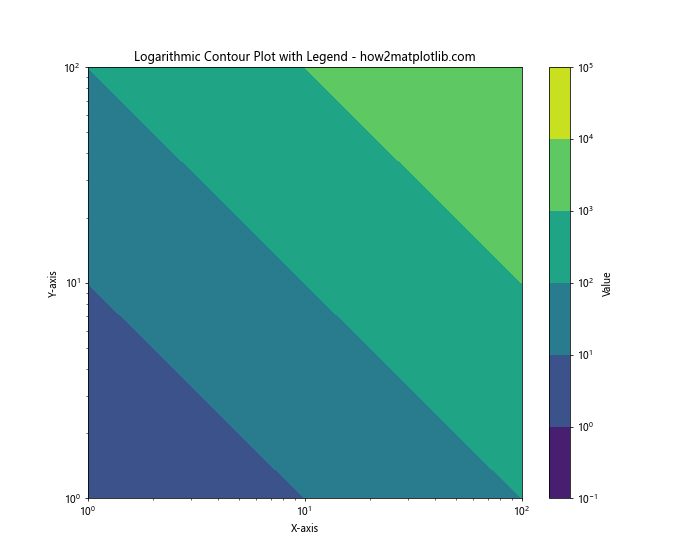
In this example, we use LogNorm() to create a logarithmic scale for the contour plot and colorbar.
Creating a Legend for Diverging Contour Plots
Diverging contour plots are useful when you want to emphasize the deviation from a central value. Here’s how to create a legend for a diverging contour plot:
import numpy as np
import matplotlib.pyplot as plt
from matplotlib.colors import TwoSlopeNorm

# Generate sample data
x = np.linspace(-5, 5, 100)
y = np.linspace(-5, 5, 100)
X, Y = np.meshgrid(x, y)
Z = X * Y

# Create the diverging contour plot
fig, ax = plt.subplots(figsize=(10, 8))
norm = TwoSlopeNorm(vmin=Z.min(), vcenter=0, vmax=Z.max())
contour = ax.contourf(X, Y, Z, levels=20, norm=norm, cmap='RdBu_r')

# Add a diverging colorbar legend
cbar = plt.colorbar(contour)
cbar.set_label('Value')

# Set labels and title
ax.set_xlabel('X-axis')
ax.set_ylabel('Y-axis')
ax.set_title('Diverging Contour Plot with Legend - how2matplotlib.com')

plt.show()
Output:
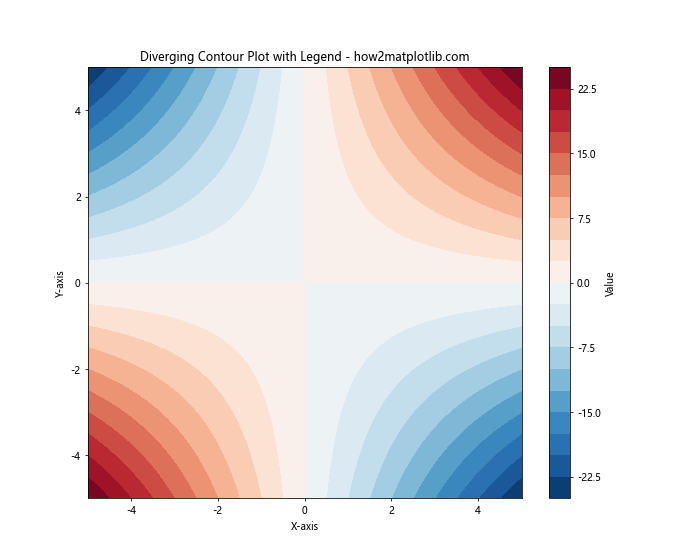
In this example, we use TwoSlopeNorm to create a diverging color scale centered at zero.
Best Practices for Creating Legends in Contour Plots
When creating legends for contour plots, it’s important to follow some best practices to ensure your visualizations are clear and informative. Here are some tips to keep in mind:
- Choose appropriate colors: Select a color scheme that effectively represents your data. For continuous data, use sequential colormaps. For diverging data, use diverging colormaps.
Label clearly: Always label your colorbar or legend with the quantity it represents and include units if applicable.
Use appropriate scale: Choose between linear, logarithmic, or other scales based on the nature of your data.
Adjust tick marks: Customize tick marks on your colorbar to highlight important values or ranges in your data.
Consider the audience: Tailor the complexity of your legend to your intended audience. For a general audience, simpler legends may be more effective.
Maintain consistency: If you’re creating multiple plots, use consistent color schemes and legend styles across all plots.
Test for colorblindness: Ensure your color choices are accessible to colorblind viewers by using colorblind-friendly palettes or tools that simulate colorblindness.
Let’s implement some of these best practices in an example: