How to Draw Multiple Y-Axis Scales In Matplotlib
Draw Multiple Y-Axis Scales In Matplotlib is a powerful technique that allows you to visualize multiple datasets with different scales on the same plot. This article will explore various methods and best practices for creating plots with multiple y-axis scales using Matplotlib, a popular data visualization library in Python. We’ll cover everything from basic concepts to advanced techniques, providing you with the knowledge and tools to create informative and visually appealing plots with multiple y-axis scales.
Understanding the Need for Multiple Y-Axis Scales
Before we dive into the specifics of how to draw multiple y-axis scales in Matplotlib, it’s important to understand why this technique is useful. When working with datasets that have significantly different ranges or units, plotting them on the same y-axis can lead to misleading or hard-to-read visualizations. By using multiple y-axis scales, we can effectively compare trends and relationships between different variables while maintaining their individual scales.
For example, imagine you want to plot temperature and precipitation data for a given location over time. Temperature might range from 0 to 40 degrees Celsius, while precipitation could vary from 0 to 500 millimeters. Plotting these on the same y-axis would make it difficult to discern patterns in the precipitation data due to its much larger range. By using multiple y-axis scales, we can clearly visualize both datasets without compromising the clarity of either.
Basic Concepts of Drawing Multiple Y-Axis Scales
To draw multiple y-axis scales in Matplotlib, we typically use the twinx() method, which creates a second y-axis on the right side of the plot. This allows us to plot two different datasets with different scales on the same figure. Let’s start with a simple example to illustrate this concept:
import matplotlib.pyplot as plt
import numpy as np

# Generate sample data
x = np.linspace(0, 10, 100)
y1 = np.sin(x)
y2 = np.exp(x)

# Create the primary axis
fig, ax1 = plt.subplots()

# Plot the first dataset
ax1.plot(x, y1, 'b-', label='Sine Wave')
ax1.set_xlabel('X-axis')
ax1.set_ylabel('Y1 - Sine', color='b')
ax1.tick_params(axis='y', labelcolor='b')

# Create the secondary axis
ax2 = ax1.twinx()

# Plot the second dataset
ax2.plot(x, y2, 'r-', label='Exponential')
ax2.set_ylabel('Y2 - Exponential', color='r')
ax2.tick_params(axis='y', labelcolor='r')

# Add a title
plt.title('Multiple Y-Axis Scales Example - how2matplotlib.com')

# Display the legend
fig.legend(loc='upper left', bbox_to_anchor=(0.1, 0.9))

plt.show()
Output:
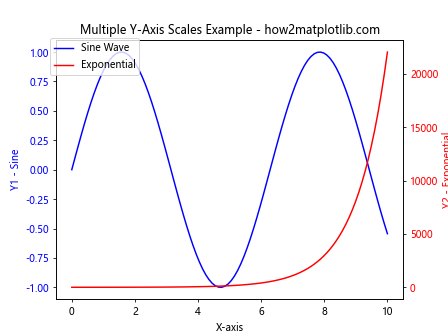
In this example, we create two y-axes: one for the sine wave (blue) and another for the exponential function (red). The twinx() method creates a second y-axis that shares the same x-axis as the primary axis. We then plot each dataset on its respective axis and customize the colors and labels accordingly.
Advanced Techniques for Drawing Multiple Y-Axis Scales
While the basic approach works well for simple plots, there are more advanced techniques we can use to draw multiple y-axis scales in Matplotlib. Let’s explore some of these methods:
1. Using Subplots with Shared X-Axis
One approach to drawing multiple y-axis scales is to create separate subplots with a shared x-axis. This method is particularly useful when you have more than two datasets to visualize:
import matplotlib.pyplot as plt
import numpy as np

# Generate sample data
x = np.linspace(0, 10, 100)
y1 = np.sin(x)
y2 = np.cos(x)
y3 = np.tan(x)

# Create subplots with shared x-axis
fig, (ax1, ax2, ax3) = plt.subplots(3, 1, sharex=True, figsize=(8, 10))

# Plot data on each subplot
ax1.plot(x, y1, 'b-', label='Sine')
ax1.set_ylabel('Y1 - Sine')
ax1.legend()

ax2.plot(x, y2, 'r-', label='Cosine')
ax2.set_ylabel('Y2 - Cosine')
ax2.legend()

ax3.plot(x, y3, 'g-', label='Tangent')
ax3.set_xlabel('X-axis')
ax3.set_ylabel('Y3 - Tangent')
ax3.legend()

# Add a title
fig.suptitle('Multiple Y-Axis Scales Using Subplots - how2matplotlib.com')

plt.tight_layout()
plt.show()
Output:
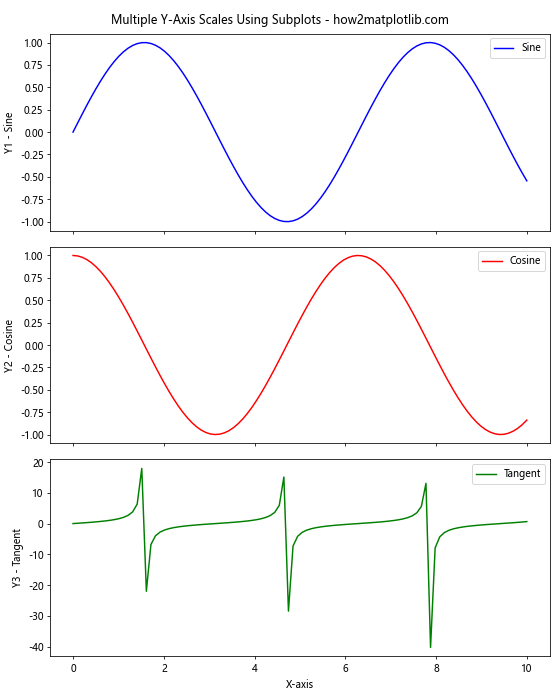
This example creates three subplots, each with its own y-axis scale, while sharing a common x-axis. This approach is particularly useful when you want to compare multiple datasets with different ranges or units.
2. Combining Multiple Y-Axes on a Single Plot
For cases where you want to display multiple y-axes on a single plot, you can extend the twinx() method to create additional axes:
import matplotlib.pyplot as plt
import numpy as np

# Generate sample data
x = np.linspace(0, 10, 100)
y1 = np.sin(x)
y2 = np.exp(x)
y3 = x**2

# Create the primary axis
fig, ax1 = plt.subplots()

# Plot the first dataset
ax1.plot(x, y1, 'b-', label='Sine')
ax1.set_xlabel('X-axis')
ax1.set_ylabel('Y1 - Sine', color='b')
ax1.tick_params(axis='y', labelcolor='b')

# Create the first secondary axis
ax2 = ax1.twinx()
ax2.plot(x, y2, 'r-', label='Exponential')
ax2.set_ylabel('Y2 - Exponential', color='r')
ax2.tick_params(axis='y', labelcolor='r')

# Create the second secondary axis
ax3 = ax1.twinx()
ax3.spines['right'].set_position(('axes', 1.1))  # Offset the right spine
ax3.plot(x, y3, 'g-', label='Quadratic')
ax3.set_ylabel('Y3 - Quadratic', color='g')
ax3.tick_params(axis='y', labelcolor='g')

# Add a title
plt.title('Multiple Y-Axis Scales on a Single Plot - how2matplotlib.com')

# Display the legend
fig.legend(loc='upper left', bbox_to_anchor=(0.1, 0.9))

plt.tight_layout()
plt.show()
Output:
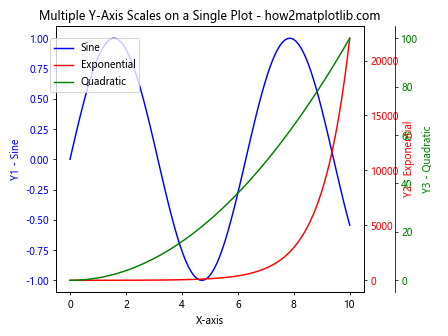
In this example, we create three y-axes on a single plot. The third axis is offset to the right to avoid overlapping with the second axis. This technique allows for the comparison of multiple datasets with vastly different scales on a single plot.
Customizing Multiple Y-Axis Scales
When drawing multiple y-axis scales in Matplotlib, customization is key to creating clear and informative visualizations. Let’s explore some ways to enhance our plots:
1. Adjusting Axis Limits and Ticks
To ensure that each dataset is properly displayed, you may need to adjust the axis limits and ticks for each y-axis:
import matplotlib.pyplot as plt
import numpy as np

# Generate sample data
x = np.linspace(0, 10, 100)
y1 = np.sin(x)
y2 = np.exp(x)

# Create the primary axis
fig, ax1 = plt.subplots()

# Plot the first dataset
ax1.plot(x, y1, 'b-', label='Sine')
ax1.set_xlabel('X-axis')
ax1.set_ylabel('Y1 - Sine', color='b')
ax1.tick_params(axis='y', labelcolor='b')
ax1.set_ylim(-1.5, 1.5)
ax1.set_yticks(np.arange(-1.5, 1.6, 0.5))

# Create the secondary axis
ax2 = ax1.twinx()

# Plot the second dataset
ax2.plot(x, y2, 'r-', label='Exponential')
ax2.set_ylabel('Y2 - Exponential', color='r')
ax2.tick_params(axis='y', labelcolor='r')
ax2.set_ylim(0, 25000)
ax2.set_yticks(np.arange(0, 25001, 5000))

# Add a title
plt.title('Customized Y-Axis Scales - how2matplotlib.com')

# Display the legend
fig.legend(loc='upper left', bbox_to_anchor=(0.1, 0.9))

plt.tight_layout()
plt.show()
Output:
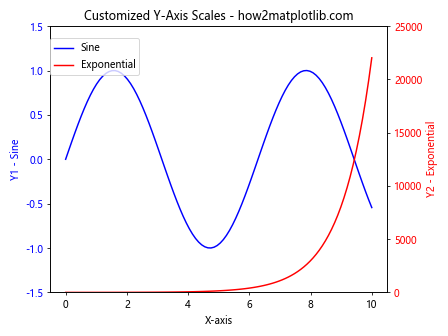
In this example, we set custom limits and ticks for both y-axes to ensure that the data is displayed optimally.
2. Using Different Scales (Linear, Log, Symlog)
Matplotlib allows you to use different scales for each y-axis, which can be particularly useful when dealing with data that spans multiple orders of magnitude:
import matplotlib.pyplot as plt
import numpy as np

# Generate sample data
x = np.linspace(0, 10, 100)
y1 = np.exp(x)
y2 = x**2

# Create the primary axis
fig, ax1 = plt.subplots()

# Plot the first dataset with a log scale
ax1.semilogy(x, y1, 'b-', label='Exponential')
ax1.set_xlabel('X-axis')
ax1.set_ylabel('Y1 - Log Scale', color='b')
ax1.tick_params(axis='y', labelcolor='b')

# Create the secondary axis
ax2 = ax1.twinx()

# Plot the second dataset with a linear scale
ax2.plot(x, y2, 'r-', label='Quadratic')
ax2.set_ylabel('Y2 - Linear Scale', color='r')
ax2.tick_params(axis='y', labelcolor='r')

# Add a title
plt.title('Multiple Y-Axis Scales with Different Scale Types - how2matplotlib.com')

# Display the legend
fig.legend(loc='upper left', bbox_to_anchor=(0.1, 0.9))

plt.tight_layout()
plt.show()
Output:
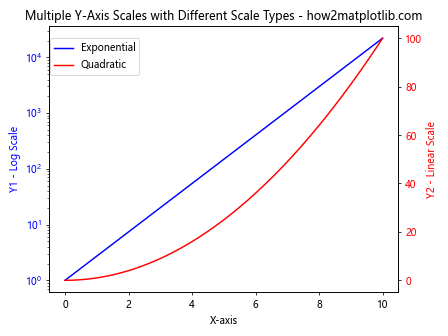
This example demonstrates how to use a logarithmic scale for one y-axis and a linear scale for the other, allowing for effective visualization of data with different magnitudes.
Handling Overlapping Axes and Labels
When drawing multiple y-axis scales, it’s important to handle potential overlapping of axes and labels. Here are some techniques to address this issue:
1. Adjusting Spine Positions
You can adjust the position of the right spine to create space between multiple y-axes:
import matplotlib.pyplot as plt
import numpy as np

# Generate sample data
x = np.linspace(0, 10, 100)
y1 = np.sin(x)
y2 = np.cos(x)
y3 = np.tan(x)

# Create the primary axis
fig, ax1 = plt.subplots()

# Plot the first dataset
ax1.plot(x, y1, 'b-', label='Sine')
ax1.set_xlabel('X-axis')
ax1.set_ylabel('Y1 - Sine', color='b')
ax1.tick_params(axis='y', labelcolor='b')

# Create the first secondary axis
ax2 = ax1.twinx()
ax2.plot(x, y2, 'r-', label='Cosine')
ax2.set_ylabel('Y2 - Cosine', color='r')
ax2.tick_params(axis='y', labelcolor='r')

# Create the second secondary axis
ax3 = ax1.twinx()
ax3.spines['right'].set_position(('axes', 1.1))  # Offset the right spine
ax3.plot(x, y3, 'g-', label='Tangent')
ax3.set_ylabel('Y3 - Tangent', color='g')
ax3.tick_params(axis='y', labelcolor='g')

# Add a title
plt.title('Multiple Y-Axis Scales with Adjusted Spine Positions - how2matplotlib.com')

# Display the legend
fig.legend(loc='upper left', bbox_to_anchor=(0.1, 0.9))

plt.tight_layout()
plt.show()
Output:
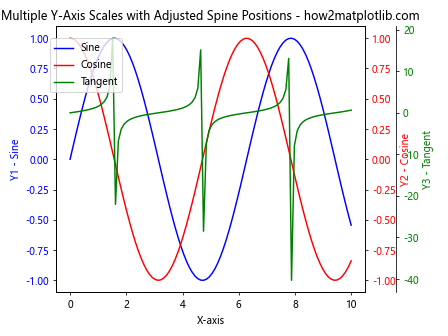
This example offsets the third y-axis to prevent overlapping with the second y-axis.
2. Using Axis Labels with Different Vertical Alignments
Another approach to avoid overlapping labels is to adjust the vertical alignment of the y-axis labels:
import matplotlib.pyplot as plt
import numpy as np

# Generate sample data
x = np.linspace(0, 10, 100)
y1 = np.sin(x)
y2 = np.cos(x)

# Create the primary axis
fig, ax1 = plt.subplots()

# Plot the first dataset
ax1.plot(x, y1, 'b-', label='Sine')
ax1.set_xlabel('X-axis')
ax1.set_ylabel('Y1 - Sine', color='b', va='bottom')
ax1.tick_params(axis='y', labelcolor='b')

# Create the secondary axis
ax2 = ax1.twinx()

# Plot the second dataset
ax2.plot(x, y2, 'r-', label='Cosine')
ax2.set_ylabel('Y2 - Cosine', color='r', va='top')
ax2.tick_params(axis='y', labelcolor='r')

# Add a title
plt.title('Multiple Y-Axis Scales with Adjusted Label Alignments - how2matplotlib.com')

# Display the legend
fig.legend(loc='upper left', bbox_to_anchor=(0.1, 0.9))

plt.tight_layout()
plt.show()
Output:
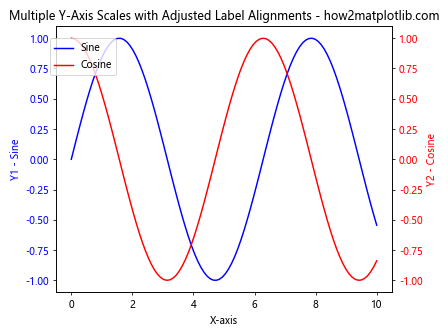
In this example, we adjust the vertical alignment of the y-axis labels to prevent overlap at the top of the plot.
Color Coding and Legend Management
When drawing multiple y-axis scales, it’s crucial to use color coding effectively and manage legends to ensure clarity. Here are some techniques to improve the readability of your plots:
1. Consistent Color Schemes
Use consistent colors for each dataset and its corresponding y-axis:
import matplotlib.pyplot as plt
import numpy as np

# Generate sample data
x = np.linspace(0, 10, 100)
y1 = np.sin(x)
y2 = np.cos(x)

# Define colors
color1 = '#1f77b4'  # Blue
color2 = '#ff7f0e'  # Orange

# Create the primary axis
fig, ax1 = plt.subplots()

# Plot the first dataset
ax1.plot(x, y1, color=color1, label='Sine')
ax1.set_xlabel('X-axis')
ax1.set_ylabel('Y1 - Sine', color=color1)
ax1.tick_params(axis='y', labelcolor=color1)

# Create the secondary axis
ax2 = ax1.twinx()

# Plot the second dataset
ax2.plot(x, y2, color=color2, label='Cosine')
ax2.set_ylabel('Y2 - Cosine', color=color2)
ax2.tick_params(axis='y', labelcolor=color2)

# Add a title
plt.title('Multiple Y-Axis Scales with Consistent Color Scheme - how2matplotlib.com')

# Display the legend
lines1, labels1 = ax1.get_legend_handles_labels()
lines2, labels2 = ax2.get_legend_handles_labels()
ax1.legend(lines1 + lines2, labels1 + labels2, loc='upper left')

plt.tight_layout()
plt.show()
Output:
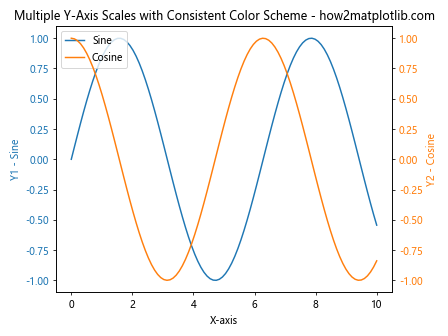
This example uses consistent colors for each dataset, its y-axis label, and tick labels, making it easier for readers to associate the data with its corresponding axis.
2. Combining Legends
When you have multiple y-axes, it’s often helpful to combine the legends into a single, unified legend:
import matplotlib.pyplot as plt
import numpy as np

# Generate sample data
x = np.linspace(0, 10, 100)
y1 = np.sin(x)
y2 = np.exp(x)
y3 = x**2

# Create the primary axis
fig, ax1 = plt.subplots()

# Plot the first dataset
line1, = ax1.plot(x, y1, 'b-', label='Sine')
ax1.set_xlabel('X-axis')
ax1.set_ylabel('Y1 - Sine', color='b')
ax1.tick_params(axis='y', labelcolor='b')

# Create the first secondary axis
ax2 = ax1.twinx()
line2, = ax2.plot(x, y2, 'r-', label='Exponential')
ax2.set_ylabel('Y2 - Exponential', color='r')
ax2.tick_params(axis='y', labelcolor='r')

# Create the second secondary axis
ax3 = ax1.twinx()
ax3.spines['right'].set_position(('axes', 1.1))  # Offset the right spine
line3, = ax3.plot(x, y3, 'g-', label='Quadratic')
ax3.set_ylabel('Y3 - Quadratic', color='g')
ax3.tick_params(axis='y', labelcolor='g')

# Add a title
plt.title('Multiple Y-Axis Scales with Combined Legend - how2matplotlib.com')

# Combine legends
lines = [line1, line2, line3]
labels = [l.get_label() for l in lines]
ax1.legend(lines, labels, loc='upper left')

plt.tight_layout()
plt.show()
Output:
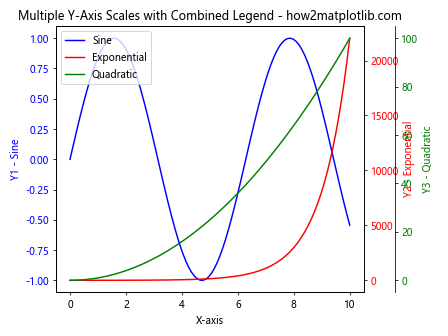
This example demonstrates how to create a single legend that includes all datasets from multiple y-axes.
Handling Time Series Data with Multiple Y-Axis Scales
When working with time series data, drawing multiple y-axis scales can be particularly useful. Let’s explore how to handle time-based x-axes while maintaining multiple y-axis scales:
import matplotlib.pyplot as plt
import numpy as np
import pandas as pd

# Generate sample time series data
dates = pd.date_range(start='2023-01-01', end='2023-12-31', freq='D')
temperature = np.random.normal(20, 5, len(dates)) + 5 * np.sin(np.arange(len(dates)) * 2 * np.pi / 365)
precipitation = np.random.exponential(5, len(dates))

# Create the primary axis
fig, ax1 = plt.subplots(figsize=(12, 6))

# Plot temperature data
ax1.plot(dates, temperature, 'r-', label='Temperature')
ax1.set_xlabel('Date')
ax1.set_ylabel('Temperature (°C)', color='r')
ax1.tick_params(axis='y', labelcolor='r')

# Create the secondary axis
ax2 = ax1.twinx()

# Plot precipitation data
ax2.bar(dates, precipitation, alpha=0.3, color='b', label='Precipitation')
ax2.set_ylabel('Precipitation (mm)', color='b')
ax2.tick_params(axis='y', labelcolor='b')

# Add a title
plt.title('Temperature and Precipitation Over Time - how2matplotlib.com')

# Display the legend
lines1, labels1 = ax1.get_legend_handles_labels()
lines2, labels2 = ax2.get_legend_handles_labels()
ax1.legend(lines1 + lines2, labels1 + labels2, loc='upper left')

# Format x-axis to show dates nicely
plt.gcf().autofmt_xdate()

plt.tight_layout()
plt.show()
Output:
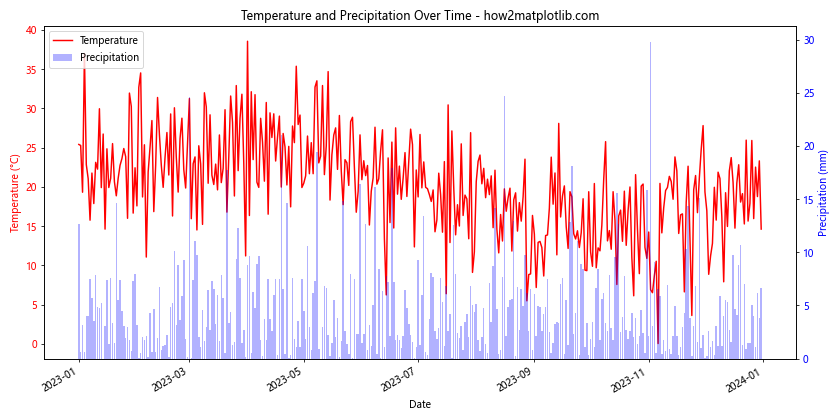
This example demonstrates how to create a plot with multiple y-axis scales for time series data, showing temperature on one axis and precipitation on the other.
Advanced Customization Techniques
To further enhance your plots with multiple y-axis scales, consider these advanced customization techniques:
1. Adding Grid Lines
You can add grid lines to your plot to make it easier to read values across multiple y-axes:
import matplotlib.pyplot as plt
import numpy as np

# Generate sample data
x = np.linspace(0, 10, 100)
y1 = np.sin(x)
y2 = np.exp(x)

# Create the primary axis
fig, ax1 = plt.subplots()

# Plot the first dataset
ax1.plot(x, y1, 'b-', label='Sine')
ax1.set_xlabel('X-axis')
ax1.set_ylabel('Y1 - Sine', color='b')
ax1.tick_params(axis='y', labelcolor='b')
ax1.grid(True, linestyle='--', alpha=0.7)

# Create the secondary axis
ax2 = ax1.twinx()

# Plot the second dataset
ax2.plot(x, y2, 'r-', label='Exponential')
ax2.set_ylabel('Y2 - Exponential', color='r')
ax2.tick_params(axis='y', labelcolor='r')

# Add a title
plt.title('Multiple Y-Axis Scales with Grid Lines - how2matplotlib.com')

# Display the legend
lines1, labels1 = ax1.get_legend_handles_labels()
lines2, labels2 = ax2.get_legend_handles_labels()
ax1.legend(lines1 + lines2, labels1 + labels2, loc='upper left')

plt.tight_layout()
plt.show()
Output:
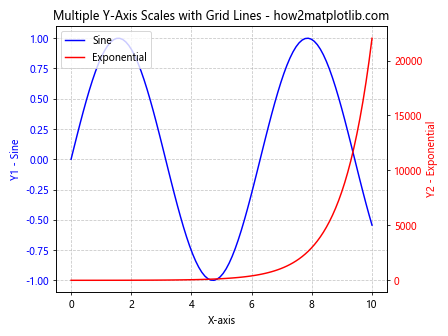
This example adds grid lines to the plot, making it easier to read values across both y-axes.
2. Using Different Line Styles and Markers
Utilize various line styles and markers to differentiate between datasets:
import matplotlib.pyplot as plt
import numpy as np

# Generate sample data
x = np.linspace(0, 10, 20)
y1 = np.sin(x)
y2 = np.cos(x)

# Create the primary axis
fig, ax1 = plt.subplots()

# Plot the first dataset
ax1.plot(x, y1, 'b-o', label='Sine', linewidth=2, markersize=6)
ax1.set_xlabel('X-axis')
ax1.set_ylabel('Y1 - Sine', color='b')
ax1.tick_params(axis='y', labelcolor='b')

# Create the secondary axis
ax2 = ax1.twinx()

# Plot the second dataset
ax2.plot(x, y2, 'r--s', label='Cosine', linewidth=2, markersize=6)
ax2.set_ylabel('Y2 - Cosine', color='r')
ax2.tick_params(axis='y', labelcolor='r')

# Add a title
plt.title('Multiple Y-Axis Scales with Different Line Styles and Markers - how2matplotlib.com')

# Display the legend
lines1, labels1 = ax1.get_legend_handles_labels()
lines2, labels2 = ax2.get_legend_handles_labels()
ax1.legend(lines1 + lines2, labels1 + labels2, loc='upper left')

plt.tight_layout()
plt.show()
Output:
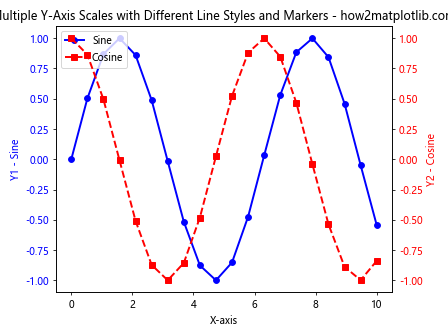
This example uses different line styles and markers for each dataset, making them easily distinguishable.
Handling Large Datasets with Multiple Y-Axis Scales
When dealing with large datasets, it’s important to optimize your plots for both clarity and performance. Here are some techniques for handling large datasets when drawing multiple y-axis scales:
1. Data Downsampling
For very large datasets, you may want to downsample the data to improve plot rendering speed:
import matplotlib.pyplot as plt
import numpy as np

# Generate a large sample dataset
x = np.linspace(0, 100, 10000)
y1 = np.sin(x) + np.random.normal(0, 0.1, 10000)
y2 = np.exp(x/10) + np.random.normal(0, 10, 10000)

# Downsample the data
downsample_factor = 100
x_downsampled = x[::downsample_factor]
y1_downsampled = y1[::downsample_factor]
y2_downsampled = y2[::downsample_factor]

# Create the primary axis
fig, ax1 = plt.subplots(figsize=(12, 6))

# Plot the first downsampled dataset
ax1.plot(x_downsampled, y1_downsampled, 'b-', label='Sine with Noise')
ax1.set_xlabel('X-axis')
ax1.set_ylabel('Y1 - Sine with Noise', color='b')
ax1.tick_params(axis='y', labelcolor='b')

# Create the secondary axis
ax2 = ax1.twinx()

# Plot the second downsampled dataset
ax2.plot(x_downsampled, y2_downsampled, 'r-', label='Exponential with Noise')
ax2.set_ylabel('Y2 - Exponential with Noise', color='r')
ax2.tick_params(axis='y', labelcolor='r')

# Add a title
plt.title('Multiple Y-Axis Scales with Downsampled Large Datasets - how2matplotlib.com')

# Display the legend
lines1, labels1 = ax1.get_legend_handles_labels()
lines2, labels2 = ax2.get_legend_handles_labels()
ax1.legend(lines1 + lines2, labels1 + labels2, loc='upper left')

plt.tight_layout()
plt.show()
Output:
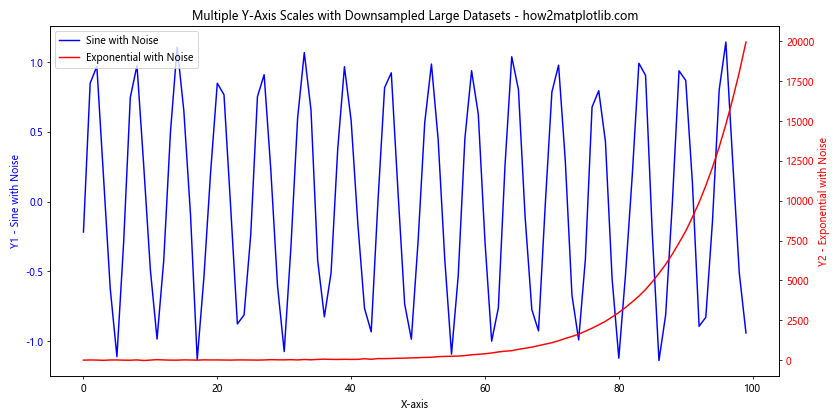
This example demonstrates how to downsample large datasets before plotting, which can significantly improve rendering performance while still maintaining the overall trend of the data.
2. Using Line Collections
For large datasets with many line segments, using LineCollection can be more efficient than standard line plots:
import matplotlib.pyplot as plt
import numpy as np
from matplotlib.collections import LineCollection

# Generate a large sample dataset
x = np.linspace(0, 100, 10000)
y1 = np.sin(x) + np.random.normal(0, 0.1, 10000)
y2 = np.exp(x/10) + np.random.normal(0, 10, 10000)

# Create line segments
points1 = np.array([x, y1]).T.reshape(-1, 1, 2)
segments1 = np.concatenate([points1[:-1], points1[1:]], axis=1)

points2 = np.array([x, y2]).T.reshape(-1, 1, 2)
segments2 = np.concatenate([points2[:-1], points2[1:]], axis=1)

# Create the primary axis
fig, ax1 = plt.subplots(figsize=(12, 6))

# Plot the first dataset using LineCollection
lc1 = LineCollection(segments1, colors='b', label='Sine with Noise')
ax1.add_collection(lc1)
ax1.set_xlabel('X-axis')
ax1.set_ylabel('Y1 - Sine with Noise', color='b')
ax1.tick_params(axis='y', labelcolor='b')

# Create the secondary axis
ax2 = ax1.twinx()

# Plot the second dataset using LineCollection
lc2 = LineCollection(segments2, colors='r', label='Exponential with Noise')
ax2.add_collection(lc2)
ax2.set_ylabel('Y2 - Exponential with Noise', color='r')
ax2.tick_params(axis='y', labelcolor='r')

# Set the plot limits
ax1.set_xlim(x.min(), x.max())
ax1.set_ylim(y1.min(), y1.max())
ax2.set_ylim(y2.min(), y2.max())

# Add a title
plt.title('Multiple Y-Axis Scales with Large Datasets Using LineCollection - how2matplotlib.com')

# Display the legend
ax1.legend(loc='upper left')
ax2.legend(loc='upper right')

plt.tight_layout()
plt.show()
Output:
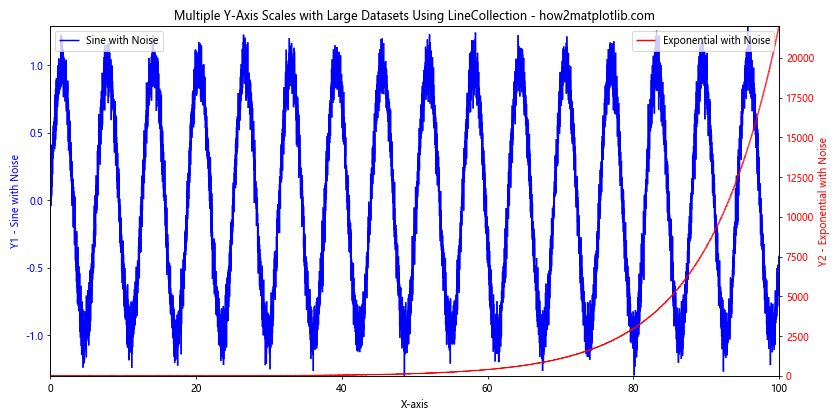
This example uses LineCollection to efficiently plot large datasets with multiple y-axis scales, which can be faster than standard line plots for datasets with many points.
Best Practices for Drawing Multiple Y-Axis Scales
When creating plots with multiple y-axis scales, it’s important to follow best practices to ensure your visualizations are clear, informative, and easy to interpret. Here are some key guidelines to keep in mind:
- Limit the number of y-axes: While Matplotlib allows you to add multiple y-axes, it’s generally best to limit yourself to two or three at most. Too many axes can make the plot cluttered and difficult to read.
Use consistent color coding: Assign a unique color to each dataset and its corresponding y-axis. Use this color consistently for the plot line, axis label, and tick labels.
Provide clear labels: Ensure that each y-axis is clearly labeled with its corresponding variable and units.
Use appropriate scales: Choose the most suitable scale (linear, logarithmic, etc.) for each y-axis based on the nature of the data.
Avoid overlapping: Carefully position your axes and labels to prevent overlapping, which can make the plot hard to read.
Include a legend: Always include a clear legend that explains what each line or dataset represents.
Add a descriptive title: Use the plot title to provide context and summarize the main point of the visualization.
Consider alternative layouts: For some datasets, using subplots with a shared x-axis might be clearer than multiple y-axes on a single plot.
Be mindful of aspect ratio: Adjust the figure size and aspect ratio to ensure that trends in all datasets are visible and not distorted.
Use appropriate line styles and markers: Differentiate between datasets using different line styles, markers, or both, especially when color alone may not be sufficient.
Conclusion
Drawing multiple y-axis scales in Matplotlib is a powerful technique that allows you to visualize and compare datasets with different ranges or units on the same plot. By following the methods and best practices outlined in this article, you can create informative and visually appealing plots that effectively communicate complex relationships between multiple variables. Remember that while multiple y-axis scales can be very useful, they should be used judiciously. Always consider whether this approach is the most effective way to present your data, or if alternative visualization methods might be more appropriate. As you continue to work with Matplotlib and explore its capabilities for drawing multiple y-axis scales, experiment with different techniques and customizations to find the approach that best suits your specific data and visualization needs. With practice and attention to detail, you’ll be able to create professional-quality plots that effectively communicate your data insights.