How to Remove Colorbar from Figure in Matplotlib
Remove Colorbar from Figure in Matplotlib is an essential skill for data visualization enthusiasts and professionals alike. In this comprehensive guide, we’ll explore various methods and techniques to effectively remove colorbars from figures in Matplotlib. Whether you’re working on a simple plot or a complex visualization, understanding how to remove colorbars can help you create cleaner, more focused graphics. We’ll cover everything from basic removal techniques to advanced customization options, providing you with the knowledge and tools to master colorbar removal in Matplotlib.
Understanding Colorbars in Matplotlib
Before we dive into removing colorbars, let’s first understand what colorbars are and why they’re used in Matplotlib. Colorbars are visual representations of the mapping between color values and data values in a plot. They’re commonly used with color-mapped plots like heatmaps, contour plots, and scatter plots with color-coded data points.
Matplotlib automatically adds colorbars to certain types of plots, but sometimes you may want to remove them for various reasons:
- Simplifying the plot
- Saving space in the figure
- Creating custom color legends
- Combining multiple plots with different color scales
Let’s start with a basic example of a plot with a colorbar:
import matplotlib.pyplot as plt
import numpy as np

# Create sample data
data = np.random.rand(10, 10)

# Create a figure and axis
fig, ax = plt.subplots()

# Create a color-mapped plot
im = ax.imshow(data)

# Add a colorbar
cbar = plt.colorbar(im)

# Set title
plt.title("Plot with Colorbar - how2matplotlib.com")

# Show the plot
plt.show()
Output:
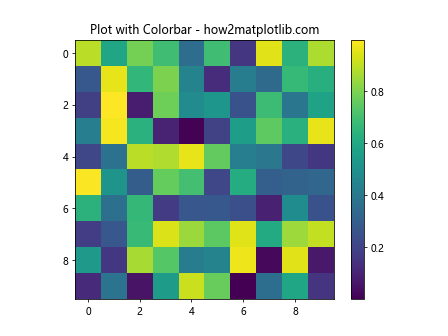
This code creates a simple heatmap with a colorbar. Now, let’s explore different methods to remove this colorbar.
Method 1: Removing Colorbar Using fig.delaxes()
One of the simplest ways to remove a colorbar from a Matplotlib figure is by using the fig.delaxes() method. This method removes an entire axis from the figure, including the colorbar.
Here’s an example of how to use this method:
import matplotlib.pyplot as plt
import numpy as np

# Create sample data
data = np.random.rand(10, 10)

# Create a figure and axis
fig, ax = plt.subplots()

# Create a color-mapped plot
im = ax.imshow(data)

# Add a colorbar
cbar = plt.colorbar(im)

# Remove the colorbar
fig.delaxes(fig.axes[1])

# Set title
plt.title("Plot without Colorbar - how2matplotlib.com")

# Show the plot
plt.show()
Output:
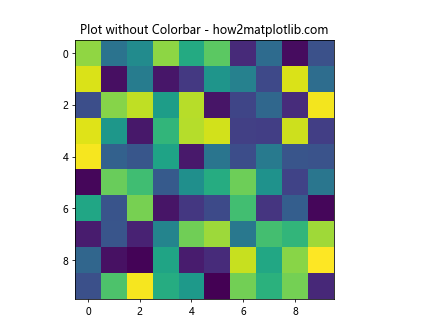
In this example, we first create a plot with a colorbar, then use fig.delaxes(fig.axes[1]) to remove the colorbar. The fig.axes[1] refers to the second axis in the figure, which is typically the colorbar axis.
Method 2: Preventing Colorbar Creation
Another approach to remove colorbars from figures in Matplotlib is to prevent their creation in the first place. This method is particularly useful when you’re working with functions or methods that automatically add colorbars.
Here’s an example of how to prevent colorbar creation:
import matplotlib.pyplot as plt
import numpy as np

# Create sample data
data = np.random.rand(10, 10)

# Create a figure and axis
fig, ax = plt.subplots()

# Create a color-mapped plot without colorbar
im = ax.imshow(data, cmap='viridis')

# Set title
plt.title("Plot without Colorbar - how2matplotlib.com")

# Show the plot
plt.show()
Output:
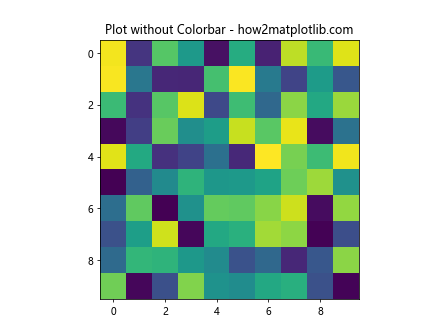
In this example, we simply omit the plt.colorbar() call, which prevents the colorbar from being added to the plot.
Method 3: Using the colorbar() Method with ax Parameter
When working with subplots or multiple axes, you can use the colorbar() method with the ax parameter to control which axis the colorbar is added to. By specifying a different axis, you can effectively remove the colorbar from the main plot.
Here’s an example:
import matplotlib.pyplot as plt
import numpy as np

# Create sample data
data = np.random.rand(10, 10)

# Create a figure with two subplots
fig, (ax1, ax2) = plt.subplots(1, 2, figsize=(10, 5))

# Create a color-mapped plot in the first subplot
im = ax1.imshow(data)

# Add colorbar to the second subplot (effectively removing it from the first)
plt.colorbar(im, ax=ax2)

# Remove the second subplot
fig.delaxes(ax2)

# Set title
ax1.set_title("Plot without Colorbar - how2matplotlib.com")

# Show the plot
plt.show()
Output:
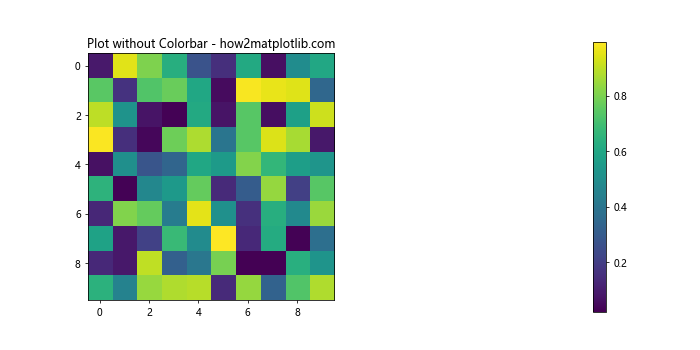
In this example, we create two subplots, add the colorbar to the second subplot, and then remove the second subplot entirely. This effectively removes the colorbar from the figure while still allowing us to create the color-mapped plot.
Method 4: Using the remove() Method
The remove() method can be used to remove specific elements from a Matplotlib figure, including colorbars. This method is particularly useful when you want to remove the colorbar after it has been created.
Here’s an example of how to use the remove() method:
import matplotlib.pyplot as plt
import numpy as np

# Create sample data
data = np.random.rand(10, 10)

# Create a figure and axis
fig, ax = plt.subplots()

# Create a color-mapped plot
im = ax.imshow(data)

# Add a colorbar
cbar = plt.colorbar(im)

# Remove the colorbar
cbar.remove()

# Set title
plt.title("Plot with Removed Colorbar - how2matplotlib.com")

# Show the plot
plt.show()
Output:
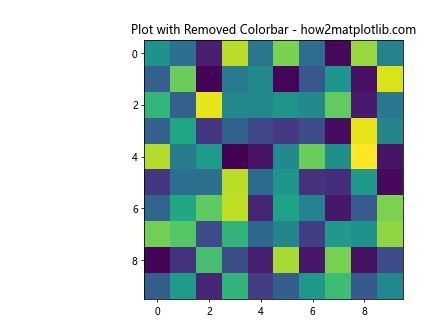
In this example, we first create a plot with a colorbar, then use cbar.remove() to remove the colorbar from the figure.
Method 5: Using tight_layout() to Adjust Plot After Colorbar Removal
When you remove a colorbar from a Matplotlib figure, you may notice that the plot doesn’t automatically resize to fill the available space. To address this, you can use the tight_layout() function to automatically adjust the plot layout.
Here’s an example:
import matplotlib.pyplot as plt
import numpy as np

# Create sample data
data = np.random.rand(10, 10)

# Create a figure and axis
fig, ax = plt.subplots()

# Create a color-mapped plot
im = ax.imshow(data)

# Add a colorbar
cbar = plt.colorbar(im)

# Remove the colorbar
cbar.remove()

# Adjust the layout
plt.tight_layout()

# Set title
plt.title("Plot with Removed Colorbar and Adjusted Layout - how2matplotlib.com")

# Show the plot
plt.show()
Output:
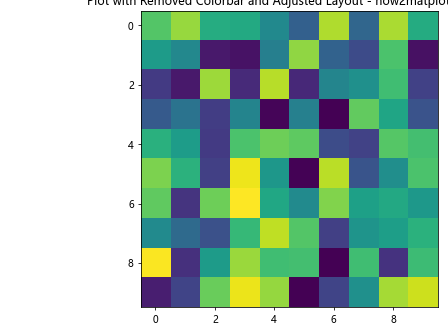
In this example, we remove the colorbar and then call plt.tight_layout() to adjust the plot layout, ensuring that the plot fills the available space.
Method 6: Removing Colorbar in Seaborn Plots
Seaborn is a popular data visualization library built on top of Matplotlib. When working with Seaborn plots, you may encounter situations where you need to remove colorbars. Here’s how you can do it:
import matplotlib.pyplot as plt
import seaborn as sns
import numpy as np

# Create sample data
data = np.random.rand(10, 10)

# Create a Seaborn heatmap
sns.heatmap(data)

# Get the current figure
fig = plt.gcf()

# Remove the colorbar (last axes)
fig.axes[-1].remove()

# Set title
plt.title("Seaborn Heatmap without Colorbar - how2matplotlib.com")

# Show the plot
plt.show()
Output:
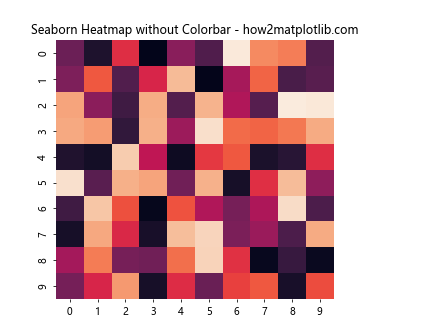
In this example, we create a Seaborn heatmap, which automatically includes a colorbar. We then use fig.axes[-1].remove() to remove the last axis, which is typically the colorbar in Seaborn plots.
Method 7: Customizing Colorbar Removal for Specific Plot Types
Different types of plots in Matplotlib may require slightly different approaches to remove colorbars. Let’s look at how to remove colorbars from some common plot types:
Removing Colorbar from Contour Plot
import matplotlib.pyplot as plt
import numpy as np
# Create sample data
x = np.linspace(-3, 3, 100)
y = np.linspace(-3, 3, 100)
X, Y = np.meshgrid(x, y)
Z = np.sin(X) * np.cos(Y)
# Create a figure and axis
fig, ax = plt.subplots()
# Create a contour plot
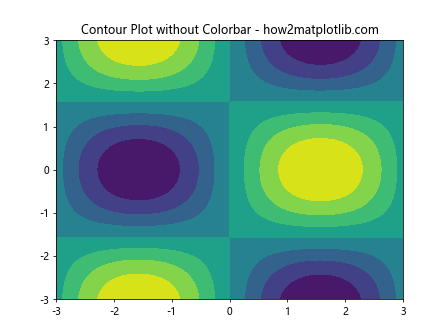
cs = ax.contourf(X, Y, Z)
# Add a colorbar
cbar = plt.colorbar(cs)
# Remove the colorbar
cbar.remove()
# Set title
plt.title("Contour Plot without Colorbar - how2matplotlib.com")
# Show the plot
plt.show()
Output:
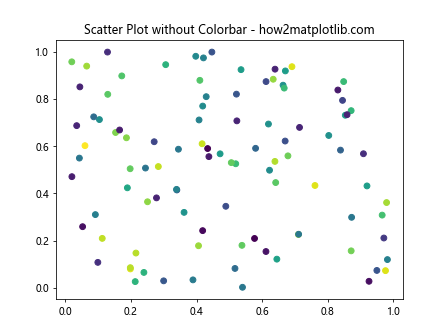
Removing Colorbar from Scatter Plot
import matplotlib.pyplot as plt
import numpy as np

# Create sample data
x = np.random.rand(100)
y = np.random.rand(100)
colors = np.random.rand(100)

# Create a figure and axis
fig, ax = plt.subplots()

# Create a scatter plot
sc = ax.scatter(x, y, c=colors)

# Add a colorbar
cbar = plt.colorbar(sc)

# Remove the colorbar
cbar.remove()

# Set title
plt.title("Scatter Plot without Colorbar - how2matplotlib.com")

# Show the plot
plt.show()
Output:
Method 8: Removing Colorbar in 3D Plots
When working with 3D plots in Matplotlib, removing colorbars requires a slightly different approach. Here’s an example of how to remove a colorbar from a 3D surface plot:
import matplotlib.pyplot as plt
import numpy as np
from mpl_toolkits.mplot3d import Axes3D

# Create sample data
x = np.linspace(-5, 5, 50)
y = np.linspace(-5, 5, 50)
X, Y = np.meshgrid(x, y)
Z = np.sin(np.sqrt(X**2 + Y**2))

# Create a figure and 3D axis
fig = plt.figure()
ax = fig.add_subplot(111, projection='3d')

# Create a surface plot
surf = ax.plot_surface(X, Y, Z, cmap='viridis')

# Add a colorbar
cbar = fig.colorbar(surf)

# Remove the colorbar
cbar.remove()

# Set title
ax.set_title("3D Surface Plot without Colorbar - how2matplotlib.com")

# Show the plot
plt.show()
Output:
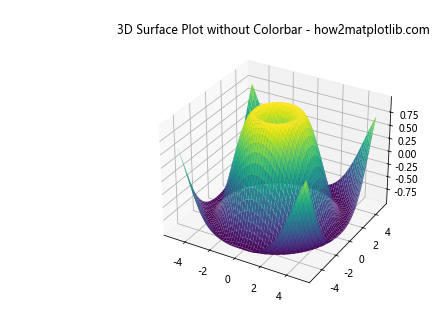
In this example, we create a 3D surface plot, add a colorbar, and then remove it using the remove() method.
Method 9: Removing Colorbar in Animated Plots
When creating animated plots in Matplotlib, you may want to remove colorbars to simplify the animation or save space. Here’s an example of how to remove a colorbar from an animated plot:
import matplotlib.pyplot as plt
import numpy as np
from matplotlib.animation import FuncAnimation

# Create sample data
x = np.linspace(0, 2 * np.pi, 100)
y = np.linspace(0, 2 * np.pi, 100)
X, Y = np.meshgrid(x, y)

# Create a figure and axis
fig, ax = plt.subplots()

# Initialize the plot
im = ax.imshow(np.sin(X) * np.cos(Y), cmap='viridis', animated=True)

# Add a colorbar
cbar = plt.colorbar(im)

# Remove the colorbar
cbar.remove()

# Animation update function
def update(frame):
    im.set_array(np.sin(X + frame/10) * np.cos(Y + frame/10))
    return [im]

# Create the animation
anim = FuncAnimation(fig, update, frames=100, interval=50, blit=True)

# Set title
ax.set_title("Animated Plot without Colorbar - how2matplotlib.com")

# Show the plot
plt.show()
Output:
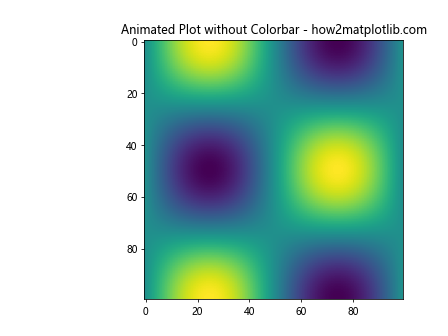
In this example, we create an animated plot, add a colorbar, and then remove it before starting the animation.
Method 10: Removing Colorbar in Subplots
When working with multiple subplots, you may want to remove colorbars from specific subplots while keeping them in others. Here’s an example of how to selectively remove colorbars in a subplot layout:
import matplotlib.pyplot as plt
import numpy as np

# Create sample data
data1 = np.random.rand(10, 10)
data2 = np.random.rand(10, 10)
data3 = np.random.rand(10, 10)
data4 = np.random.rand(10, 10)

# Create a figure with four subplots
fig, ((ax1, ax2), (ax3, ax4)) = plt.subplots(2, 2, figsize=(12, 10))

# Create color-mapped plots in each subplot
im1 = ax1.imshow(data1)
im2 = ax2.imshow(data2)
im3 = ax3.imshow(data3)
im4 = ax4.imshow(data4)

# Add colorbars to all subplots
cbar1 = plt.colorbar(im1, ax=ax1)
cbar2 = plt.colorbar(im2, ax=ax2)
cbar3 = plt.colorbar(im3, ax=ax3)
cbar4 = plt.colorbar(im4, ax=ax4)

# Remove colorbars from specific subplots
cbar1.remove()
cbar3.remove()

# Set titles
ax1.set_title("Subplot 1 (No Colorbar) - how2matplotlib.com")
ax2.set_title("Subplot 2 (With Colorbar) - how2matplotlib.com")
ax3.set_title("Subplot 3 (No Colorbar) - how2matplotlib.com")
ax4.set_title("Subplot 4 (With Colorbar) - how2matplotlib.com")

# Adjust layout
plt.tight_layout()

# Show the plot
plt.show()
Output:
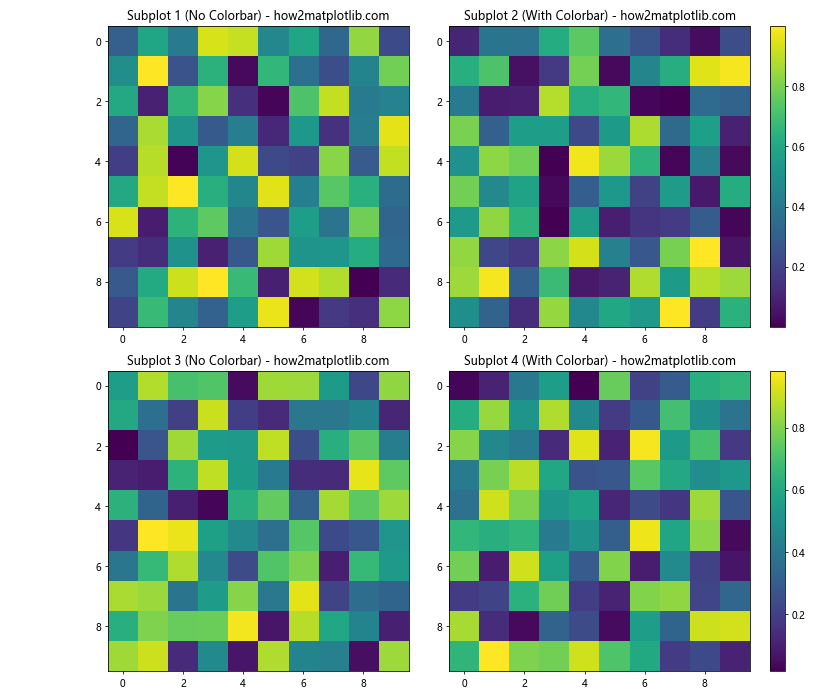
In this example, we create four subplots, add colorbars to all of them, and then selectively remove colorbars from the first and third subplots.
Best Practices for Removing Colorbars in Matplotlib
When removing colorbars from figures in Matplotlib, it’s important to follow some best practices to ensure your plots are clear, informative, and visually appealing. Here are some tips to keep in mind:
- Consider the purpose of your plot: Before removing a colorbar, think about whether it’s necessary for understanding the data. If the colorbar provides crucial information, consider alternative ways to present it.
Adjust plot layout: After removing a colorbar, use
plt.tight_layout()or manually adjust the plot dimensions to ensure the remaining elements are properly sized and positioned.Provide alternative color information: If you remove a colorbar, consider adding a color legend or including color information in the plot title or annotations.
Be consistent: If you’re creating multiple plots, be consistent in your approach to colorbars. Either include them in all plots or remove them from all plots, unless there’s a specific reason for variation.
Document your changes: If you’re sharing your plots or code, make sure to document why you’ve removed the colorbar and how the color information can be interpreted without it.
Test different methods: Experiment with different methods of removing colorbars to find the one that works best for your specific plot and data.
Consider accessibility: When removing colorbars, ensure that your plot is still accessible to people with color vision deficiencies. You may need to use alternative methods to convey the information previously provided by the colorbar.
Advanced Techniques for Colorbar Removal and Customization
While removing colorbars is often straightforward, there are some advanced techniques you can use to further customize your plots after removing colorbars. Let’s explore some of these techniques: