How to Create Dynamic Colorbar Animations in Matplotlib
Animating the Colorbar in Matplotlib is a powerful technique that can bring your data visualizations to life. This article will explore various methods and techniques for creating dynamic colorbar animations using Matplotlib, one of the most popular plotting libraries in Python. We’ll cover everything from basic concepts to advanced techniques, providing you with a comprehensive understanding of how to animate colorbars effectively.
Understanding the Basics of Animating the Colorbar in Matplotlib
Before diving into the specifics of animating the colorbar in Matplotlib, it’s essential to understand the fundamental concepts. A colorbar in Matplotlib is typically used to represent the mapping between color values and data values in a plot. By animating the colorbar, we can create dynamic visualizations that show how data changes over time or across different parameters.
To begin with animating the colorbar in Matplotlib, we need to familiarize ourselves with the following components:
- The
matplotlib.pyplotmodule - The
matplotlib.animationmodule - The
colorbarfunction - The
FuncAnimationclass
Let’s start with a simple example to illustrate the basic concept of animating the colorbar in Matplotlib:
import numpy as np
import matplotlib.pyplot as plt
from matplotlib.animation import FuncAnimation

# Create a figure and axis
fig, ax = plt.subplots()

# Generate initial data
x = np.linspace(0, 2 * np.pi, 100)
y = np.sin(x)
scatter = ax.scatter(x, y, c=y, cmap='viridis')

# Add a colorbar
cbar = plt.colorbar(scatter)
cbar.set_label('Value from how2matplotlib.com')

# Animation update function
def update(frame):
    y = np.sin(x + frame / 10)
    scatter.set_array(y)
    return scatter,

# Create the animation
ani = FuncAnimation(fig, update, frames=100, interval=50, blit=True)

plt.title('Animating the Colorbar in Matplotlib')
plt.xlabel('X-axis')
plt.ylabel('Y-axis')
plt.show()
Output:
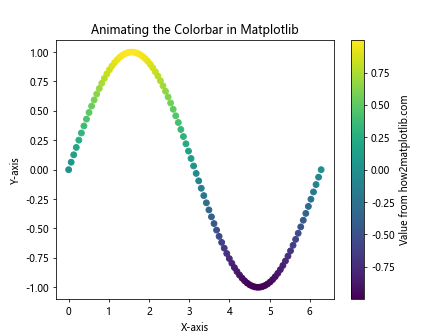
In this example, we create a scatter plot of a sine wave and animate both the data points and the colorbar. The update function changes the y-values of the scatter plot in each frame, which in turn updates the colors of the points and the colorbar.
Advanced Techniques for Animating the Colorbar in Matplotlib
Now that we’ve covered the basics, let’s explore some more advanced techniques for animating the colorbar in Matplotlib. These techniques will allow you to create more complex and visually appealing animations.
Animating Colorbar Limits
One way to create an interesting animation is by changing the limits of the colorbar over time. This can be particularly useful when visualizing data with changing ranges.
import numpy as np
import matplotlib.pyplot as plt
from matplotlib.animation import FuncAnimation

fig, ax = plt.subplots()

x = np.linspace(0, 10, 100)
y = np.linspace(0, 10, 100)
X, Y = np.meshgrid(x, y)

def f(x, y, t):
    return np.sin(x + t) * np.cos(y + t)

im = ax.imshow(f(X, Y, 0), cmap='plasma', animated=True)
cbar = plt.colorbar(im)
cbar.set_label('Value from how2matplotlib.com')

def update(frame):
    im.set_array(f(X, Y, frame / 10))
    im.set_clim(vmin=-1 - frame/100, vmax=1 + frame/100)
    cbar.update_normal(im)
    return im,

ani = FuncAnimation(fig, update, frames=100, interval=50, blit=True)

plt.title('Animating the Colorbar in Matplotlib: Changing Limits')
plt.show()
Output:
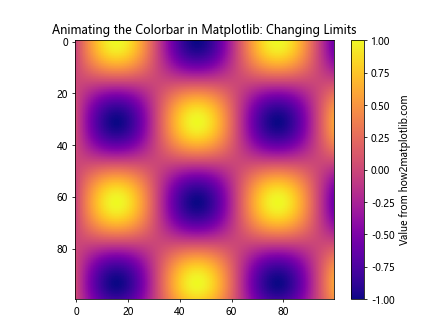
In this example, we create a 2D heatmap and animate both the data and the colorbar limits. The update function changes the data and adjusts the colorbar limits in each frame, creating a dynamic visualization.
Animating Colorbar Colors
Another interesting technique is to animate the colors of the colorbar itself. This can be achieved by changing the colormap during the animation.
import numpy as np
import matplotlib.pyplot as plt
from matplotlib.animation import FuncAnimation
from matplotlib.colors import LinearSegmentedColormap

fig, ax = plt.subplots()

x = np.linspace(0, 10, 100)
y = np.linspace(0, 10, 100)
X, Y = np.meshgrid(x, y)

Z = np.sin(X) * np.cos(Y)

im = ax.imshow(Z, cmap='viridis', animated=True)
cbar = plt.colorbar(im)
cbar.set_label('Value from how2matplotlib.com')

def create_colormap(t):
    r = np.array([1, 0, 0])
    g = np.array([0, 1, 0])
    b = np.array([0, 0, 1])

    color1 = r * (1 - t) + g * t
    color2 = g * (1 - t) + b * t

    return LinearSegmentedColormap.from_list("custom", [color1, color2])

def update(frame):
    t = frame / 100
    new_cmap = create_colormap(t)
    im.set_cmap(new_cmap)
    cbar.update_normal(im)
    return im,

ani = FuncAnimation(fig, update, frames=100, interval=50, blit=True)

plt.title('Animating the Colorbar in Matplotlib: Changing Colors')
plt.show()
Output:
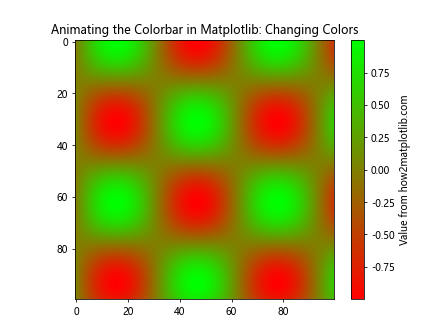
In this example, we create a custom colormap that changes over time. The update function generates a new colormap in each frame and applies it to both the image and the colorbar.
Animating the Colorbar in Matplotlib with Different Plot Types
Animating the colorbar in Matplotlib can be applied to various types of plots. Let’s explore how to animate colorbars with different plot types.
Animating Colorbar in Contour Plots
Contour plots are excellent for visualizing 3D data on a 2D plane. Animating the colorbar in a contour plot can help illustrate changes in the data distribution over time.
import numpy as np
import matplotlib.pyplot as plt
from matplotlib.animation import FuncAnimation

fig, ax = plt.subplots()

x = np.linspace(-3, 3, 100)
y = np.linspace(-3, 3, 100)
X, Y = np.meshgrid(x, y)

def f(x, y, t):
    return np.sin(x + t) * np.cos(y + t) * np.exp(-(x**2 + y**2) / 10)

contour = ax.contourf(X, Y, f(X, Y, 0), cmap='coolwarm', levels=20)
cbar = plt.colorbar(contour)
cbar.set_label('Value from how2matplotlib.com')

def update(frame):
    ax.clear()
    contour = ax.contourf(X, Y, f(X, Y, frame / 10), cmap='coolwarm', levels=20)
    cbar.update_normal(contour)
    ax.set_title(f'Animating the Colorbar in Matplotlib: Frame {frame}')
    return contour,

ani = FuncAnimation(fig, update, frames=100, interval=50, blit=False)

plt.show()
Output:
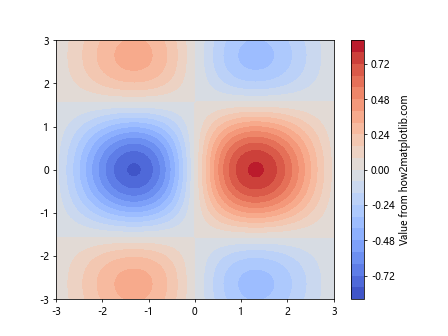
In this example, we create a contour plot of a 2D function that changes over time. The update function recalculates the contours in each frame and updates the colorbar accordingly.
Animating Colorbar in 3D Surface Plots
3D surface plots can benefit greatly from animated colorbars, as they can help visualize changes in height and color simultaneously.
import numpy as np
import matplotlib.pyplot as plt
from matplotlib.animation import FuncAnimation
from mpl_toolkits.mplot3d import Axes3D

fig = plt.figure()
ax = fig.add_subplot(111, projection='3d')

x = np.linspace(-5, 5, 50)
y = np.linspace(-5, 5, 50)
X, Y = np.meshgrid(x, y)

def f(x, y, t):
    return np.sin(np.sqrt(x**2 + y**2) + t)

surf = ax.plot_surface(X, Y, f(X, Y, 0), cmap='viridis')
cbar = fig.colorbar(surf)
cbar.set_label('Value from how2matplotlib.com')

def update(frame):
    ax.clear()
    surf = ax.plot_surface(X, Y, f(X, Y, frame / 10), cmap='viridis')
    ax.set_zlim(-1, 1)
    cbar.update_normal(surf)
    ax.set_title(f'Animating the Colorbar in Matplotlib: Frame {frame}')
    return surf,

ani = FuncAnimation(fig, update, frames=100, interval=50, blit=False)

plt.show()
Output:
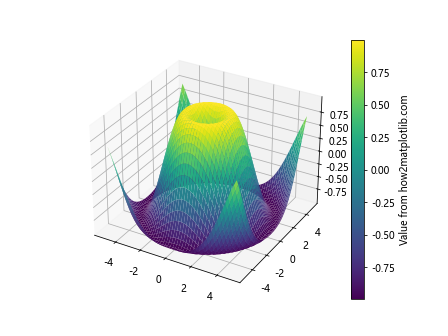
In this example, we create a 3D surface plot that changes over time. The update function recalculates the surface in each frame and updates both the plot and the colorbar.
Advanced Colorbar Animation Techniques in Matplotlib
Let’s explore some more advanced techniques for animating the colorbar in Matplotlib, including custom colormaps, multiple colorbars, and interactive animations.
Animating Multiple Colorbars
In some cases, you might want to animate multiple colorbars simultaneously. Here’s an example of how to achieve this:
import numpy as np
import matplotlib.pyplot as plt
from matplotlib.animation import FuncAnimation

fig, (ax1, ax2) = plt.subplots(1, 2, figsize=(12, 5))

x = np.linspace(0, 10, 100)
y = np.linspace(0, 10, 100)
X, Y = np.meshgrid(x, y)

def f1(x, y, t):
    return np.sin(x + t) * np.cos(y + t)

def f2(x, y, t):
    return np.cos(x - t) * np.sin(y - t)

im1 = ax1.imshow(f1(X, Y, 0), cmap='viridis', animated=True)
im2 = ax2.imshow(f2(X, Y, 0), cmap='plasma', animated=True)

cbar1 = plt.colorbar(im1, ax=ax1)
cbar2 = plt.colorbar(im2, ax=ax2)

cbar1.set_label('Value 1 from how2matplotlib.com')
cbar2.set_label('Value 2 from how2matplotlib.com')

def update(frame):
    t = frame / 10
    im1.set_array(f1(X, Y, t))
    im2.set_array(f2(X, Y, t))

    im1.set_clim(vmin=-1 - t/5, vmax=1 + t/5)
    im2.set_clim(vmin=-1 - t/10, vmax=1 + t/10)

    cbar1.update_normal(im1)
    cbar2.update_normal(im2)

    ax1.set_title(f'Animating Colorbar 1: Frame {frame}')
    ax2.set_title(f'Animating Colorbar 2: Frame {frame}')

    return im1, im2

ani = FuncAnimation(fig, update, frames=100, interval=50, blit=True)

plt.tight_layout()
plt.show()
Output:
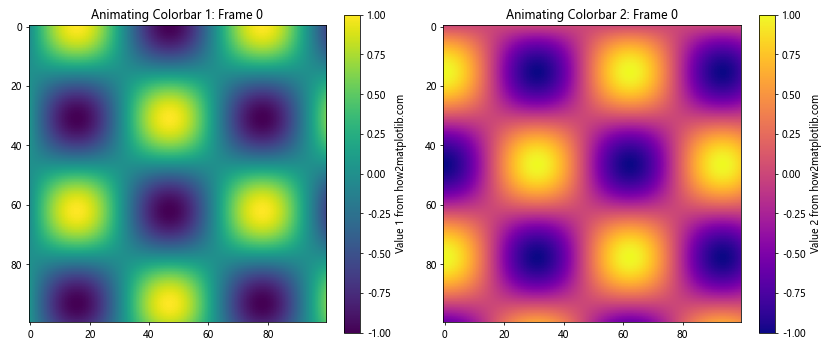
In this example, we create two subplots, each with its own animated colorbar. The update function updates both plots and their respective colorbars in each frame.
Interactive Colorbar Animations
Adding interactivity to your colorbar animations can enhance the user experience. Here’s an example of how to create an interactive colorbar animation using Matplotlib’s widgets:
import numpy as np
import matplotlib.pyplot as plt
from matplotlib.animation import FuncAnimation
from matplotlib.widgets import Slider

fig, ax = plt.subplots()
plt.subplots_adjust(bottom=0.25)

x = np.linspace(0, 10, 100)
y = np.linspace(0, 10, 100)
X, Y = np.meshgrid(x, y)

def f(x, y, t, freq):
    return np.sin(freq * (x + t)) * np.cos(freq * (y + t))

t = 0
freq = 1

im = ax.imshow(f(X, Y, t, freq), cmap='viridis', animated=True)
cbar = plt.colorbar(im)
cbar.set_label('Value from how2matplotlib.com')

ax_time = plt.axes([0.125, 0.1, 0.775, 0.03])
ax_freq = plt.axes([0.125, 0.15, 0.775, 0.03])

s_time = Slider(ax_time, 'Time', 0, 10, valinit=t)
s_freq = Slider(ax_freq, 'Frequency', 0.1, 5, valinit=freq)

def update(val):
    t = s_time.val
    freq = s_freq.val
    im.set_array(f(X, Y, t, freq))
    cbar.update_normal(im)
    fig.canvas.draw_idle()

s_time.on_changed(update)
s_freq.on_changed(update)

def animate(frame):
    s_time.set_val((frame / 100) * 10)
    return im,

ani = FuncAnimation(fig, animate, frames=100, interval=50, blit=True)

plt.title('Interactive Animating the Colorbar in Matplotlib')
plt.show()
Output:
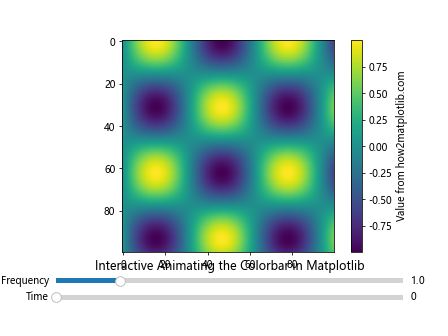
In this example, we create an interactive animation with two sliders: one for time and one for frequency. The user can adjust these parameters in real-time, and the plot and colorbar will update accordingly. The animation also automatically updates the time slider.
Optimizing Colorbar Animations in Matplotlib
When animating the colorbar in Matplotlib, it’s important to consider performance, especially for complex visualizations or long animations. Here are some tips to optimize your colorbar animations:
- Use
blit=Truein FuncAnimation when possible - Minimize the number of elements being updated in each frame
- Use appropriate data types (e.g., float32 instead of float64) to reduce memory usage
- Consider using a lower frame rate for smoother performance
Let’s implement these optimizations in an example:
import numpy as np
import matplotlib.pyplot as plt
from matplotlib.animation import FuncAnimation

fig, ax = plt.subplots()

x = np.linspace(0, 10, 100).astype(np.float32)
y = np.linspace(0, 10, 100).astype(np.float32)
X, Y = np.meshgrid(x, y)

def f(x, y, t):
    return np.sin(x + t) * np.cos(y + t)

im = ax.imshow(f(X, Y, 0), cmap='viridis', animated=True)
cbar = plt.colorbar(im)
cbar.set_label('Value from how2matplotlib.com')

text = ax.text(0.02, 0.95, '', transform=ax.transAxes)

def update(frame):
    t = frame / 10
    im.set_array(f(X, Y, t))
    text.set_text(f'Frame: {frame}')
    return im, text

ani = FuncAnimation(fig, update, frames=100, interval=50, blit=True)

plt.title('Optimized Animating the Colorbar in Matplotlib')
plt.show()
Output:
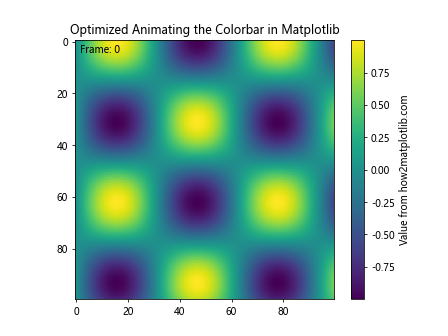
In this optimized example, we use float32 data types, minimize the number of elements being updated in each frame, and use blit=True for better performance.
Advanced Colorbar Customization in Matplotlib Animations
Customizing the appearance of your colorbar can greatly enhance the visual appeal of your animations. Let’s explore some advanced customization techniques:
Custom Tick Locations and Labels
You can customize the tick locations and labels on your colorbar to better represent your data:
import numpy as np
import matplotlib.pyplot as plt
from matplotlib.animation import FuncAnimation
from matplotlib.colors import Normalize

fig, ax = plt.subplots()

x = np.linspace(0, 10, 100)
y = np.linspace(0, 10, 100)
X, Y = np.meshgrid(x, y)

def f(x, y, t):
    return np.exp(-(((x-5+t)**2 + (y-5)**2) / 4))

norm = Normalize(vmin=0, vmax=1)
im = ax.imshow(f(X, Y, 0), cmap='viridis', norm=norm, animated=True)

cbar = plt.colorbar(im, extend='both')
cbar.set_label('Probability from how2matplotlib.com')

tick_locs = [0, 0.2, 0.4, 0.6, 0.8, 1]
tick_labels = ['0%', '20%', '40%', '60%', '80%', '100%']
cbar.set_ticks(tick_locs)
cbar.set_ticklabels(tick_labels)

def update(frame):
    t = frame / 20
    im.set_array(f(X, Y, t))
    return im,

ani = FuncAnimation(fig, update, frames=100, interval=50, blit=True)

plt.title('Animating the Colorbar in Matplotlib: Custom Ticks')
plt.show()
Output:
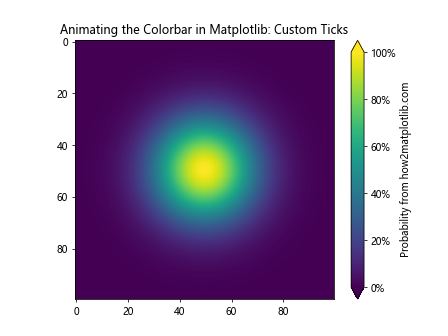
In this example, we customize the tick locations and labels of the colorbar to display percentages instead of raw values.
Logarithmic Colorbar Scale
For data with a large range of values, a logarithmic colorbar scale can be more appropriate:
import numpy as np
import matplotlib.pyplot as plt
from matplotlib.animation import FuncAnimation
from matplotlib.colors import LogNorm

fig, ax = plt.subplots()

x = np.linspace(0, 10, 100)
y = np.linspace(0, 10, 100)
X, Y = np.meshgrid(x, y)

def f(x, y, t):
    return 10**(np.sin(x + t) * np.cos(y + t) + 3)

norm = LogNorm(vmin=1, vmax=10000)
im = ax.imshow(f(X, Y, 0), cmap='viridis', norm=norm, animated=True)

cbar = plt.colorbar(im)
cbar.set_label('Log Value from how2matplotlib.com')

def update(frame):
    t = frame / 10
    im.set_array(f(X, Y, t))
    return im,

ani = FuncAnimation(fig, update, frames=100, interval=50, blit=True)

plt.title('Animating the Colorbar in Matplotlib: Log Scale')
plt.show()
Output:
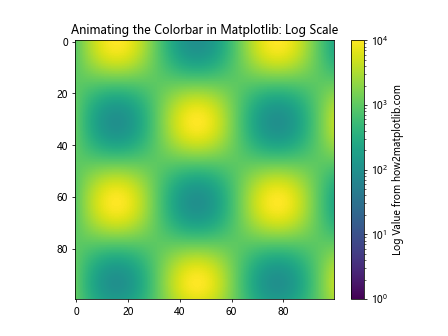
This example demonstrates how to use a logarithmic scale for the colorbar, which can be useful for data with exponential growth or decay.
Combining Colorbar Animations with Other Matplotlib Features
Animating the colorbar in Matplotlib can be even more powerful when combined with other Matplotlib features. Let’s explore some examples:
Animated Colorbar with Subplots
You can create animations with multiple subplots, each with its own animated colorbar:
import numpy as np
import matplotlib.pyplot as plt
from matplotlib.animation import FuncAnimation

fig, (ax1, ax2) = plt.subplots(1, 2, figsize=(12, 5))

x = np.linspace(0, 10, 100)
y = np.linspace(0, 10, 100)
X, Y = np.meshgrid(x, y)

def f1(x, y, t):
    return np.sin(x + t) * np.cos(y + t)

def f2(x, y, t):
    return np.exp(-(((x-5+t)**2 + (y-5)**2) / 4))

im1 = ax1.imshow(f1(X, Y, 0), cmap='viridis', animated=True)
im2 = ax2.imshow(f2(X, Y, 0), cmap='plasma', animated=True)

cbar1 = plt.colorbar(im1, ax=ax1)
cbar2 = plt.colorbar(im2, ax=ax2)

cbar1.set_label('Value 1 from how2matplotlib.com')
cbar2.set_label('Value 2 from how2matplotlib.com')

def update(frame):
    t = frame / 10
    im1.set_array(f1(X, Y, t))
    im2.set_array(f2(X, Y, t))
    return im1, im2

ani = FuncAnimation(fig, update, frames=100, interval=50, blit=True)

ax1.set_title('Animating Colorbar 1')
ax2.set_title('Animating Colorbar 2')
plt.tight_layout()
plt.show()
Output:
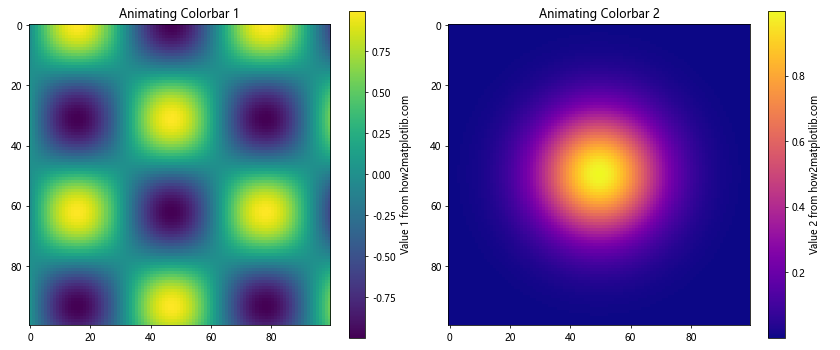
This example creates two subplots with different animated colorbars, allowing you to compare multiple datasets or visualizations simultaneously.
Animated Colorbar with Annotations
You can add annotations to your plot that update along with the colorbar animation:
import numpy as np
import matplotlib.pyplot as plt
from matplotlib.animation import FuncAnimation

fig, ax = plt.subplots()

x = np.linspace(0, 10, 100)
y = np.linspace(0, 10, 100)
X, Y = np.meshgrid(x, y)

def f(x, y, t):
    return np.sin(x + t) * np.cos(y + t)

im = ax.imshow(f(X, Y, 0), cmap='viridis', animated=True)
cbar = plt.colorbar(im)
cbar.set_label('Value from how2matplotlib.com')

text = ax.text(0.02, 0.95, '', transform=ax.transAxes, color='white')
arrow = ax.annotate('', xy=(0, 0), xytext=(1, 1), arrowprops=dict(arrowstyle='->'))

def update(frame):
    t = frame / 10
    data = f(X, Y, t)
    im.set_array(data)

    max_val = np.max(data)
    max_pos = np.unravel_index(np.argmax(data), data.shape)

    text.set_text(f'Max: {max_val:.2f}')
    arrow.xy = max_pos
    arrow.xyann = (max_pos[1] + 10, max_pos[0] - 10)

    return im, text, arrow

ani = FuncAnimation(fig, update, frames=100, interval=50, blit=True)

plt.title('Animating the Colorbar in Matplotlib with Annotations')
plt.show()
Output:
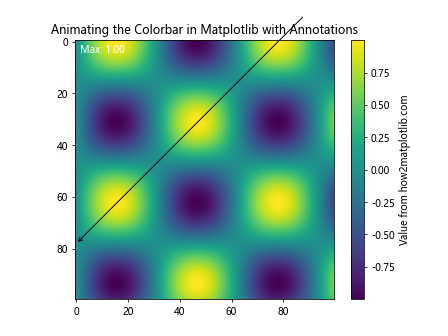
This example adds a text annotation showing the maximum value and an arrow pointing to the location of the maximum value, both of which update with each frame of the animation.
Exporting Colorbar Animations in Matplotlib
Once you’ve created your colorbar animation, you may want to save it for later use or sharing. Matplotlib provides several options for exporting animations:
Saving as a GIF
To save your animation as a GIF, you’ll need to install the pillow library. Here’s how to save the animation:
import numpy as np
import matplotlib.pyplot as plt
from matplotlib.animation import FuncAnimation, PillowWriter

fig, ax = plt.subplots()

x = np.linspace(0, 10, 100)
y = np.linspace(0, 10, 100)
X, Y = np.meshgrid(x, y)

def f(x, y, t):
    return np.sin(x + t) * np.cos(y + t)

im = ax.imshow(f(X, Y, 0), cmap='viridis', animated=True)
cbar = plt.colorbar(im)
cbar.set_label('Value from how2matplotlib.com')

def update(frame):
    t = frame / 10
    im.set_array(f(X, Y, t))
    return im,

ani = FuncAnimation(fig, update, frames=100, interval=50, blit=True)

plt.title('Animating the Colorbar in Matplotlib')

# Save the animation as a GIF
writer = PillowWriter(fps=25)
ani.save('colorbar_animation.gif', writer=writer)

plt.show()
Output:
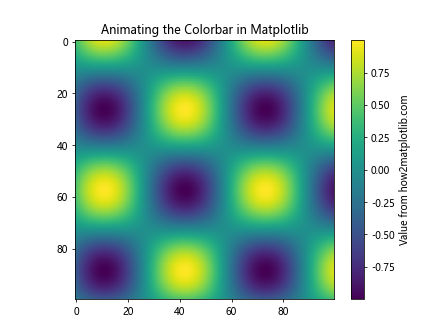
This script will save your animation as a GIF file named ‘colorbar_animation.gif’ in the same directory as your Python script.
Conclusion
Animating the colorbar in Matplotlib is a powerful technique that can bring your data visualizations to life. Throughout this comprehensive guide, we’ve explored various methods and techniques for creating dynamic colorbar animations, from basic concepts to advanced techniques.
We’ve covered:
- The basics of animating the colorbar in Matplotlib
- Advanced techniques for colorbar animations
- Animating colorbars with different plot types
- Custom colormap animations
- Multiple colorbar animations
- Interactive colorbar animations
- Optimizing colorbar animations for performance
- Advanced colorbar customization
- Combining colorbar animations with other Matplotlib features
- Exporting colorbar animations as GIFs and videos
By mastering these techniques, you’ll be able to create engaging and informative animated visualizations that effectively communicate your data’s story. Remember to experiment with different approaches and customize your animations to best suit your specific data and audience.