How to Create and Customize Matplotlib Dashed Line Spacing: A Comprehensive Guide
Matplotlib dashed line spacing is an essential aspect of data visualization that allows you to create visually appealing and informative plots. In this comprehensive guide, we’ll explore various techniques and methods to create, customize, and control dashed line spacing in Matplotlib. Whether you’re a beginner or an experienced data scientist, this article will provide you with valuable insights and practical examples to enhance your plotting skills.
Understanding Matplotlib Dashed Line Spacing
Matplotlib dashed line spacing refers to the pattern of dashes and gaps in a line plot. By adjusting the dashed line spacing, you can create different visual effects and emphasize specific aspects of your data. Matplotlib provides several ways to control dashed line spacing, including built-in line styles and custom dash patterns.
Let’s start with a simple example to illustrate how to create a dashed line in Matplotlib:
import matplotlib.pyplot as plt
import numpy as np

x = np.linspace(0, 10, 100)
y = np.sin(x)

plt.figure(figsize=(8, 6))
plt.plot(x, y, linestyle='--', label='how2matplotlib.com')
plt.title('Matplotlib Dashed Line Spacing Example')
plt.xlabel('X-axis')
plt.ylabel('Y-axis')
plt.legend()
plt.show()
Output:
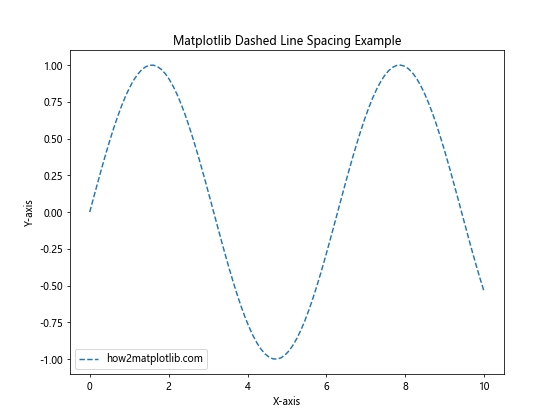
In this example, we create a simple sine wave plot with a dashed line using the linestyle='--' parameter. This is one of the built-in line styles in Matplotlib that creates a basic dashed line.
Built-in Line Styles for Matplotlib Dashed Line Spacing
Matplotlib offers several built-in line styles that you can use to create dashed lines with different spacing patterns. Here’s an example showcasing various built-in line styles:
import matplotlib.pyplot as plt
import numpy as np

x = np.linspace(0, 10, 100)
y = np.sin(x)

line_styles = ['-', '--', '-.', ':']
labels = ['Solid', 'Dashed', 'Dash-dot', 'Dotted']

plt.figure(figsize=(10, 6))
for style, label in zip(line_styles, labels):
    plt.plot(x, y + np.random.rand(), linestyle=style, label=f'{label} - how2matplotlib.com')

plt.title('Matplotlib Dashed Line Spacing: Built-in Line Styles')
plt.xlabel('X-axis')
plt.ylabel('Y-axis')
plt.legend()
plt.show()
Output:
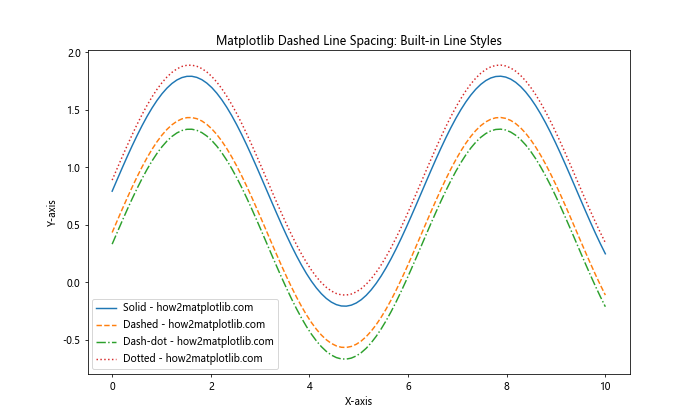
This example demonstrates four built-in line styles: solid, dashed, dash-dot, and dotted. Each line style creates a different dashed line spacing effect, allowing you to choose the most appropriate style for your visualization needs.
Custom Dash Patterns for Matplotlib Dashed Line Spacing
While built-in line styles are convenient, you may want more control over the dashed line spacing. Matplotlib allows you to create custom dash patterns using tuples of on/off lengths. Here’s an example:
import matplotlib.pyplot as plt
import numpy as np

x = np.linspace(0, 10, 100)
y = np.sin(x)

custom_dash_patterns = [(5, 2), (10, 4, 2, 4), (2, 2, 10, 2)]
labels = ['Pattern 1', 'Pattern 2', 'Pattern 3']

plt.figure(figsize=(10, 6))
for pattern, label in zip(custom_dash_patterns, labels):
    plt.plot(x, y + np.random.rand(), linestyle=(0, pattern), label=f'{label} - how2matplotlib.com')

plt.title('Matplotlib Dashed Line Spacing: Custom Dash Patterns')
plt.xlabel('X-axis')
plt.ylabel('Y-axis')
plt.legend()
plt.show()
Output:
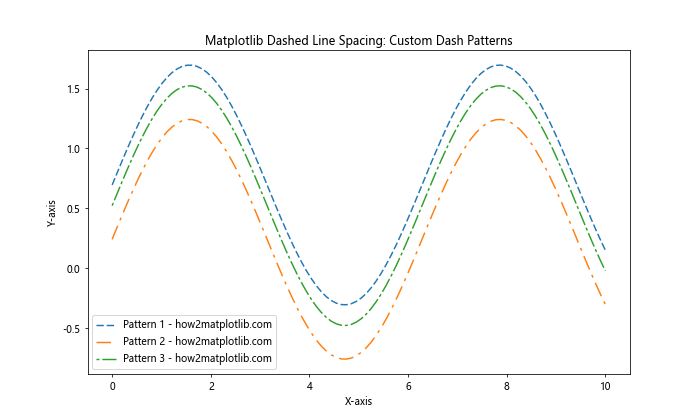
In this example, we define custom dash patterns using tuples. The first number in each tuple represents the length of the dash, while subsequent numbers represent the lengths of gaps and additional dashes. This allows for precise control over the dashed line spacing.
Adjusting Matplotlib Dashed Line Spacing with Line Properties
In addition to line styles and custom dash patterns, you can further customize the appearance of dashed lines by adjusting various line properties. Let’s explore some of these properties:
Line Width
Changing the line width can significantly impact the appearance of dashed lines. Here’s an example:
import matplotlib.pyplot as plt
import numpy as np

x = np.linspace(0, 10, 100)
y = np.sin(x)

line_widths = [1, 2, 4, 6]
labels = ['Width 1', 'Width 2', 'Width 4', 'Width 6']

plt.figure(figsize=(10, 6))
for width, label in zip(line_widths, labels):
    plt.plot(x, y + np.random.rand(), linestyle='--', linewidth=width, label=f'{label} - how2matplotlib.com')

plt.title('Matplotlib Dashed Line Spacing: Adjusting Line Width')
plt.xlabel('X-axis')
plt.ylabel('Y-axis')
plt.legend()
plt.show()
Output:
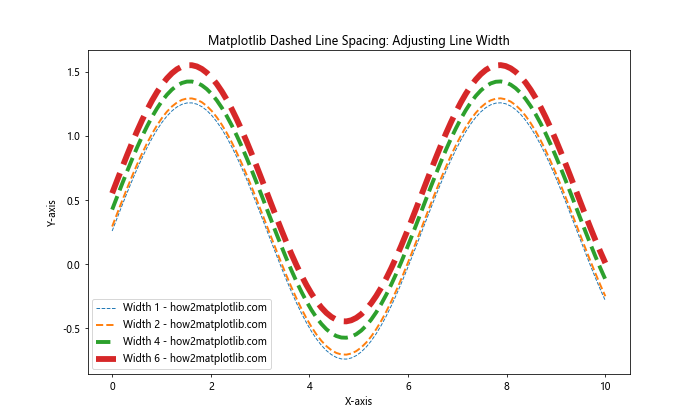
This example demonstrates how changing the line width affects the appearance of dashed lines. Thicker lines can make the dashed pattern more prominent and easier to distinguish.
Line Color
The color of dashed lines can also be customized to enhance visibility and differentiate between multiple lines:
import matplotlib.pyplot as plt
import numpy as np

x = np.linspace(0, 10, 100)
y = np.sin(x)

colors = ['red', 'blue', 'green', 'purple']
labels = ['Red', 'Blue', 'Green', 'Purple']

plt.figure(figsize=(10, 6))
for color, label in zip(colors, labels):
    plt.plot(x, y + np.random.rand(), linestyle='--', color=color, label=f'{label} - how2matplotlib.com')

plt.title('Matplotlib Dashed Line Spacing: Customizing Line Color')
plt.xlabel('X-axis')
plt.ylabel('Y-axis')
plt.legend()
plt.show()
Output:
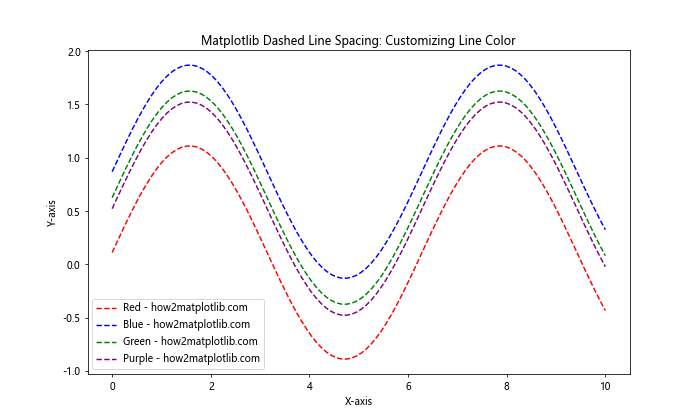
By using different colors for dashed lines, you can create visually appealing plots and make it easier for viewers to distinguish between different data series.
Combining Multiple Matplotlib Dashed Line Spacing Techniques
To create even more sophisticated visualizations, you can combine various dashed line spacing techniques. Here’s an example that demonstrates the combination of custom dash patterns, line widths, and colors:
import matplotlib.pyplot as plt
import numpy as np

x = np.linspace(0, 10, 100)
y = np.sin(x)

styles = [
    {'pattern': (5, 2), 'width': 1, 'color': 'red'},
    {'pattern': (10, 4, 2, 4), 'width': 2, 'color': 'blue'},
    {'pattern': (2, 2, 10, 2), 'width': 3, 'color': 'green'}
]

plt.figure(figsize=(10, 6))
for i, style in enumerate(styles, 1):
    plt.plot(x, y + i*0.5, linestyle=(0, style['pattern']), linewidth=style['width'], color=style['color'],
             label=f'Style {i} - how2matplotlib.com')

plt.title('Matplotlib Dashed Line Spacing: Combined Techniques')
plt.xlabel('X-axis')
plt.ylabel('Y-axis')
plt.legend()
plt.show()
Output:
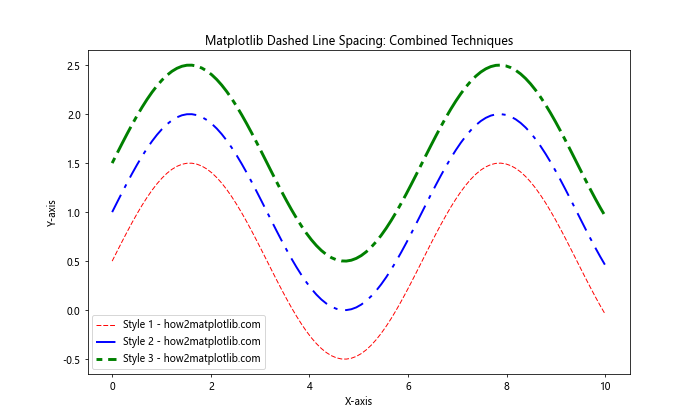
This example showcases how you can create unique and visually appealing dashed lines by combining custom dash patterns, line widths, and colors.
Matplotlib Dashed Line Spacing in Different Plot Types
Dashed line spacing can be applied to various types of plots in Matplotlib. Let’s explore how to use dashed lines in different plot types:
Scatter Plot with Dashed Trend Line
import matplotlib.pyplot as plt
import numpy as np

x = np.linspace(0, 10, 50)
y = 2 * x + 1 + np.random.randn(50) * 2

plt.figure(figsize=(10, 6))
plt.scatter(x, y, label='Data Points - how2matplotlib.com')
plt.plot(x, 2*x + 1, linestyle='--', color='red', label='Trend Line - how2matplotlib.com')
plt.title('Matplotlib Dashed Line Spacing: Scatter Plot with Trend Line')
plt.xlabel('X-axis')
plt.ylabel('Y-axis')
plt.legend()
plt.show()
Output:
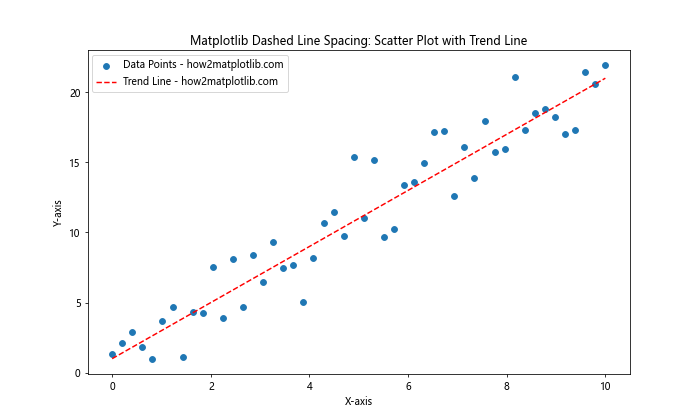
In this example, we create a scatter plot with a dashed trend line. The dashed line helps to visualize the overall trend in the data without obscuring the individual data points.
Bar Plot with Dashed Reference Line
import matplotlib.pyplot as plt
import numpy as np

categories = ['A', 'B', 'C', 'D', 'E']
values = np.random.randint(10, 100, 5)

plt.figure(figsize=(10, 6))
plt.bar(categories, values, label='Values - how2matplotlib.com')
plt.axhline(y=np.mean(values), linestyle='--', color='red', label='Mean - how2matplotlib.com')
plt.title('Matplotlib Dashed Line Spacing: Bar Plot with Reference Line')
plt.xlabel('Categories')
plt.ylabel('Values')
plt.legend()
plt.show()
Output:
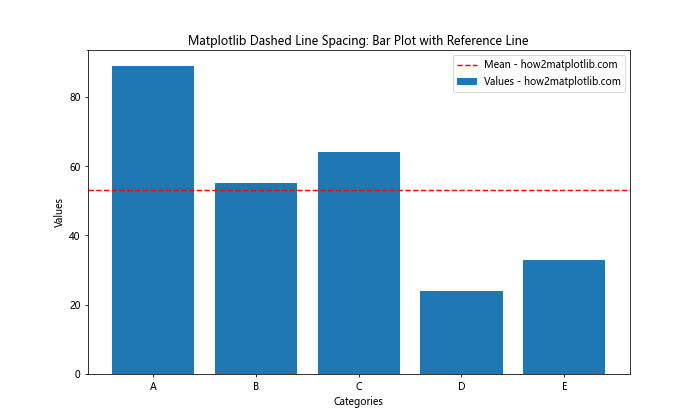
This example demonstrates how to add a dashed reference line (in this case, the mean value) to a bar plot. The dashed line helps to provide context and comparison for the bar heights.
Advanced Matplotlib Dashed Line Spacing Techniques
Now that we’ve covered the basics, let’s explore some advanced techniques for working with dashed line spacing in Matplotlib:
Animated Dashed Lines
You can create animated dashed lines to add dynamic elements to your visualizations:
import matplotlib.pyplot as plt
import numpy as np
from matplotlib.animation import FuncAnimation

fig, ax = plt.subplots(figsize=(10, 6))
x = np.linspace(0, 10, 100)
line, = ax.plot(x, np.sin(x), linestyle='--', animated=True)

def update(frame):
    line.set_ydata(np.sin(x + frame / 10))
    return line,

ani = FuncAnimation(fig, update, frames=100, interval=50, blit=True)
plt.title('Matplotlib Dashed Line Spacing: Animated Dashed Line')
plt.xlabel('X-axis')
plt.ylabel('Y-axis')
plt.text(0.5, 0.95, 'how2matplotlib.com', transform=ax.transAxes, ha='center')
plt.show()
Output:
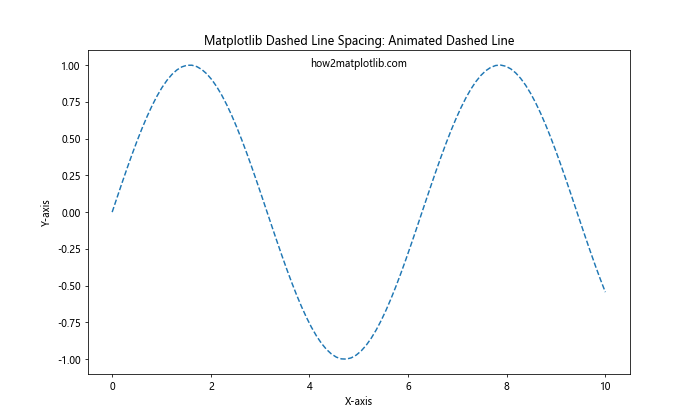
This example creates an animated dashed line that moves over time, demonstrating how dashed lines can be used in dynamic visualizations.
Dashed Line Patterns in Filled Areas
You can also use dashed line patterns to fill areas in plots:
import matplotlib.pyplot as plt
import numpy as np

x = np.linspace(0, 10, 100)
y1 = np.sin(x)
y2 = np.cos(x)

plt.figure(figsize=(10, 6))
plt.fill_between(x, y1, y2, where=(y1 > y2), facecolor='none', hatch='///', edgecolor='red', label='Sin > Cos - how2matplotlib.com')
plt.fill_between(x, y1, y2, where=(y1 <= y2), facecolor='none', hatch='\\\\\\', edgecolor='blue', label='Sin <= Cos - how2matplotlib.com')
plt.plot(x, y1, label='Sin - how2matplotlib.com')
plt.plot(x, y2, label='Cos - how2matplotlib.com')
plt.title('Matplotlib Dashed Line Spacing: Filled Areas with Patterns')
plt.xlabel('X-axis')
plt.ylabel('Y-axis')
plt.legend()
plt.show()
Output:
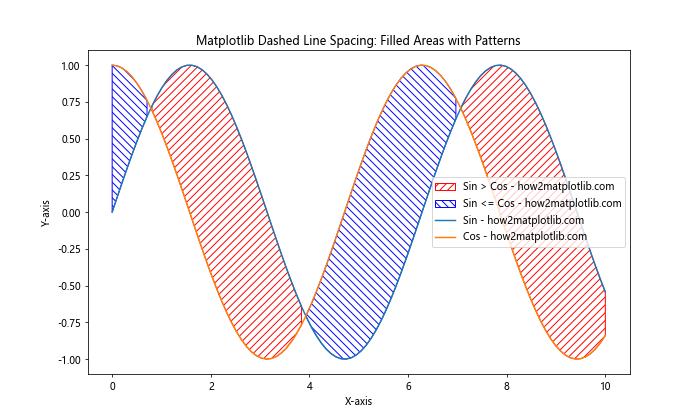
This example demonstrates how to use dashed line patterns to fill areas between two curves, creating a visually interesting and informative plot.
Best Practices for Matplotlib Dashed Line Spacing
When working with dashed line spacing in Matplotlib, consider the following best practices:
- Choose appropriate dash patterns: Select dash patterns that are easily distinguishable and don't create visual confusion.
Consider line width: Adjust the line width to ensure that dashed patterns are visible and clear, especially when plotting on small scales or for print media.
Use color effectively: Combine dashed line spacing with appropriate colors to enhance visibility and differentiate between multiple data series.
Maintain consistency: When using multiple dashed lines in a single plot, try to maintain consistency in dash patterns for similar data types or categories.
Provide clear legends: Always include a legend that explains the meaning of different dash patterns used in your plot.
Avoid overuse: While dashed lines can be effective, avoid overusing them in a single plot as it may lead to visual clutter.
Consider the plot type: Choose dashed line spacing that complements the type of plot you're creating (e.g., trend lines, reference lines, or data series).
Test for accessibility: Ensure that your dashed line patterns are distinguishable for viewers with color vision deficiencies.
Troubleshooting Common Issues with Matplotlib Dashed Line Spacing
When working with dashed line spacing in Matplotlib, you may encounter some common issues. Here are some troubleshooting tips: