How to Create Custom Matplotlib Colormaps from Tables: A Comprehensive Guide
Matplotlib colormaps from table are a powerful way to visualize data in Python. This article will explore how to create custom colormaps using data from tables, providing a detailed look at the process and offering numerous examples. We’ll cover various aspects of working with matplotlib colormaps from table, including how to load data, create colormaps, and apply them to different types of plots.
Understanding Matplotlib Colormaps from Table
Matplotlib colormaps from table are color mappings created using data stored in tabular format. These custom colormaps can be particularly useful when you want to represent specific data ranges or create unique visualizations that standard colormaps don’t adequately capture. By using matplotlib colormaps from table, you can tailor your color schemes to best represent your data and convey your message effectively.
Let’s start with a simple example of creating a matplotlib colormap from table:
import matplotlib.pyplot as plt
import numpy as np

# Create a table of color data
color_data = [
    [0.0, 1.0, 0.0, 0.0],  # Red
    [0.5, 0.0, 1.0, 0.0],  # Green
    [1.0, 0.0, 0.0, 1.0]   # Blue
]

# Create a custom colormap from the table
custom_cmap = plt.cm.colors.ListedColormap(color_data)

# Generate some sample data
x = np.linspace(0, 10, 100)
y = np.sin(x)

# Create a plot using the custom colormap
plt.figure(figsize=(10, 6))
plt.scatter(x, y, c=y, cmap=custom_cmap)
plt.colorbar(label='Value')
plt.title('Custom Colormap from Table - how2matplotlib.com')
plt.xlabel('X-axis')
plt.ylabel('Y-axis')
plt.show()
Output:
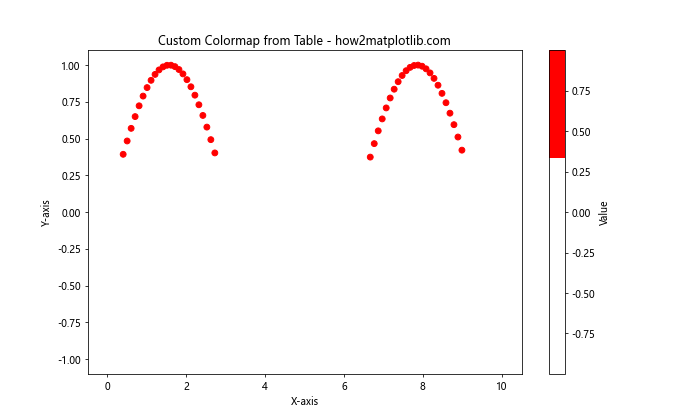
In this example, we created a simple table of color data and used it to create a custom colormap. We then applied this colormap to a scatter plot of sine wave data.
Loading Data for Matplotlib Colormaps from Table
When working with matplotlib colormaps from table, the first step is often loading the color data from an external source. This could be a CSV file, an Excel spreadsheet, or any other tabular data format. Let’s look at how to load data from a CSV file and create a colormap:
import matplotlib.pyplot as plt
import numpy as np
import pandas as pd

# Load color data from a CSV file
color_data = pd.read_csv('color_data.csv', header=None).values

# Create a custom colormap from the table
custom_cmap = plt.cm.colors.ListedColormap(color_data)

# Generate some sample data
x = np.random.rand(100)
y = np.random.rand(100)
z = np.random.rand(100)

# Create a plot using the custom colormap
plt.figure(figsize=(10, 6))
plt.scatter(x, y, c=z, cmap=custom_cmap, s=50)
plt.colorbar(label='Z Value')
plt.title('Matplotlib Colormap from Table (CSV) - how2matplotlib.com')
plt.xlabel('X-axis')
plt.ylabel('Y-axis')
plt.show()
In this example, we loaded color data from a CSV file using pandas, created a custom colormap, and applied it to a scatter plot of random data.
Creating Gradients with Matplotlib Colormaps from Table
One of the advantages of using matplotlib colormaps from table is the ability to create smooth gradients between colors. Let’s look at how to create a gradient colormap:
import matplotlib.pyplot as plt
import numpy as np
from matplotlib.colors import LinearSegmentedColormap

# Define color points for the gradient
color_points = {
    'red': [(0.0, 1.0, 1.0), (0.5, 0.0, 0.0), (1.0, 0.0, 0.0)],
    'green': [(0.0, 0.0, 0.0), (0.5, 1.0, 1.0), (1.0, 0.0, 0.0)],
    'blue': [(0.0, 0.0, 0.0), (0.5, 0.0, 0.0), (1.0, 1.0, 1.0)]
}

# Create a custom gradient colormap
custom_cmap = LinearSegmentedColormap('custom_gradient', color_points)

# Generate some sample data
x = np.linspace(0, 10, 100)
y = np.linspace(0, 10, 100)
X, Y = np.meshgrid(x, y)
Z = np.sin(X) * np.cos(Y)

# Create a plot using the custom gradient colormap
plt.figure(figsize=(10, 6))
plt.pcolormesh(X, Y, Z, cmap=custom_cmap)
plt.colorbar(label='Value')
plt.title('Gradient Colormap from Table - how2matplotlib.com')
plt.xlabel('X-axis')
plt.ylabel('Y-axis')
plt.show()
Output:
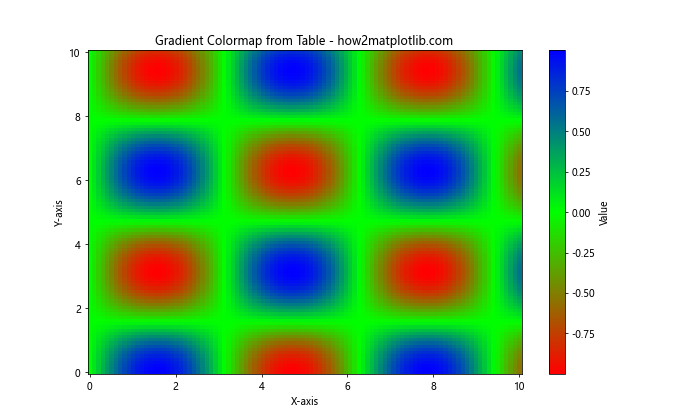
This example demonstrates how to create a gradient colormap using a table of color points. We then apply this colormap to a 2D plot of sine and cosine functions.
Applying Matplotlib Colormaps from Table to Different Plot Types
Matplotlib colormaps from table can be applied to various types of plots. Let’s explore how to use custom colormaps with different plot types:
Heatmaps with Custom Colormaps
import matplotlib.pyplot as plt
import numpy as np

# Create a table of color data
color_data = [
    [1.0, 0.0, 0.0],  # Red
    [0.0, 1.0, 0.0],  # Green
    [0.0, 0.0, 1.0]   # Blue
]

# Create a custom colormap from the table
custom_cmap = plt.cm.colors.ListedColormap(color_data)

# Generate some sample data
data = np.random.rand(10, 10)

# Create a heatmap using the custom colormap
plt.figure(figsize=(10, 8))
plt.imshow(data, cmap=custom_cmap)
plt.colorbar(label='Value')
plt.title('Heatmap with Custom Colormap - how2matplotlib.com')
plt.xlabel('X-axis')
plt.ylabel('Y-axis')
plt.show()
Output:

This example shows how to create a heatmap using a custom colormap derived from a table of color data.
Contour Plots with Custom Colormaps
import matplotlib.pyplot as plt
import numpy as np

# Create a table of color data
color_data = [
    [1.0, 1.0, 0.0],  # Yellow
    [0.0, 1.0, 0.0],  # Green
    [0.0, 0.0, 1.0]   # Blue
]

# Create a custom colormap from the table
custom_cmap = plt.cm.colors.ListedColormap(color_data)

# Generate some sample data
x = np.linspace(-3, 3, 100)
y = np.linspace(-3, 3, 100)
X, Y = np.meshgrid(x, y)
Z = np.sin(X) * np.cos(Y)

# Create a contour plot using the custom colormap
plt.figure(figsize=(10, 8))
plt.contourf(X, Y, Z, cmap=custom_cmap, levels=20)
plt.colorbar(label='Value')
plt.title('Contour Plot with Custom Colormap - how2matplotlib.com')
plt.xlabel('X-axis')
plt.ylabel('Y-axis')
plt.show()
Output:
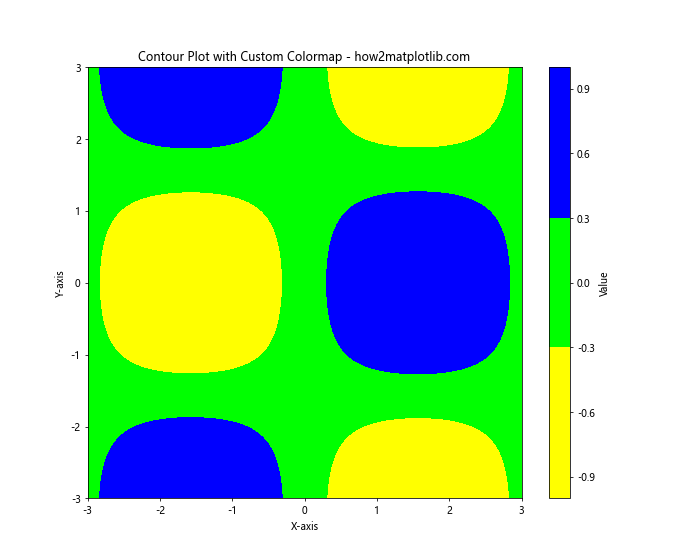
This example demonstrates how to apply a custom colormap to a contour plot.
Creating Discrete Colormaps from Table
Sometimes, you may want to create discrete colormaps rather than continuous ones. Let’s look at how to create and use discrete colormaps from table data:
import matplotlib.pyplot as plt
import numpy as np
from matplotlib.colors import BoundaryNorm

# Create a table of color data
color_data = [
    [1.0, 0.0, 0.0],  # Red
    [1.0, 1.0, 0.0],  # Yellow
    [0.0, 1.0, 0.0],  # Green
    [0.0, 0.0, 1.0]   # Blue
]

# Create a custom discrete colormap from the table
custom_cmap = plt.cm.colors.ListedColormap(color_data)

# Define boundaries for the discrete colormap
bounds = [0, 0.25, 0.5, 0.75, 1]
norm = BoundaryNorm(bounds, custom_cmap.N)

# Generate some sample data
x = np.linspace(0, 10, 100)
y = np.linspace(0, 10, 100)
X, Y = np.meshgrid(x, y)
Z = np.sin(X) * np.cos(Y)

# Create a plot using the custom discrete colormap
plt.figure(figsize=(10, 8))
plt.pcolormesh(X, Y, Z, cmap=custom_cmap, norm=norm)
plt.colorbar(label='Value', ticks=bounds)
plt.title('Discrete Colormap from Table - how2matplotlib.com')
plt.xlabel('X-axis')
plt.ylabel('Y-axis')
plt.show()
Output:
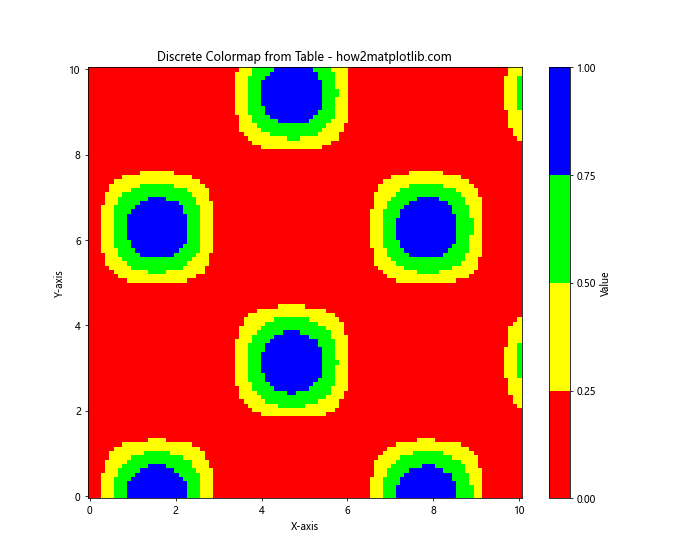
This example shows how to create a discrete colormap from a table of color data and apply it to a 2D plot.
Combining Multiple Colormaps from Table
Sometimes, you may want to combine multiple colormaps created from tables. Let’s look at how to do this:
import matplotlib.pyplot as plt
import numpy as np
from matplotlib.colors import LinearSegmentedColormap

# Create two tables of color data
color_data1 = [
    [1.0, 0.0, 0.0],  # Red
    [1.0, 1.0, 0.0],  # Yellow
]

color_data2 = [
    [0.0, 1.0, 0.0],  # Green
    [0.0, 0.0, 1.0]   # Blue
]

# Create custom colormaps from the tables
cmap1 = LinearSegmentedColormap.from_list("custom1", color_data1)
cmap2 = LinearSegmentedColormap.from_list("custom2", color_data2)

# Combine the colormaps
combined_cmap = LinearSegmentedColormap.from_list("combined",
                                                  np.vstack((cmap1(np.linspace(0, 1, 128)),
                                                             cmap2(np.linspace(0, 1, 128)))))

# Generate some sample data
x = np.linspace(0, 10, 100)
y = np.linspace(0, 10, 100)
X, Y = np.meshgrid(x, y)
Z = np.sin(X) * np.cos(Y)

# Create a plot using the combined colormap
plt.figure(figsize=(10, 8))
plt.pcolormesh(X, Y, Z, cmap=combined_cmap)
plt.colorbar(label='Value')
plt.title('Combined Colormaps from Tables - how2matplotlib.com')
plt.xlabel('X-axis')
plt.ylabel('Y-axis')
plt.show()
Output:
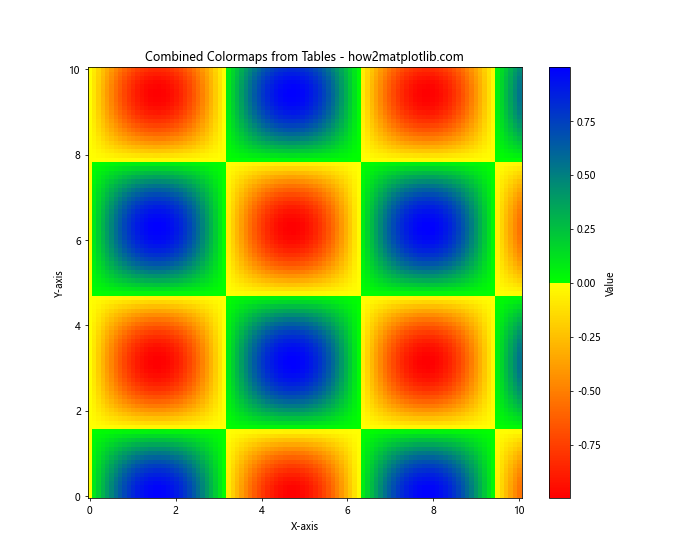
This example demonstrates how to create two separate colormaps from tables and then combine them into a single colormap.
Creating Diverging Colormaps from Table
Diverging colormaps are useful for highlighting deviations from a central value. Let’s create a diverging colormap from table data:
import matplotlib.pyplot as plt
import numpy as np
from matplotlib.colors import LinearSegmentedColormap

# Create a table of color data for a diverging colormap
color_data = [
    [0.0, 0.0, 1.0],  # Blue
    [1.0, 1.0, 1.0],  # White
    [1.0, 0.0, 0.0]   # Red
]

# Create a custom diverging colormap from the table
custom_cmap = LinearSegmentedColormap.from_list("custom_diverging", color_data)

# Generate some sample data
x = np.linspace(-5, 5, 100)
y = np.linspace(-5, 5, 100)
X, Y = np.meshgrid(x, y)
Z = X * Y

# Create a plot using the custom diverging colormap
plt.figure(figsize=(10, 8))
plt.pcolormesh(X, Y, Z, cmap=custom_cmap, shading='auto')
plt.colorbar(label='Value')
plt.title('Diverging Colormap from Table - how2matplotlib.com')
plt.xlabel('X-axis')
plt.ylabel('Y-axis')
plt.show()
Output:
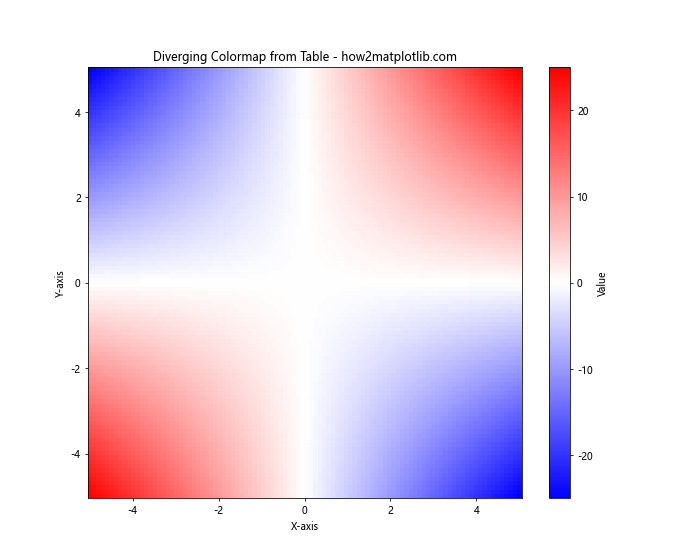
This example shows how to create a diverging colormap from a table of color data and apply it to a 2D plot.
Customizing Colorbar for Matplotlib Colormaps from Table
When using matplotlib colormaps from table, you may want to customize the colorbar to better represent your data. Let’s look at how to do this:
import matplotlib.pyplot as plt
import numpy as np
from matplotlib.colors import LinearSegmentedColormap

# Create a table of color data
color_data = [
    [1.0, 0.0, 0.0],  # Red
    [1.0, 1.0, 0.0],  # Yellow
    [0.0, 1.0, 0.0],  # Green
    [0.0, 0.0, 1.0]   # Blue
]

# Create a custom colormap from the table
custom_cmap = LinearSegmentedColormap.from_list("custom", color_data)

# Generate some sample data
x = np.linspace(0, 10, 100)
y = np.linspace(0, 10, 100)
X, Y = np.meshgrid(x, y)
Z = np.sin(X) * np.cos(Y)

# Create a plot using the custom colormap
fig, ax = plt.subplots(figsize=(10, 8))
im = ax.pcolormesh(X, Y, Z, cmap=custom_cmap)

# Customize the colorbar
cbar = fig.colorbar(im, ax=ax, label='Value', extend='both')
cbar.set_ticks([-1, -0.5, 0, 0.5, 1])
cbar.set_ticklabels(['Very Low', 'Low', 'Medium', 'High', 'Very High'])

plt.title('Custom Colorbar with Matplotlib Colormap from Table - how2matplotlib.com')
plt.xlabel('X-axis')
plt.ylabel('Y-axis')
plt.show()
Output:
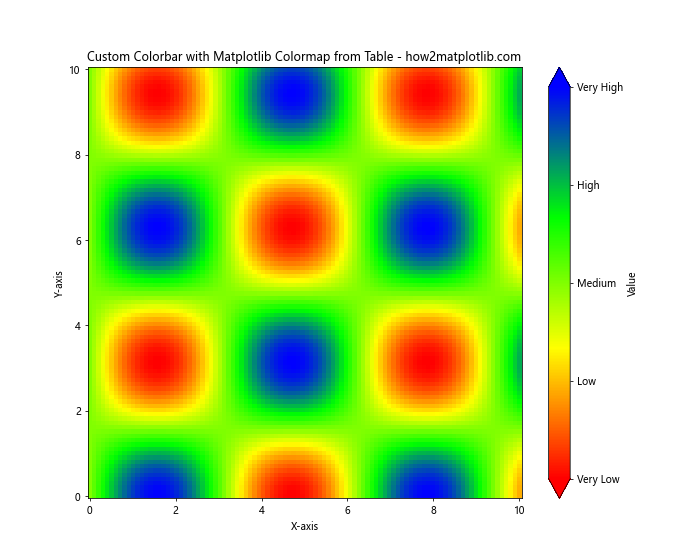
This example demonstrates how to create a custom colormap from a table and then customize the colorbar with specific ticks and labels.
Applying Matplotlib Colormaps from Table to 3D Plots
Matplotlib colormaps from table can also be applied to 3D plots. Let’s see how to do this:
import matplotlib.pyplot as plt
import numpy as np
from mpl_toolkits.mplot3d import Axes3D
from matplotlib.colors import LinearSegmentedColormap

# Create a table of color data
color_data = [
    [1.0, 0.0, 0.0],  # Red
    [1.0, 1.0, 0.0],  # Yellow
    [0.0, 1.0, 0.0],  # Green
    [0.0, 0.0, 1.0]   # Blue
]

# Create a custom colormap from the table
custom_cmap = LinearSegmentedColormap.from_list("custom", color_data)

# Generate some sample data
x = np.linspace(-5, 5, 50)
y = np.linspace(-5, 5, 50)
X, Y = np.meshgrid(x, y)
Z = np.sin(np.sqrt(X**2 + Y**2))

# Create a 3D plot using the custom colormap
fig = plt.figure(figsize=(12, 8))
ax = fig.add_subplot(111, projection='3d')
surf = ax.plot_surface(X, Y, Z, cmap=custom_cmap, linewidth=0, antialiased=False)

# Add a color bar
fig.colorbar(surf, shrink=0.5, aspect=5, label='Value')

plt.title('3D Plot with Matplotlib Colormap from Table - how2matplotlib.com')
ax.set_xlabel('X-axis')
ax.set_ylabel('Y-axis')
ax.set_zlabel('Z-axis')
plt.show()
Output:
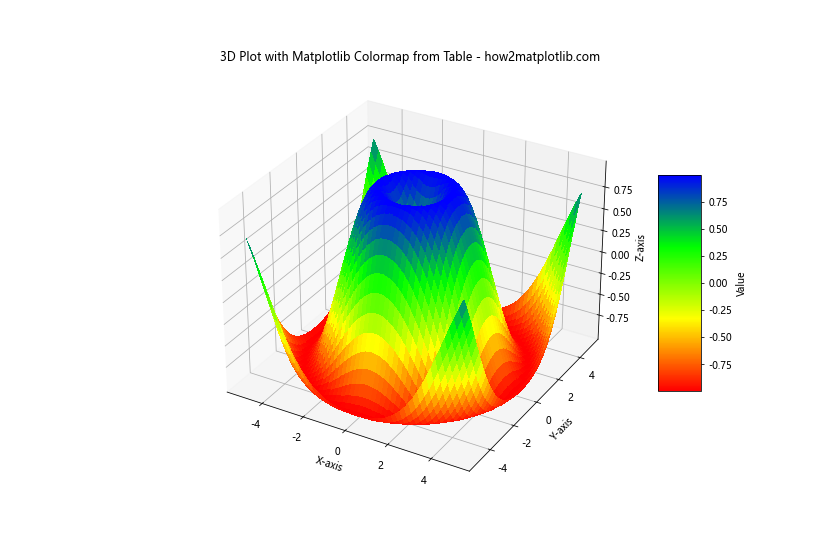
This example shows how to apply a custom colormap created from a table to a 3D surface plot.
Creating Animated Plots with Matplotlib Colormaps from Table
We can also use matplotlib colormaps from table to create animated plots. Here’s an example of how to do this:
import matplotlib.pyplot as plt
import numpy as np
from matplotlib.animation import FuncAnimation
from matplotlib.colors import LinearSegmentedColormap

# Create a table of color data
color_data = [
    [1.0, 0.0, 0.0],  # Red
    [1.0, 1.0, 0.0],  # Yellow
    [0.0, 1.0, 0.0],  # Green
    [0.0, 0.0, 1.0]   # Blue
]

# Create a custom colormap from the table
custom_cmap = LinearSegmentedColormap.from_list("custom", color_data)

# Set up the figure and axis
fig, ax = plt.subplots(figsize=(10, 8))

# Generate initial data
x = np.linspace(0, 2*np.pi, 100)
y = np.sin(x)
line, = ax.plot(x, y, color=custom_cmap(0))

# Animation update function
def update(frame):
    y = np.sin(x + frame/10)
    line.set_ydata(y)
    line.set_color(custom_cmap(frame/100))
    return line,

# Create the animation
anim = FuncAnimation(fig, update, frames=100, interval=50, blit=True)

plt.title('Animated Plot with Matplotlib Colormap from Table - how2matplotlib.com')
plt.xlabel('X-axis')
plt.ylabel('Y-axis')
plt.show()
Output:
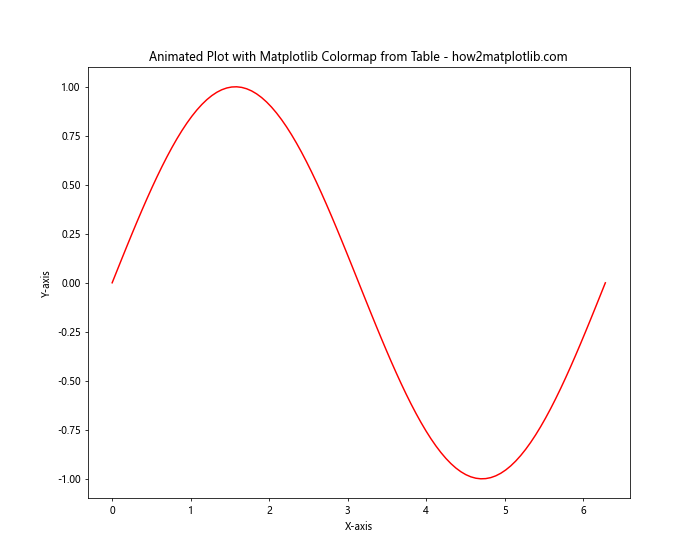
This example demonstrates how to create an animated plot where the color of the line changes according to a custom colormap created from a table.
Using Matplotlib Colormaps from Table with Seaborn
Seaborn is a popular data visualization library built on top of matplotlib. We can use our custom colormaps created from tables with seaborn as well. Here’s an example:
import matplotlib.pyplot as plt
import seaborn as sns
import numpy as np
from matplotlib.colors import LinearSegmentedColormap

# Create a table of color data
color_data = [
    [1.0, 0.0, 0.0],  # Red
    [1.0, 1.0, 0.0],  # Yellow
    [0.0, 1.0, 0.0],  # Green
    [0.0, 0.0, 1.0]   # Blue
]

# Create a custom colormap from the table
custom_cmap = LinearSegmentedColormap.from_list("custom", color_data)

# Generate some sample data
data = np.random.randn(10, 10)

# Create a heatmap using seaborn and the custom colormap
plt.figure(figsize=(10, 8))
sns.heatmap(data, cmap=custom_cmap, annot=True, fmt=".2f")

plt.title('Seaborn Heatmap with Matplotlib Colormap from Table - how2matplotlib.com')
plt.show()
Output:
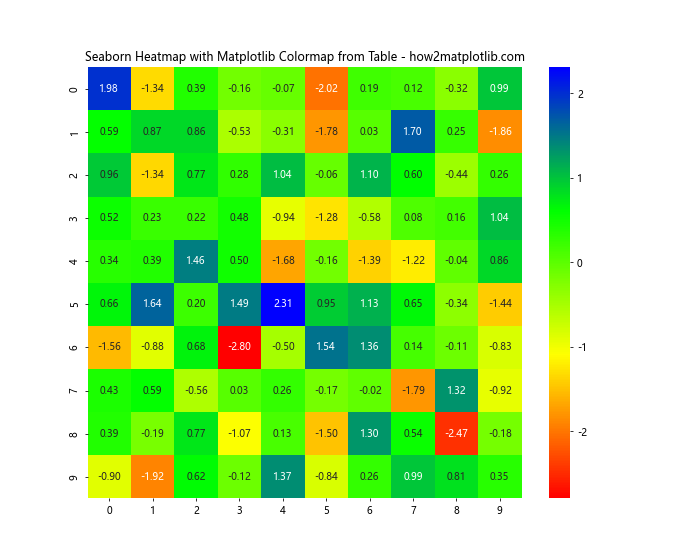
This example shows how to use a custom colormap created from a table with a seaborn heatmap.
Creating Colormap Transitions with Matplotlib Colormaps from Table
We can create smooth transitions between different colormaps created from tables. Here’s how to do it:
import matplotlib.pyplot as plt
import numpy as np
from matplotlib.colors import LinearSegmentedColormap

# Create two tables of color data
color_data1 = [
    [1.0, 0.0, 0.0],  # Red
    [1.0, 1.0, 0.0],  # Yellow
]

color_data2 = [
    [0.0, 1.0, 0.0],  # Green
    [0.0, 0.0, 1.0]   # Blue
]

# Create custom colormaps from the tables
cmap1 = LinearSegmentedColormap.from_list("custom1", color_data1)
cmap2 = LinearSegmentedColormap.from_list("custom2", color_data2)

# Create a function to generate colors for the transition
def transition_colormap(x, y, n=100):
    return LinearSegmentedColormap.from_list(
        "custom",
        list(zip(np.linspace(0, 1, n),
                 [cmap1(x * (1-t) + y * t) for t in np.linspace(0, 1, n)]))
    )

# Generate some sample data
x = np.linspace(0, 10, 100)
y = np.linspace(0, 10, 100)
X, Y = np.meshgrid(x, y)
Z = np.sin(X) * np.cos(Y)

# Create a plot using the transition colormap
plt.figure(figsize=(10, 8))
plt.pcolormesh(X, Y, Z, cmap=transition_colormap(0.3, 0.7))
plt.colorbar(label='Value')
plt.title('Colormap Transition from Table - how2matplotlib.com')
plt.xlabel('X-axis')
plt.ylabel('Y-axis')
plt.show()
Output:
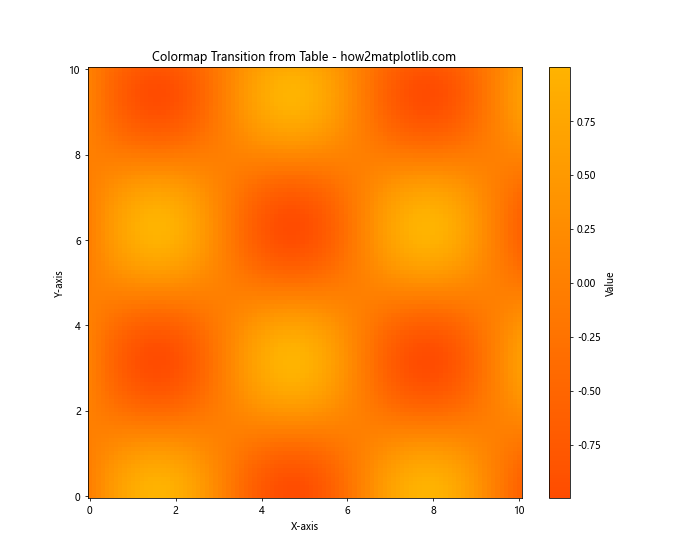
This example demonstrates how to create a smooth transition between two colormaps created from tables.
Matplotlib Colormaps from Table Conclusion
In this comprehensive guide, we’ve explored various aspects of working with matplotlib colormaps from table. We’ve covered how to create custom colormaps from tabular data, apply them to different types of plots, customize colorbars, create animated plots, and even use them with other libraries like seaborn.
Matplotlib colormaps from table offer a powerful way to customize your data visualizations. By creating your own colormaps, you can ensure that your plots accurately represent your data and effectively communicate your message. Whether you’re working with simple 2D plots, complex 3D visualizations, or animated graphics, custom colormaps can enhance the visual appeal and interpretability of your charts.
Remember that when working with matplotlib colormaps from table, it’s important to consider color theory and accessibility. Choose colors that work well together and are easily distinguishable, especially for viewers who may have color vision deficiencies.