How to Use Matplotlib Colormaps Gray: A Comprehensive Guide
Matplotlib colormaps gray is a powerful tool for visualizing data in grayscale. This article will explore the various aspects of using gray colormaps in Matplotlib, providing detailed explanations and practical examples to help you master this essential feature.
Understanding Matplotlib Colormaps Gray
Matplotlib colormaps gray refers to the grayscale color mapping options available in the Matplotlib library. These colormaps are particularly useful when you want to represent data using shades of gray, ranging from black to white. Gray colormaps can be especially effective for visualizing data where color might be distracting or unnecessary.
Types of Gray Colormaps in Matplotlib
Matplotlib offers several gray colormaps, each with its own characteristics:
- ‘gray’: A linear grayscale colormap
- ‘Greys’: Similar to ‘gray’, but with a slightly different distribution of shades
- ‘gist_gray’: A variant of the grayscale colormap with a different distribution of shades
- ‘gist_yarg’: The reverse of ‘gist_gray’
Let’s explore each of these colormaps with examples.
Example 1: Using the ‘gray’ Colormap
import matplotlib.pyplot as plt
import numpy as np

# Generate sample data
data = np.random.rand(10, 10)

# Create a figure and axis
fig, ax = plt.subplots()

# Plot the data using the 'gray' colormap
im = ax.imshow(data, cmap='gray')

# Add a colorbar
plt.colorbar(im)

# Set the title
plt.title("Matplotlib Colormaps Gray: 'gray' Example - how2matplotlib.com")

# Show the plot
plt.show()
Output:
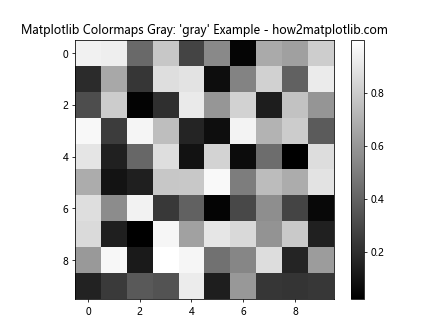
In this example, we create a 10×10 array of random data and visualize it using the ‘gray’ colormap. The imshow function is used to display the data, and we specify the colormap using the cmap parameter. A colorbar is added to show the mapping between data values and shades of gray.
Example 2: Using the ‘Greys’ Colormap
import matplotlib.pyplot as plt
import numpy as np

# Generate sample data
x = np.linspace(0, 10, 100)
y = np.sin(x)

# Create a figure and axis
fig, ax = plt.subplots()

# Plot the data using the 'Greys' colormap
scatter = ax.scatter(x, y, c=y, cmap='Greys', s=50)

# Add a colorbar
plt.colorbar(scatter)

# Set the title
plt.title("Matplotlib Colormaps Gray: 'Greys' Example - how2matplotlib.com")

# Show the plot
plt.show()
Output:
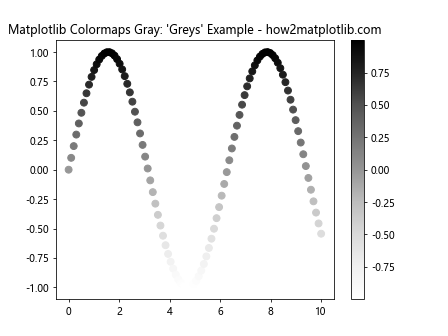
In this example, we create a scatter plot of a sine wave using the ‘Greys’ colormap. The scatter function is used to create the plot, and we map the y-values to the colormap using the c parameter. This results in a grayscale representation of the sine wave, with darker points corresponding to lower y-values and lighter points corresponding to higher y-values.
Example 3: Using the ‘gist_gray’ Colormap
import matplotlib.pyplot as plt
import numpy as np

# Generate sample data
x = np.linspace(-5, 5, 100)
y = np.linspace(-5, 5, 100)
X, Y = np.meshgrid(x, y)
Z = np.sin(np.sqrt(X**2 + Y**2))

# Create a figure and axis
fig, ax = plt.subplots()

# Plot the data using the 'gist_gray' colormap
contour = ax.contourf(X, Y, Z, cmap='gist_gray', levels=20)

# Add a colorbar
plt.colorbar(contour)

# Set the title
plt.title("Matplotlib Colormaps Gray: 'gist_gray' Example - how2matplotlib.com")

# Show the plot
plt.show()
Output:
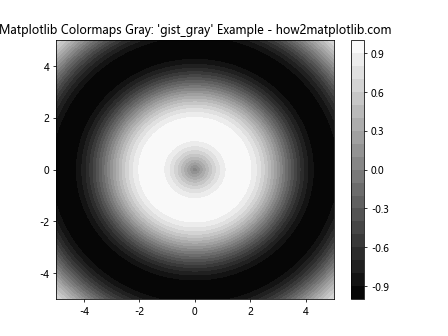
In this example, we create a contour plot of a 2D sinc function using the ‘gist_gray’ colormap. The contourf function is used to create filled contours, and we specify the colormap using the cmap parameter. This results in a grayscale representation of the function, with darker areas corresponding to lower values and lighter areas corresponding to higher values.
Example 4: Using the ‘gist_yarg’ Colormap
import matplotlib.pyplot as plt
import numpy as np

# Generate sample data
data = np.random.normal(0, 1, (50, 50))

# Create a figure and axis
fig, ax = plt.subplots()

# Plot the data using the 'gist_yarg' colormap
im = ax.imshow(data, cmap='gist_yarg')

# Add a colorbar
plt.colorbar(im)

# Set the title
plt.title("Matplotlib Colormaps Gray: 'gist_yarg' Example - how2matplotlib.com")

# Show the plot
plt.show()
Output:
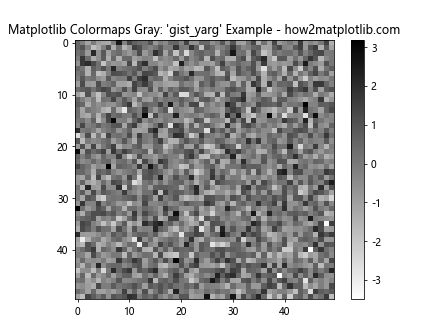
In this example, we create a 50×50 array of normally distributed random data and visualize it using the ‘gist_yarg’ colormap. The imshow function is used to display the data, and we specify the colormap using the cmap parameter. This results in a grayscale representation of the data, with the color mapping reversed compared to ‘gist_gray’.
Customizing Gray Colormaps in Matplotlib
While Matplotlib provides several built-in gray colormaps, you can also create custom gray colormaps to suit your specific needs. Let’s explore some ways to customize gray colormaps.
Creating a Custom Gray Colormap
You can create a custom gray colormap by defining a list of colors and using the LinearSegmentedColormap class from Matplotlib’s colors module.
Example 5: Creating a Custom Gray Colormap
import matplotlib.pyplot as plt
import matplotlib.colors as colors
import numpy as np

# Define custom colors for the colormap
colors_list = ['#000000', '#404040', '#808080', '#C0C0C0', '#FFFFFF']

# Create a custom colormap
custom_cmap = colors.LinearSegmentedColormap.from_list("custom_gray", colors_list)

# Generate sample data
data = np.random.rand(10, 10)

# Create a figure and axis
fig, ax = plt.subplots()

# Plot the data using the custom colormap
im = ax.imshow(data, cmap=custom_cmap)

# Add a colorbar
plt.colorbar(im)

# Set the title
plt.title("Matplotlib Colormaps Gray: Custom Gray Colormap - how2matplotlib.com")

# Show the plot
plt.show()
Output:
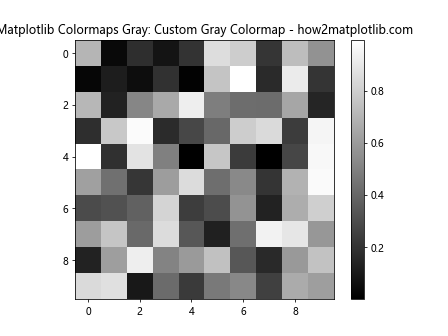
In this example, we define a list of gray colors using hexadecimal color codes. We then create a custom colormap using LinearSegmentedColormap.from_list(). The resulting colormap is used to visualize random data using imshow().
Reversing a Gray Colormap
You can easily reverse any gray colormap by appending ‘_r’ to the colormap name.
Example 6: Reversing a Gray Colormap
import matplotlib.pyplot as plt
import numpy as np

# Generate sample data
data = np.random.rand(10, 10)

# Create a figure with two subplots
fig, (ax1, ax2) = plt.subplots(1, 2, figsize=(10, 5))

# Plot the data using the 'gray' colormap
im1 = ax1.imshow(data, cmap='gray')
ax1.set_title("Original 'gray' Colormap")
plt.colorbar(im1, ax=ax1)

# Plot the data using the reversed 'gray' colormap
im2 = ax2.imshow(data, cmap='gray_r')
ax2.set_title("Reversed 'gray' Colormap")
plt.colorbar(im2, ax=ax2)

# Set the main title
fig.suptitle("Matplotlib Colormaps Gray: Reversing Colormaps - how2matplotlib.com")

# Show the plot
plt.tight_layout()
plt.show()
Output:
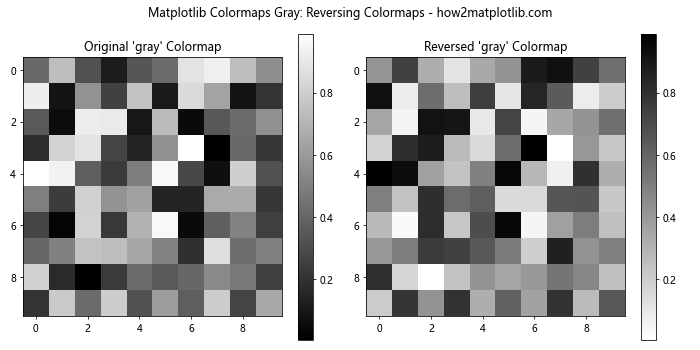
In this example, we create two subplots to compare the original ‘gray’ colormap with its reversed version ‘gray_r’. The same data is plotted in both subplots, but the color mapping is reversed in the second subplot.
Applying Gray Colormaps to Different Plot Types
Gray colormaps can be applied to various types of plots in Matplotlib. Let’s explore some common plot types and how to use gray colormaps with them.
Heatmaps with Gray Colormaps
Heatmaps are an excellent way to visualize 2D data, and gray colormaps can be particularly effective for this purpose.
Example 7: Creating a Heatmap with a Gray Colormap
import matplotlib.pyplot as plt
import numpy as np

# Generate sample data
data = np.random.rand(10, 10)

# Create a figure and axis
fig, ax = plt.subplots()

# Create a heatmap using the 'Greys' colormap
im = ax.imshow(data, cmap='Greys')

# Add a colorbar
plt.colorbar(im)

# Set the title
plt.title("Matplotlib Colormaps Gray: Heatmap Example - how2matplotlib.com")

# Show the plot
plt.show()
Output:
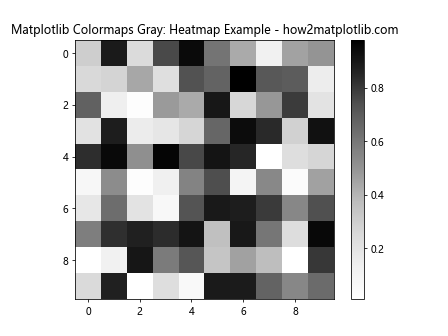
In this example, we create a heatmap using random data and the ‘Greys’ colormap. The imshow() function is used to create the heatmap, and we add a colorbar to show the mapping between data values and shades of gray.
Surface Plots with Gray Colormaps
Surface plots can benefit from gray colormaps when you want to emphasize the shape and structure of the surface without the distraction of color.
Example 8: Creating a Surface Plot with a Gray Colormap
import matplotlib.pyplot as plt
import numpy as np

# Generate sample data
x = np.linspace(-5, 5, 100)
y = np.linspace(-5, 5, 100)
X, Y = np.meshgrid(x, y)
Z = np.sin(np.sqrt(X**2 + Y**2))

# Create a figure and 3D axis
fig = plt.figure()
ax = fig.add_subplot(111, projection='3d')

# Create a surface plot using the 'gist_gray' colormap
surf = ax.plot_surface(X, Y, Z, cmap='gist_gray')

# Add a colorbar
plt.colorbar(surf)

# Set the title
plt.title("Matplotlib Colormaps Gray: Surface Plot Example - how2matplotlib.com")

# Show the plot
plt.show()
Output:
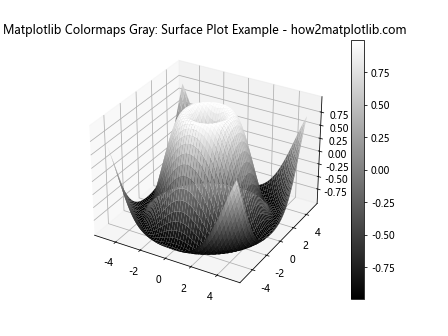
In this example, we create a 3D surface plot of a 2D sinc function using the ‘gist_gray’ colormap. The plot_surface() function is used to create the surface plot, and we add a colorbar to show the mapping between z-values and shades of gray.
Contour Plots with Gray Colormaps
Contour plots can be particularly effective when using gray colormaps, as they allow you to focus on the shape and structure of the data without the distraction of color.
Example 9: Creating a Contour Plot with a Gray Colormap
import matplotlib.pyplot as plt
import numpy as np

# Generate sample data
x = np.linspace(-3, 3, 100)
y = np.linspace(-3, 3, 100)
X, Y = np.meshgrid(x, y)
Z = np.exp(-(X**2 + Y**2))

# Create a figure and axis
fig, ax = plt.subplots()

# Create a contour plot using the 'gray' colormap
contour = ax.contourf(X, Y, Z, levels=20, cmap='gray')

# Add a colorbar
plt.colorbar(contour)

# Set the title
plt.title("Matplotlib Colormaps Gray: Contour Plot Example - how2matplotlib.com")

# Show the plot
plt.show()
Output:
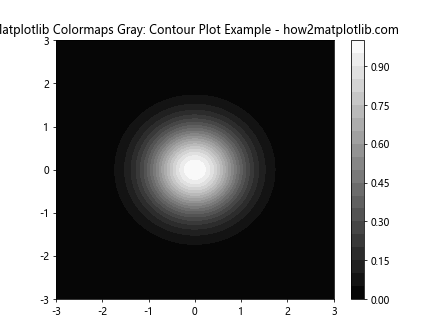
In this example, we create a contour plot of a 2D Gaussian function using the ‘gray’ colormap. The contourf() function is used to create filled contours, and we add a colorbar to show the mapping between z-values and shades of gray.
Advanced Techniques with Matplotlib Colormaps Gray
Now that we’ve covered the basics of using gray colormaps in Matplotlib, let’s explore some more advanced techniques and applications.
Combining Multiple Gray Colormaps
You can create interesting visualizations by combining multiple gray colormaps in a single plot.
Example 10: Combining Multiple Gray Colormaps
import matplotlib.pyplot as plt
import numpy as np

# Generate sample data
x = np.linspace(0, 10, 100)
y1 = np.sin(x)
y2 = np.cos(x)

# Create a figure and axis
fig, ax = plt.subplots()

# Plot the first dataset using the 'gray' colormap
scatter1 = ax.scatter(x, y1, c=y1, cmap='gray', s=50, label='Sin')

# Plot the second dataset using the 'Greys' colormap
scatter2 = ax.scatter(x, y2, c=y2, cmap='Greys', s=50, label='Cos')

# Add colorbars
plt.colorbar(scatter1, label='Sin Values')
plt.colorbar(scatter2, label='Cos Values')

# Set the title and legend
plt.title("Matplotlib Colormaps Gray: Combining Colormaps - how2matplotlib.com")
plt.legend()

# Show the plot
plt.show()
Output:
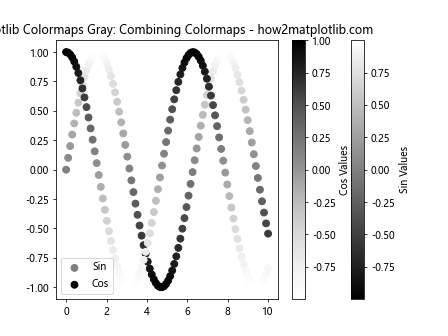
In this example, we create a scatter plot of sine and cosine functions, using different gray colormaps for each dataset. This allows us to distinguish between the two datasets while still maintaining a grayscale aesthetic.
Using Gray Colormaps with Image Processing
Gray colormaps are particularly useful when working with image processing tasks. Let’s explore an example of applying a gray colormap to an image.
Example 11: Applying a Gray Colormap to an Image
import matplotlib.pyplot as plt
import numpy as np

# Generate a sample image
image = np.random.rand(100, 100)

# Create a figure with two subplots
fig, (ax1, ax2) = plt.subplots(1, 2, figsize=(10, 5))

# Display the original image
ax1.imshow(image, cmap='viridis')
ax1.set_title("Original Image")

# Apply a gray colormap to the image
ax2.imshow(image, cmap='gray')
ax2.set_title("Gray Colormap Applied")

# Set the main title
fig.suptitle("Matplotlib Colormaps Gray: Image Processing - how2matplotlib.com")

# Show the plot
plt.tight_layout()
plt.show()
Output:
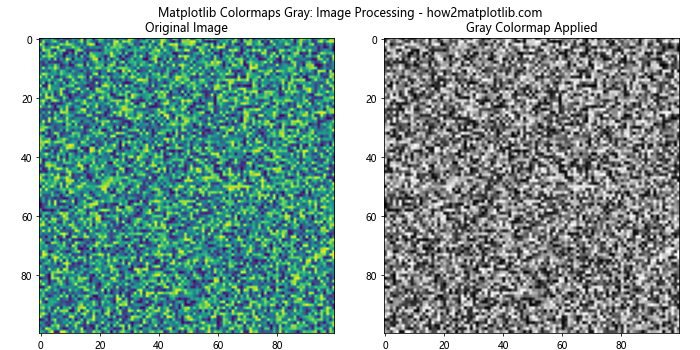
In this example, we generate a random image and display it using both a color colormap (‘viridis’) and a gray colormap (‘gray’). This demonstrates how applying a gray colormap can change the appearance of an image and potentially highlight different features.
Creating Custom Segmented Gray Colormaps
For more fine-grained control over your gray colormaps, you can create custom segmented colormaps.
Example 12: Creating a Custom Segmented Gray Colormap
import matplotlib.pyplot as plt
import matplotlib.colors as colors
import numpy as np

# Define custom colors and positions for the colormap
cmap_data = {'red':   ((0.0,  0.0, 0.0),
                       (0.25, 0.3, 0.3),
                       (0.5,  0.5, 0.5),
                       (0.75, 0.7, 0.7),
                       (1.0,  1.0, 1.0)),
             'green': ((0.0,  0.0, 0.0),
                       (0.25, 0.3, 0.3),
                       (0.5,  0.5, 0.5),

                       (0.75, 0.7, 0.7),
                       (1.0,  1.0, 1.0)),
             'blue':  ((0.0,  0.0, 0.0),
                       (0.25, 0.3, 0.3),
                       (0.5,  0.5, 0.5),
                       (0.75, 0.7, 0.7),
                       (1.0,  1.0, 1.0))}

# Create a custom segmented colormap
custom_cmap = colors.LinearSegmentedColormap('CustomGray', cmap_data)

# Generate sample data
data = np.random.rand(10, 10)

# Create a figure and axis
fig, ax = plt.subplots()

# Plot the data using the custom segmented colormap
im = ax.imshow(data, cmap=custom_cmap)

# Add a colorbar
plt.colorbar(im)

# Set the title
plt.title("Matplotlib Colormaps Gray: Custom Segmented Colormap - how2matplotlib.com")

# Show the plot
plt.show()
Output:
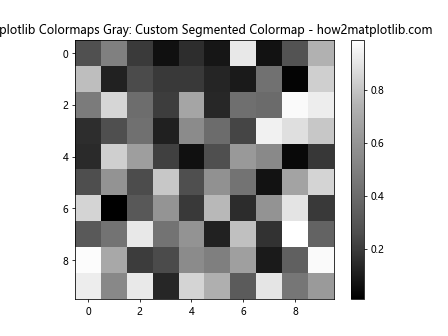
In this example, we create a custom segmented gray colormap by defining the red, green, and blue components at specific positions. This allows for more precise control over the shades of gray in the colormap.
Optimizing Gray Colormaps for Different Types of Data
Different types of data may benefit from different gray colormap configurations. Let’s explore how to optimize gray colormaps for various data types.
Optimizing for Continuous Data
When working with continuous data, it’s often beneficial to use a smooth, linear gray colormap.
Example 13: Optimizing Gray Colormap for Continuous Data
import matplotlib.pyplot as plt
import numpy as np

# Generate continuous sample data
x = np.linspace(0, 10, 100)
y = np.linspace(0, 10, 100)
X, Y = np.meshgrid(x, y)
Z = np.sin(X) * np.cos(Y)

# Create a figure and axis
fig, ax = plt.subplots()

# Plot the data using the 'gray' colormap
im = ax.imshow(Z, cmap='gray', extent=[0, 10, 0, 10], origin='lower', interpolation='nearest')

# Add a colorbar
plt.colorbar(im)

# Set the title
plt.title("Matplotlib Colormaps Gray: Optimized for Continuous Data - how2matplotlib.com")

# Show the plot
plt.show()
Output:
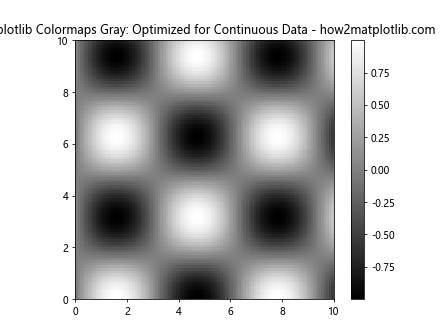
In this example, we use the ‘gray’ colormap to visualize continuous data. The smooth transition between shades of gray helps to represent the continuous nature of the data effectively.
Optimizing for Discrete Data
For discrete data, it can be helpful to use a gray colormap with distinct steps.
Example 14: Optimizing Gray Colormap for Discrete Data
import matplotlib.pyplot as plt
import numpy as np

# Generate discrete sample data
data = np.random.randint(0, 5, (10, 10))

# Create a custom discrete gray colormap
colors = ['#FFFFFF', '#BFBFBF', '#808080', '#404040', '#000000']
cmap = plt.cm.colors.ListedColormap(colors)

# Create a figure and axis
fig, ax = plt.subplots()

# Plot the data using the custom discrete gray colormap
im = ax.imshow(data, cmap=cmap)

# Add a colorbar
plt.colorbar(im, ticks=range(5))

# Set the title
plt.title("Matplotlib Colormaps Gray: Optimized for Discrete Data - how2matplotlib.com")

# Show the plot
plt.show()
Output:
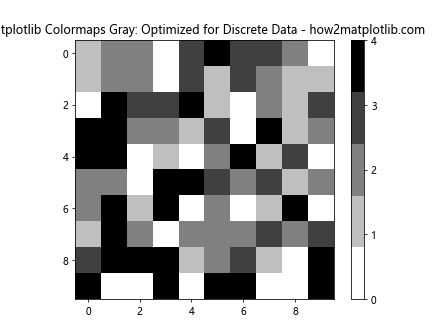
In this example, we create a custom discrete gray colormap with five distinct shades of gray. This is particularly useful for visualizing categorical or integer data.
Combining Gray Colormaps with Other Visualization Techniques
Gray colormaps can be combined with other visualization techniques to create more informative and visually appealing plots.
Using Gray Colormaps with Transparency
Adding transparency to your gray colormap can help highlight specific features or combine multiple layers of information.
Example 15: Gray Colormap with Transparency
import matplotlib.pyplot as plt
import numpy as np

# Generate sample data
x = np.linspace(0, 10, 100)
y = np.linspace(0, 10, 100)
X, Y = np.meshgrid(x, y)
Z1 = np.sin(X) * np.cos(Y)
Z2 = np.cos(X) * np.sin(Y)

# Create a figure and axis
fig, ax = plt.subplots()

# Plot the first dataset using the 'gray' colormap with transparency
im1 = ax.imshow(Z1, cmap='gray', alpha=0.5, extent=[0, 10, 0, 10], origin='lower')

# Plot the second dataset using a different colormap
im2 = ax.imshow(Z2, cmap='viridis', alpha=0.5, extent=[0, 10, 0, 10], origin='lower')

# Add colorbars
plt.colorbar(im1, label='Gray Data')
plt.colorbar(im2, label='Color Data')

# Set the title
plt.title("Matplotlib Colormaps Gray: Transparency Example - how2matplotlib.com")

# Show the plot
plt.show()
Output:
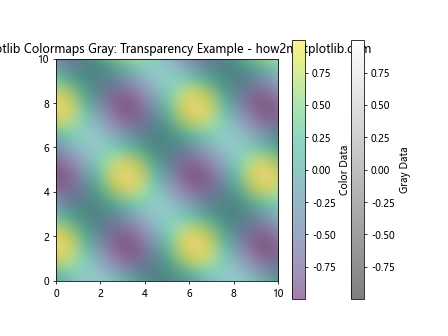
In this example, we overlay two datasets, one using a gray colormap with transparency and another using a color colormap. This allows us to visualize both datasets simultaneously while still maintaining the benefits of the gray colormap.
Combining Gray Colormaps with Contour Lines
Adding contour lines to a plot using a gray colormap can help emphasize the structure of the data.
Example 16: Gray Colormap with Contour Lines
import matplotlib.pyplot as plt
import numpy as np

# Generate sample data
x = np.linspace(-3, 3, 100)
y = np.linspace(-3, 3, 100)
X, Y = np.meshgrid(x, y)
Z = np.exp(-(X**2 + Y**2))

# Create a figure and axis
fig, ax = plt.subplots()

# Plot the data using the 'gray' colormap
im = ax.imshow(Z, extent=[-3, 3, -3, 3], origin='lower', cmap='gray')

# Add contour lines
contour = ax.contour(X, Y, Z, colors='black', linewidths=0.5)
ax.clabel(contour, inline=True, fontsize=8)

# Add a colorbar
plt.colorbar(im)

# Set the title
plt.title("Matplotlib Colormaps Gray: Contour Lines Example - how2matplotlib.com")

# Show the plot
plt.show()
Output:
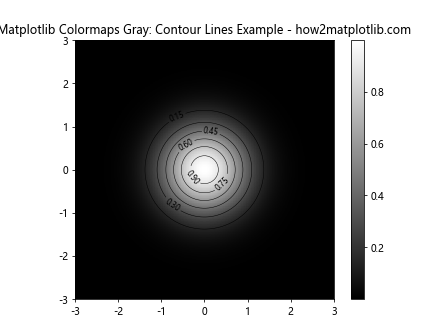
In this example, we combine a gray colormap with black contour lines to provide additional information about the structure of the data.
Best Practices for Using Matplotlib Colormaps Gray
When working with gray colormaps in Matplotlib, it’s important to follow some best practices to ensure your visualizations are effective and informative.
Choosing the Right Gray Colormap
Selecting the appropriate gray colormap depends on your data and the message you want to convey. Here are some guidelines:
- Use ‘gray’ or ‘Greys’ for general-purpose visualizations
- Use ‘gist_gray’ when you need more contrast in the middle range of values
- Use ‘gist_yarg’ when you want to emphasize higher values
Example 17: Comparing Different Gray Colormaps
import matplotlib.pyplot as plt
import numpy as np

# Generate sample data
data = np.random.rand(10, 10)

# Create a figure with four subplots
fig, ((ax1, ax2), (ax3, ax4)) = plt.subplots(2, 2, figsize=(12, 10))

# Plot the data using different gray colormaps
im1 = ax1.imshow(data, cmap='gray')
ax1.set_title("'gray' Colormap")
plt.colorbar(im1, ax=ax1)

im2 = ax2.imshow(data, cmap='Greys')
ax2.set_title("'Greys' Colormap")
plt.colorbar(im2, ax=ax2)

im3 = ax3.imshow(data, cmap='gist_gray')
ax3.set_title("'gist_gray' Colormap")
plt.colorbar(im3, ax=ax3)

im4 = ax4.imshow(data, cmap='gist_yarg')
ax4.set_title("'gist_yarg' Colormap")
plt.colorbar(im4, ax=ax4)

# Set the main title
fig.suptitle("Matplotlib Colormaps Gray: Comparing Different Gray Colormaps - how2matplotlib.com")

# Show the plot
plt.tight_layout()
plt.show()
Output:

This example compares four different gray colormaps side by side, allowing you to see the differences and choose the most appropriate one for your data.
Enhancing Readability with Labels and Annotations
When using gray colormaps, it’s crucial to provide clear labels and annotations to ensure your visualization is easily understood.
Example 18: Enhancing Gray Colormap Plots with Labels and Annotations
import matplotlib.pyplot as plt
import numpy as np

# Generate sample data
x = np.linspace(0, 10, 100)
y = np.sin(x)

# Create a figure and axis
fig, ax = plt.subplots()

# Create a scatter plot using the 'gray' colormap
scatter = ax.scatter(x, y, c=y, cmap='gray', s=50)

# Add a colorbar with a label
cbar = plt.colorbar(scatter)
cbar.set_label('Sin(x) Value', rotation=270, labelpad=15)

# Set axis labels
ax.set_xlabel('X-axis')
ax.set_ylabel('Y-axis')

# Add a title
ax.set_title("Matplotlib Colormaps Gray: Enhanced with Labels - how2matplotlib.com")

# Add annotations
ax.annotate('Peak', xy=(np.pi/2, 1), xytext=(np.pi/2 + 1, 1.2),
            arrowprops=dict(facecolor='black', shrink=0.05))

ax.annotate('Trough', xy=(3*np.pi/2, -1), xytext=(3*np.pi/2 + 1, -1.2),
            arrowprops=dict(facecolor='black', shrink=0.05))

# Show the plot
plt.show()
Output:
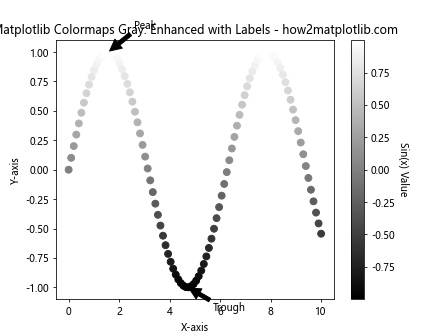
In this example, we enhance a scatter plot using a gray colormap by adding clear axis labels, a colorbar label, a title, and annotations to highlight important features of the data.
Troubleshooting Common Issues with Matplotlib Colormaps Gray
When working with gray colormaps in Matplotlib, you may encounter some common issues. Here are some problems and their solutions:
Issue 1: Colormap Not Visible
If your gray colormap is not visible, it may be due to the data range not matching the colormap range.
Example 19: Fixing Colormap Visibility Issues
import matplotlib.pyplot as plt
import numpy as np

# Generate sample data
data = np.random.rand(10, 10) * 0.1 + 0.9  # Data range: 0.9 to 1.0

# Create a figure with two subplots
fig, (ax1, ax2) = plt.subplots(1, 2, figsize=(12, 5))

# Plot with default settings
im1 = ax1.imshow(data, cmap='gray')
ax1.set_title("Default: Colormap Not Visible")
plt.colorbar(im1, ax=ax1)

# Plot with adjusted colormap range
im2 = ax2.imshow(data, cmap='gray', vmin=0.9, vmax=1.0)
ax2.set_title("Fixed: Colormap Visible")
plt.colorbar(im2, ax=ax2)

# Set the main title
fig.suptitle("Matplotlib Colormaps Gray: Fixing Visibility Issues - how2matplotlib.com")

# Show the plot
plt.tight_layout()
plt.show()
Output:
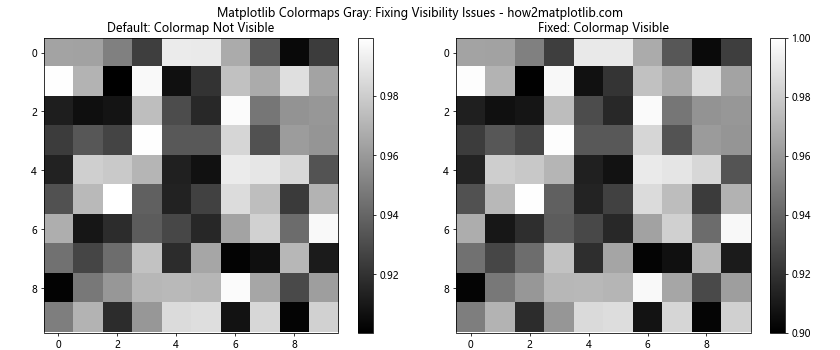
In this example, we demonstrate how to fix colormap visibility issues by adjusting the vmin and vmax parameters to match the data range.
Issue 2: Insufficient Contrast
Sometimes, a gray colormap may not provide enough contrast to distinguish different data values effectively.
Example 20: Improving Contrast in Gray Colormaps
import matplotlib.pyplot as plt
import numpy as np

# Generate sample data
data = np.random.normal(0, 1, (20, 20))

# Create a figure with two subplots
fig, (ax1, ax2) = plt.subplots(1, 2, figsize=(12, 5))

# Plot with default gray colormap
im1 = ax1.imshow(data, cmap='gray')
ax1.set_title("Default Gray Colormap")
plt.colorbar(im1, ax=ax1)

# Create a high-contrast custom gray colormap
high_contrast_gray = plt.cm.colors.LinearSegmentedColormap.from_list("high_contrast_gray", ["black", "white"])

# Plot with high-contrast gray colormap
im2 = ax2.imshow(data, cmap=high_contrast_gray)
ax2.set_title("High-Contrast Gray Colormap")
plt.colorbar(im2, ax=ax2)

# Set the main title
fig.suptitle("Matplotlib Colormaps Gray: Improving Contrast - how2matplotlib.com")

# Show the plot
plt.tight_layout()
plt.show()
Output:
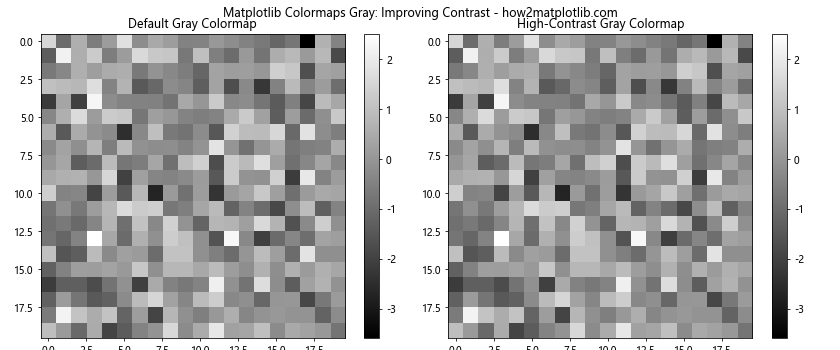
In this example, we create a custom high-contrast gray colormap to improve the visibility of different data values.
Matplotlib colormaps gray Conclusion
Matplotlib colormaps gray are powerful tools for creating effective and visually appealing grayscale visualizations. By understanding the different types of gray colormaps, learning how to customize them, and applying best practices, you can create informative and professional-looking plots that effectively communicate your data.
Throughout this article, we’ve explored various aspects of using gray colormaps in Matplotlib, including:
- Understanding different types of gray colormaps
- Customizing gray colormaps
- Applying gray colormaps to different plot types
- Advanced techniques and applications
- Optimizing gray colormaps for different data types
- Combining gray colormaps with other visualization techniques
- Best practices for using gray colormaps
- Troubleshooting common issues
By mastering these concepts and techniques, you’ll be well-equipped to create stunning grayscale visualizations using Matplotlib colormaps gray. Remember to experiment with different colormaps and customization options to find the best approach for your specific data and visualization needs.