Comprehensive Guide to Using Matplotlib.axis.Tick.get_clip_on() in Python

Comprehensive Guide to Using Matplotlib.axis.Tick.get_clip_on() in Python

Matplotlib.axis.Tick.get_clip_on() in Python is an essential method for controlling the visibility of tick marks in Matplotlib plots. This function is part of the Matplotlib library, which is widely used for creating static, animated, and interactive visualizations in Python. In this comprehensive guide, we’ll explore the Matplotlib.axis.Tick.get_clip_on() method in depth, covering its usage, applications, and providing numerous examples to help you master this powerful tool for data visualization.

Understanding Matplotlib.axis.Tick.get_clip_on() in Python

Matplotlib.axis.Tick.get_clip_on() in Python is a method that returns a boolean value indicating whether the tick and its label are set to be clipped. Clipping refers to the process of hiding or showing parts of a graphical element that fall outside a specified region. When it comes to tick marks, clipping determines whether they will be visible beyond the axes limits.

Let’s start with a simple example to demonstrate how to use Matplotlib.axis.Tick.get_clip_on() in Python:

import matplotlib.pyplot as plt

# Create a simple plot
fig, ax = plt.subplots()
ax.plot([1, 2, 3, 4], [1, 4, 2, 3], label='Data from how2matplotlib.com')

# Get the first x-axis tick
x_tick = ax.xaxis.get_major_ticks()[0]

# Check if the tick is set to be clipped
is_clipped = x_tick.get_clip_on()

print(f"Is the tick clipped? {is_clipped}")

plt.legend()
plt.title('Matplotlib.axis.Tick.get_clip_on() Example')
plt.show()

Output:
Comprehensive Guide to Using Matplotlib.axis.Tick.get_clip_on() in Python

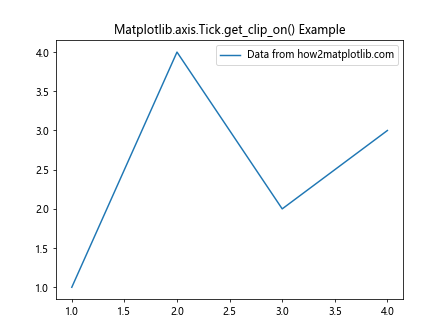
In this example, we create a simple line plot and then use Matplotlib.axis.Tick.get_clip_on() in Python to check if the first x-axis tick is set to be clipped. The method returns a boolean value, which we print to the console.

Exploring the Functionality of Matplotlib.axis.Tick.get_clip_on() in Python

Matplotlib.axis.Tick.get_clip_on() in Python is closely related to its counterpart, set_clip_on(). While set_clip_on() allows you to change the clipping behavior of a tick, get_clip_on() retrieves the current clipping state. This can be particularly useful when you need to check the current state before making any modifications or when you want to ensure consistency across different parts of your visualization.

Here’s an example that demonstrates how to use Matplotlib.axis.Tick.get_clip_on() in Python in conjunction with set_clip_on():

import matplotlib.pyplot as plt

# Create a simple plot
fig, ax = plt.subplots()
ax.plot([1, 2, 3, 4], [1, 4, 2, 3], label='Data from how2matplotlib.com')

# Get all x-axis ticks
x_ticks = ax.xaxis.get_major_ticks()

# Check and modify clipping for each tick
for i, tick in enumerate(x_ticks):
    current_clip = tick.get_clip_on()
    print(f"Tick {i}: Current clip state - {current_clip}")

    # Toggle the clip state
    tick.set_clip_on(not current_clip)

    new_clip = tick.get_clip_on()
    print(f"Tick {i}: New clip state - {new_clip}")

plt.legend()
plt.title('Matplotlib.axis.Tick.get_clip_on() and set_clip_on() Example')
plt.show()

Output:
Comprehensive Guide to Using Matplotlib.axis.Tick.get_clip_on() in Python

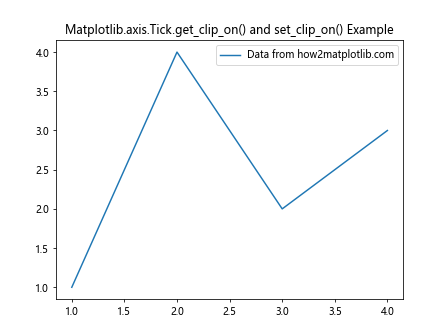
In this example, we iterate through all x-axis ticks, check their current clipping state using Matplotlib.axis.Tick.get_clip_on() in Python, toggle the state using set_clip_on(), and then verify the new state again with get_clip_on(). This demonstrates how these two methods work together to control tick visibility.

Practical Applications of Matplotlib.axis.Tick.get_clip_on() in Python

Matplotlib.axis.Tick.get_clip_on() in Python can be particularly useful in scenarios where you need to create custom tick behaviors or when you’re developing interactive visualizations that require dynamic tick management. Let’s explore some practical applications:

1. Selective Tick Clipping

In some cases, you might want to clip only certain ticks while leaving others visible. Matplotlib.axis.Tick.get_clip_on() in Python can help you achieve this:

import matplotlib.pyplot as plt
import numpy as np

# Create data
x = np.linspace(0, 10, 100)
y = np.sin(x)

# Create plot
fig, ax = plt.subplots()
ax.plot(x, y, label='Sine wave from how2matplotlib.com')

# Get x-axis ticks
x_ticks = ax.xaxis.get_major_ticks()

# Clip every other tick
for i, tick in enumerate(x_ticks):
    if i % 2 == 0:
        tick.set_clip_on(True)
    else:
        tick.set_clip_on(False)

# Verify clipping states
for i, tick in enumerate(x_ticks):
    print(f"Tick {i}: Clipped - {tick.get_clip_on()}")

plt.legend()
plt.title('Selective Tick Clipping with Matplotlib.axis.Tick.get_clip_on()')
plt.show()

Output:
Comprehensive Guide to Using Matplotlib.axis.Tick.get_clip_on() in Python

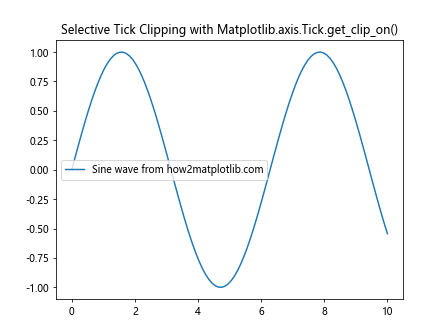
In this example, we use Matplotlib.axis.Tick.get_clip_on() in Python to verify the clipping states after selectively clipping every other tick on the x-axis.

Advanced Techniques with Matplotlib.axis.Tick.get_clip_on() in Python

As you become more comfortable with Matplotlib.axis.Tick.get_clip_on() in Python, you can start exploring more advanced techniques and combinations with other Matplotlib features. Let’s look at some advanced applications:

1. Custom Tick Formatter with Clipping

You can combine Matplotlib.axis.Tick.get_clip_on() in Python with custom tick formatters to create unique axis labels:

import matplotlib.pyplot as plt
import matplotlib.ticker as ticker

# Create a simple plot
fig, ax = plt.subplots()
ax.plot([1, 2, 3, 4], [1, 4, 2, 3], label='Data from how2matplotlib.com')

# Custom formatter function
def clip_aware_formatter(x, pos):
    tick = ax.xaxis.get_major_ticks()[pos]
    if tick.get_clip_on():
        return f"[{x:.1f}]"
    else:
        return f"{x:.1f}"

# Set the custom formatter
ax.xaxis.set_major_formatter(ticker.FuncFormatter(clip_aware_formatter))

# Set clipping for alternate ticks
for i, tick in enumerate(ax.xaxis.get_major_ticks()):
    tick.set_clip_on(i % 2 == 0)

plt.legend()
plt.title('Custom Tick Formatter with Matplotlib.axis.Tick.get_clip_on()')
plt.show()

Output:
Comprehensive Guide to Using Matplotlib.axis.Tick.get_clip_on() in Python

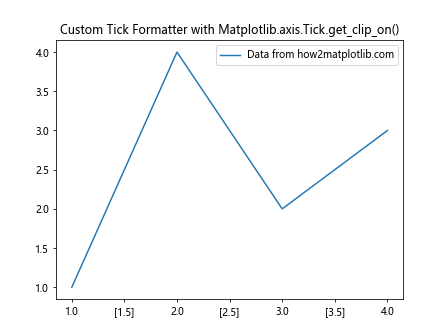
In this example, we create a custom tick formatter that uses Matplotlib.axis.Tick.get_clip_on() in Python to determine how to format each tick label. Clipped ticks are enclosed in square brackets.

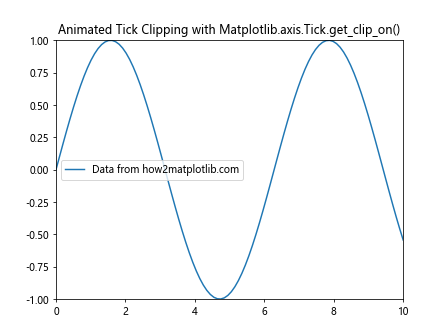
2. Animated Tick Clipping

Matplotlib.axis.Tick.get_clip_on() in Python can also be used in animations to create dynamic tick behaviors:

import matplotlib.pyplot as plt
import matplotlib.animation as animation
import numpy as np

# Create a simple plot
fig, ax = plt.subplots()
line, = ax.plot([], [], label='Data from how2matplotlib.com')
ax.set_xlim(0, 10)
ax.set_ylim(-1, 1)

# Animation function
def animate(frame):
    x = np.linspace(0, 10, 100)
    y = np.sin(x + frame/10)
    line.set_data(x, y)

    # Toggle tick clipping based on frame
    for tick in ax.xaxis.get_major_ticks():
        tick.set_clip_on(frame % 20 < 10)

    return line,

# Create animation
anim = animation.FuncAnimation(fig, animate, frames=200, interval=50, blit=True)

plt.legend()
plt.title('Animated Tick Clipping with Matplotlib.axis.Tick.get_clip_on()')
plt.show()

Output:
Comprehensive Guide to Using Matplotlib.axis.Tick.get_clip_on() in Python

This example creates an animated plot where the tick clipping toggles on and off periodically. Matplotlib.axis.Tick.get_clip_on() in Python could be used within the animation function to make more complex decisions about tick clipping.

Best Practices for Using Matplotlib.axis.Tick.get_clip_on() in Python

When working with Matplotlib.axis.Tick.get_clip_on() in Python, it’s important to keep some best practices in mind:

  1. Consistency: Ensure that your use of tick clipping is consistent throughout your visualization. Inconsistent clipping can lead to confusing or misleading plots.

  2. Performance: While Matplotlib.axis.Tick.get_clip_on() in Python is not typically a performance bottleneck, be mindful when using it in loops or animations with many ticks.

  3. Readability: Use tick clipping judiciously. The primary goal should be to enhance the readability and understanding of your plot.

  4. Documentation: When creating complex visualizations with custom tick behaviors, document your use of Matplotlib.axis.Tick.get_clip_on() in Python to help others (or your future self) understand the code.

Here’s an example that demonstrates these best practices:

import matplotlib.pyplot as plt
import numpy as np

def create_custom_plot(data, clip_threshold=0.5):
    """
    Create a custom plot with selective tick clipping.

    :param data: List of data points
    :param clip_threshold: Threshold for tick clipping (default: 0.5)
    """
    fig, ax = plt.subplots()
    ax.plot(data, label='Data from how2matplotlib.com')

    # Apply consistent clipping based on data values
    for i, tick in enumerate(ax.xaxis.get_major_ticks()):
        should_clip = data[i] > clip_threshold
        tick.set_clip_on(should_clip)

        # Document clipping in tick label
        if should_clip:
            tick.label1.set_text(f"{i}*")
        else:
            tick.label1.set_text(str(i))

    plt.legend()
    plt.title('Custom Plot with Matplotlib.axis.Tick.get_clip_on()')
    plt.show()

# Example usage
data = np.random.rand(10)
create_custom_plot(data)

This example demonstrates a custom plotting function that uses Matplotlib.axis.Tick.get_clip_on() in Python to selectively clip ticks based on data values. It maintains consistency, documents the clipping in the tick labels, and encapsulates the logic in a reusable function.

Troubleshooting Common Issues with Matplotlib.axis.Tick.get_clip_on() in Python

When working with Matplotlib.axis.Tick.get_clip_on() in Python, you might encounter some common issues. Let’s address a few of these and provide solutions:

1. Ticks Not Updating After Changing Clip State

Sometimes, you might find that the ticks don’t visually update after changing their clip state. This can often be resolved by calling plt.draw() or fig.canvas.draw():

import matplotlib.pyplot as plt

fig, ax = plt.subplots()
ax.plot([1, 2, 3, 4], [1, 4, 2, 3], label='Data from how2matplotlib.com')

# Change clip state
for tick in ax.xaxis.get_major_ticks():
    tick.set_clip_on(not tick.get_clip_on())

# Force redraw
fig.canvas.draw()

plt.legend()
plt.title('Updating Ticks with Matplotlib.axis.Tick.get_clip_on()')
plt.show()

Output:

Comprehensive Guide to Using Matplotlib.axis.Tick.get_clip_on() in Python

2. Inconsistent Behavior Across Matplotlib Versions

Matplotlib.axis.Tick.get_clip_on() in Python might behave differently across different versions of Matplotlib. It’s always a good practice to check your Matplotlib version and consult the documentation for any version-specific behaviors:

import matplotlib
import matplotlib.pyplot as plt

print(f"Matplotlib version: {matplotlib.__version__}")

fig, ax = plt.subplots()
ax.plot([1, 2, 3, 4], [1, 4, 2, 3], label='Data from how2matplotlib.com')

# Check clip state for all ticks
for i, tick in enumerate(ax.xaxis.get_major_ticks()):
    print(f"Tick {i} clip state: {tick.get_clip_on()}")

plt.legend()
plt.title('Checking Tick States with Matplotlib.axis.Tick.get_clip_on()')
plt.show()

Output:

Comprehensive Guide to Using Matplotlib.axis.Tick.get_clip_on() in Python

3. Clipping Affecting Tick Labels

Sometimes, clipping can unexpectedly affect tick labels. You can use Matplotlib.axis.Tick.get_clip_on() in Python to diagnose this issue:

import matplotlib.pyplot as plt

fig, ax = plt.subplots()
ax.plot([1, 2, 3, 4], [1, 4, 2, 3], label='Data from how2matplotlib.com')

# Extend axis limits
ax.set_xlim(0, 5)

# Check and adjust clipping for labels
for tick in ax.xaxis.get_major_ticks():
    if tick.get_clip_on():
        tick.label1.set_clip_on(False)

plt.legend()
plt.title('Adjusting Label Clipping with Matplotlib.axis.Tick.get_clip_on()')
plt.show()

Output:

Comprehensive Guide to Using Matplotlib.axis.Tick.get_clip_on() in Python

Integrating Matplotlib.axis.Tick.get_clip_on() with Other Matplotlib Features

Matplotlib.axis.Tick.get_clip_on() in Python can be effectively combined with other Matplotlib features to create more complex and informative visualizations. Let’s explore some of these integrations:

1. Combining with Custom Tick Locators

You can use Matplotlib.axis.Tick.get_clip_on() in Python along with custom tick locators to create unique axis behaviors:

import matplotlib.pyplot as plt
import matplotlib.ticker as ticker
import numpy as np

class CustomLocator(ticker.Locator):
    def __call__(self):
        return [1, 2, 3, 5, 8, 13]  # Fibonacci-like sequence

fig, ax = plt.subplots()
x = np.linspace(0, 15, 100)
ax.plot(x, np.sin(x), label='Sine wave from how2matplotlib.com')

# Set custom locator
ax.xaxis.set_major_locator(CustomLocator())

# Clip ticks based on their position
for tick in ax.xaxis.get_major_ticks():
    tick.set_clip_on(tick.get_loc() > 10)

plt.legend()
plt.title('Custom Locator with Matplotlib.axis.Tick.get_clip_on()')
plt.show()

Output:

Comprehensive Guide to Using Matplotlib.axis.Tick.get_clip_on() in Python

In this example, we create a custom tick locator and use Matplotlib.axis.Tick.get_clip_on() in Python to selectively clip ticks based on their position.

2. Integrating with Colorbar Ticks

Matplotlib.axis.Tick.get_clip_on() in Python can also be applied to colorbar ticks:

import matplotlib.pyplot as plt
import numpy as np

fig, ax = plt.subplots()
data = np.random.rand(10, 10)
im = ax.imshow(data, cmap='viridis')

cbar = plt.colorbar(im)

# Clip every other tick on the colorbar
for i, tick in enumerate(cbar.ax.yaxis.get_major_ticks()):
    tick.set_clip_on(i % 2 == 0)

# Verify clip states
for i, tick in enumerate(cbar.ax.yaxis.get_major_ticks()):
    print(f"Colorbar tick {i} clipped: {tick.get_clip_on()}")

plt.title('Colorbar with Matplotlib.axis.Tick.get_clip_on()')
plt.show()

Output:

Comprehensive Guide to Using Matplotlib.axis.Tick.get_clip_on() in Python

This example demonstrates how to apply Matplotlib.axis.Tick.get_clip_on() in Python to colorbar ticks, creating an alternating clipping pattern.

Advanced Customization with Matplotlib.axis.Tick.get_clip_on() in Python

As you become more proficient with Matplotlib.axis.Tick.get_clip_on() in Python, you can start exploring more advanced customization options. Let’s look at some advanced techniques:

1. Dynamic Tick Clipping Based on Data

You can use Matplotlib.axis.Tick.get_clip_on() in Python to dynamically clip ticks based on the underlying data:

import matplotlib.pyplot as plt
import numpy as np

fig, ax = plt.subplots()
x = np.linspace(0, 10, 100)
y = np.sin(x) * np.exp(-x/10)
ax.plot(x, y, label='Damped sine wave from how2matplotlib.com')

# Clip ticks where the function value is negative
for tick in ax.xaxis.get_major_ticks():
    tick_x = tick.get_loc()
    y_val = np.sin(tick_x) * np.exp(-tick_x/10)
    tick.set_clip_on(y_val < 0)

plt.legend()
plt.title('Dynamic Tick Clipping with Matplotlib.axis.Tick.get_clip_on()')
plt.show()

Output:

Comprehensive Guide to Using Matplotlib.axis.Tick.get_clip_on() in Python

This example clips ticks based on whether the corresponding y-value of the function is negative.

2. Custom Tick Artist with Clipping

You can create custom tick artists and use Matplotlib.axis.Tick.get_clip_on() in Python to control their visibility:

import matplotlib.pyplot as plt
import matplotlib.patches as patches

fig, ax = plt.subplots()
ax.plot([1, 2, 3, 4], [1, 4, 2, 3], label='Data from how2matplotlib.com')

# Create custom tick artists
for tick in ax.xaxis.get_major_ticks():
    x = tick.get_loc()
    rect = patches.Rectangle((x-0.1, -0.1), 0.2, 0.2, fill=False)
    ax.add_patch(rect)

    # Link rectangle visibility to tick clipping
    tick.set_clip_on(x > 2)
    rect.set_visible(not tick.get_clip_on())

plt.legend()
plt.title('Custom Tick Artists with Matplotlib.axis.Tick.get_clip_on()')
plt.show()

Output:

Comprehensive Guide to Using Matplotlib.axis.Tick.get_clip_on() in Python

This example creates custom rectangular tick marks and uses Matplotlib.axis.Tick.get_clip_on() in Python to control their visibility.

Conclusion: Mastering Matplotlib.axis.Tick.get_clip_on() in Python

Throughout this comprehensive guide, we’ve explored the various aspects and applications of Matplotlib.axis.Tick.get_clip_on() in Python. From basic usage to advanced techniques, we’ve seen how this method can be a powerful tool in creating customized and informative data visualizations.

Matplotlib.axis.Tick.get_clip_on() in Python allows you to query the clipping state of individual ticks, which can be crucial for creating consistent and visually appealing plots. We’ve learned how to use this method in conjunction with other Matplotlib features, such as custom formatters, locators, and even in interactive and animated plots.

Some key takeaways about Matplotlib.axis.Tick.get_clip_on() in Python include:

  1. It returns a boolean value indicating whether a tick is set to be clipped.
  2. It can be used in combination with set_clip_on() to create dynamic tick behaviors.
  3. It’s useful for creating custom tick formatters and locators.
  4. It can be applied to both axis ticks and colorbar ticks.
  5. It can be used in interactive and animated plots for dynamic tick management.
Like(0)