How to Master Matplotlib Scatter Plot Labels: A Comprehensive Guide
Matplotlib scatter label is an essential feature for creating informative and visually appealing scatter plots in data visualization. This comprehensive guide will explore various aspects of using matplotlib scatter labels, providing detailed explanations and practical examples to help you master this powerful tool.
Understanding Matplotlib Scatter Labels
Matplotlib scatter labels are text annotations that accompany individual data points in a scatter plot. These labels provide additional information about each point, making it easier for viewers to interpret the data. Scatter labels can display various types of information, such as category names, numerical values, or custom text.
To create a basic scatter plot with labels using matplotlib, you can use the scatter() function along with the annotate() function. Here’s a simple example:
import matplotlib.pyplot as plt

x = [1, 2, 3, 4, 5]
y = [2, 4, 6, 8, 10]
labels = ['A', 'B', 'C', 'D', 'E']

plt.figure(figsize=(8, 6))
scatter = plt.scatter(x, y)

for i, label in enumerate(labels):
    plt.annotate(label, (x[i], y[i]), xytext=(5, 5), textcoords='offset points')

plt.title('Matplotlib Scatter Label Example - how2matplotlib.com')
plt.xlabel('X-axis')
plt.ylabel('Y-axis')
plt.show()
Output:
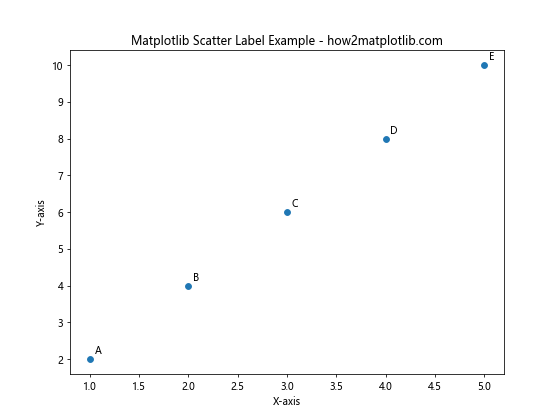
In this example, we create a scatter plot with five points and add labels to each point using the annotate() function. The xytext parameter specifies the offset of the label from the data point.
Customizing Matplotlib Scatter Labels
Matplotlib offers various options to customize scatter labels, allowing you to control their appearance and positioning. Let’s explore some of these customization techniques:
Adjusting Label Font Properties
You can modify the font properties of scatter labels to make them more visually appealing or to emphasize certain information. Here’s an example that demonstrates how to change the font size, color, and style:
import matplotlib.pyplot as plt

x = [1, 2, 3, 4, 5]
y = [2, 4, 6, 8, 10]
labels = ['A', 'B', 'C', 'D', 'E']

plt.figure(figsize=(8, 6))
scatter = plt.scatter(x, y)

for i, label in enumerate(labels):
    plt.annotate(label, (x[i], y[i]), xytext=(5, 5), textcoords='offset points',
                 fontsize=12, fontweight='bold', color='red', fontstyle='italic')

plt.title('Customized Matplotlib Scatter Labels - how2matplotlib.com')
plt.xlabel('X-axis')
plt.ylabel('Y-axis')
plt.show()
Output:
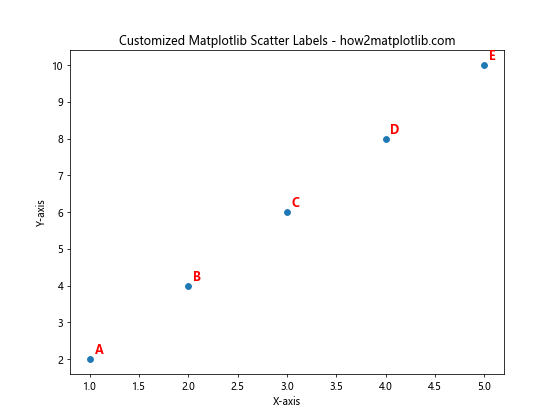
In this example, we’ve customized the font properties of the scatter labels by setting the fontsize, fontweight, color, and fontstyle parameters in the annotate() function.
Positioning Labels with Arrows
Sometimes, you may want to position labels away from the data points and connect them with arrows. This can be useful when dealing with crowded plots or when you want to emphasize certain points. Here’s an example:
import matplotlib.pyplot as plt

x = [1, 2, 3, 4, 5]
y = [2, 4, 6, 8, 10]
labels = ['Point A', 'Point B', 'Point C', 'Point D', 'Point E']

plt.figure(figsize=(10, 8))
scatter = plt.scatter(x, y)

for i, label in enumerate(labels):
    plt.annotate(label, (x[i], y[i]), xytext=(20, 20), textcoords='offset points',
                 arrowprops=dict(arrowstyle='->', connectionstyle='arc3,rad=0.2'))

plt.title('Matplotlib Scatter Labels with Arrows - how2matplotlib.com')
plt.xlabel('X-axis')
plt.ylabel('Y-axis')
plt.show()
Output:
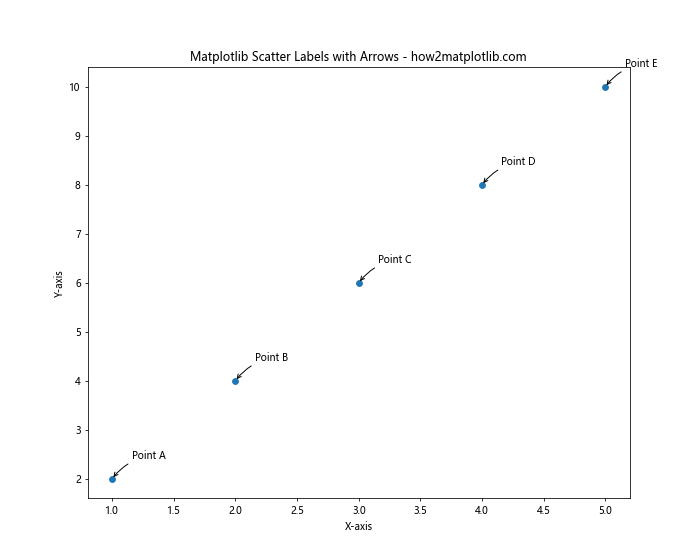
In this example, we’ve added arrows to connect the labels to their corresponding data points using the arrowprops parameter in the annotate() function.
Handling Overlapping Labels
When working with dense scatter plots, label overlap can become a significant issue. Matplotlib provides several techniques to address this problem and ensure that your labels remain readable.
Implementing a Custom Label Placement Algorithm
For more control over label placement, you can implement a custom algorithm to position labels. Here’s a simple example that attempts to place labels in non-overlapping positions:
import matplotlib.pyplot as plt
import numpy as np

def avoid_overlapping(x, y, labels, min_distance=0.1):
    positions = list(zip(x, y))
    placed_labels = []
    for i, (xi, yi) in enumerate(positions):
        label = labels[i]
        best_pos = (xi, yi)
        best_distance = 0
        for dx in np.linspace(-0.5, 0.5, 11):
            for dy in np.linspace(-0.5, 0.5, 11):
                new_pos = (xi + dx, yi + dy)
                distances = [np.sqrt((new_pos[0] - p[0])**2 + (new_pos[1] - p[1])**2) for p in placed_labels]
                min_dist = min(distances) if distances else float('inf')
                if min_dist > min_distance and min_dist > best_distance:
                    best_pos = new_pos
                    best_distance = min_dist
        placed_labels.append(best_pos)
        plt.annotate(label, best_pos, xytext=(5, 5), textcoords='offset points')

x = np.random.rand(20)
y = np.random.rand(20)
labels = [f'Point {i+1}' for i in range(20)]

plt.figure(figsize=(10, 8))
scatter = plt.scatter(x, y)

avoid_overlapping(x, y, labels)

plt.title('Custom Label Placement for Matplotlib Scatter - how2matplotlib.com')
plt.xlabel('X-axis')
plt.ylabel('Y-axis')
plt.show()
Output:
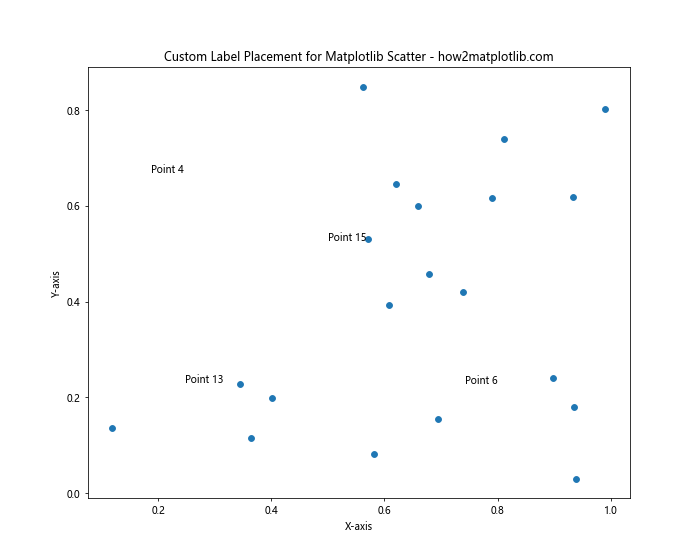
This example implements a simple algorithm that tries to place labels in positions that minimize overlap with other labels.
Adding Interactivity to Matplotlib Scatter Labels
Interactive scatter plots can enhance the user experience by allowing viewers to explore the data more dynamically. Matplotlib provides several ways to add interactivity to scatter plots and their labels.
Hover Labels with mplcursors
The mplcursors library offers an easy way to add hover labels to matplotlib scatter plots. Here’s an example:
import matplotlib.pyplot as plt
import mplcursors

x = [1, 2, 3, 4, 5]
y = [2, 4, 6, 8, 10]
labels = ['Point A', 'Point B', 'Point C', 'Point D', 'Point E']

plt.figure(figsize=(8, 6))
scatter = plt.scatter(x, y)

cursor = mplcursors.cursor(scatter, hover=True)
cursor.connect("add", lambda sel: sel.annotation.set_text(labels[sel.target.index]))

plt.title('Interactive Matplotlib Scatter Labels - how2matplotlib.com')
plt.xlabel('X-axis')
plt.ylabel('Y-axis')
plt.show()
Output:
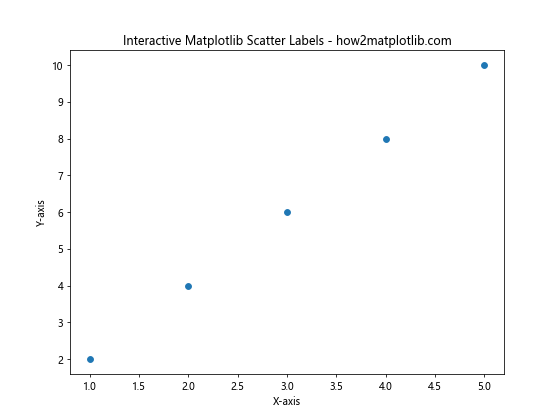
In this example, we use mplcursors to add hover labels to the scatter plot. When the user hovers over a point, the corresponding label is displayed.
Clickable Labels with Event Handling
You can also create clickable labels using matplotlib’s event handling capabilities. Here’s an example that displays additional information when a point is clicked:
import matplotlib.pyplot as plt

x = [1, 2, 3, 4, 5]
y = [2, 4, 6, 8, 10]
labels = ['Point A', 'Point B', 'Point C', 'Point D', 'Point E']
additional_info = ['Info A', 'Info B', 'Info C', 'Info D', 'Info E']

fig, ax = plt.subplots(figsize=(8, 6))
scatter = ax.scatter(x, y)

annotation = ax.annotate('', xy=(0, 0), xytext=(20, 20), textcoords='offset points',
                         bbox=dict(boxstyle='round', fc='white', ec='gray'),
                         arrowprops=dict(arrowstyle='->'))
annotation.set_visible(False)

def on_click(event):
    if event.inaxes == ax:
        cont, ind = scatter.contains(event)
        if cont:
            pos = scatter.get_offsets()[ind['ind'][0]]
            annotation.xy = pos
            text = f'{labels[ind["ind"][0]]}\n{additional_info[ind["ind"][0]]}'
            annotation.set_text(text)
            annotation.set_visible(True)
            fig.canvas.draw_idle()
        else:
            annotation.set_visible(False)
            fig.canvas.draw_idle()

fig.canvas.mpl_connect('button_press_event', on_click)

plt.title('Clickable Matplotlib Scatter Labels - how2matplotlib.com')
plt.xlabel('X-axis')
plt.ylabel('Y-axis')
plt.show()
Output:
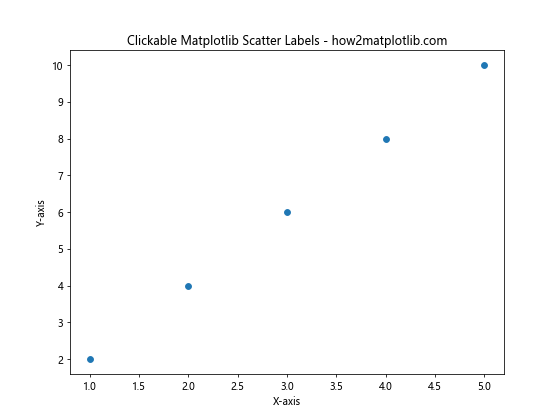
This example demonstrates how to create clickable scatter points that display additional information when clicked.
Advanced Techniques for Matplotlib Scatter Labels
As you become more proficient with matplotlib scatter labels, you may want to explore more advanced techniques to create even more informative and visually appealing plots.
Color-coded Labels
You can use color-coded labels to represent additional dimensions of your data. Here’s an example that colors labels based on a categorical variable:
import matplotlib.pyplot as plt
import numpy as np

np.random.seed(42)
x = np.random.rand(50)
y = np.random.rand(50)
categories = np.random.choice(['A', 'B', 'C'], 50)
colors = {'A': 'red', 'B': 'green', 'C': 'blue'}

plt.figure(figsize=(10, 8))
for category in colors:
    mask = categories == category
    plt.scatter(x[mask], y[mask], c=colors[category], label=category)

for i, (xi, yi, cat) in enumerate(zip(x, y, categories)):
    plt.annotate(f'Point {i+1}', (xi, yi), xytext=(5, 5), textcoords='offset points',
                 color=colors[cat], fontweight='bold')

plt.title('Color-coded Matplotlib Scatter Labels - how2matplotlib.com')
plt.xlabel('X-axis')
plt.ylabel('Y-axis')
plt.legend()
plt.show()
Output:
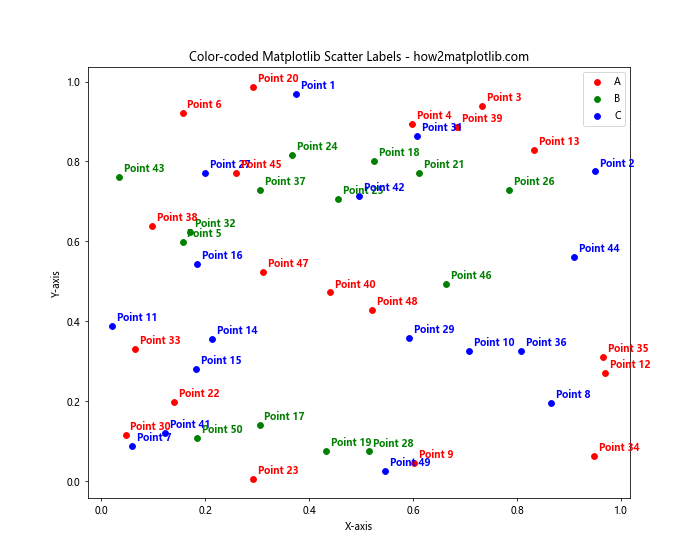
This example demonstrates how to color-code scatter points and their labels based on a categorical variable.
Size-based Labels
You can adjust the size of labels based on a numerical variable to emphasize certain data points. Here’s an example:
import matplotlib.pyplot as plt
import numpy as np

np.random.seed(42)
x = np.random.rand(30)
y = np.random.rand(30)
sizes = np.random.randint(10, 100, 30)

plt.figure(figsize=(10, 8))
scatter = plt.scatter(x, y, s=sizes)

for i, (xi, yi, size) in enumerate(zip(x, y, sizes)):
    plt.annotate(f'Point {i+1}', (xi, yi), xytext=(5, 5), textcoords='offset points',
                 fontsize=size/5, fontweight='bold')

plt.title('Size-based Matplotlib Scatter Labels - how2matplotlib.com')
plt.xlabel('X-axis')
plt.ylabel('Y-axis')
plt.show()
Output:
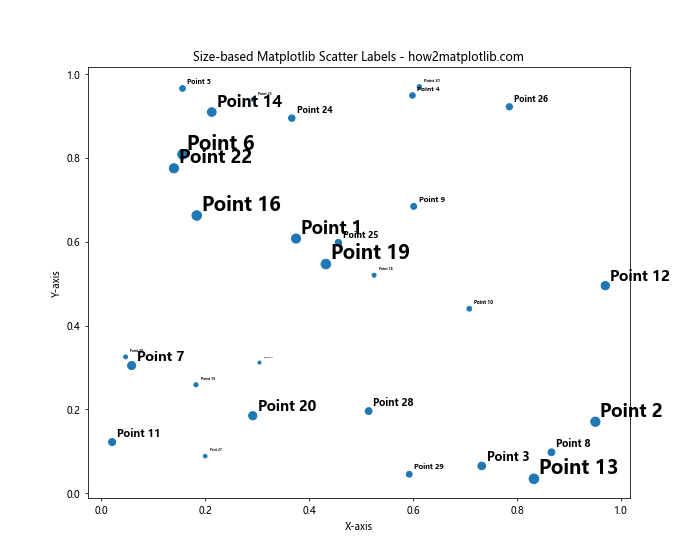
In this example, we adjust the font size of the labels based on the size of the corresponding scatter points.
Combining Matplotlib Scatter Labels with Other Plot Elements
Matplotlib scatter labels can be combined with other plot elements to create more informative and visually appealing visualizations.
Adding a Colorbar to Scatter Plots with Labels
You can add a colorbar to your scatter plot to represent an additional dimension of your data. Here’s an example that combines scatter labels with a colorbar:
import matplotlib.pyplot as plt
import numpy as np

np.random.seed(42)
x = np.random.rand(50)
y = np.random.rand(50)
colors = np.random.rand(50)

plt.figure(figsize=(10, 8))
scatter = plt.scatter(x, y, c=colors, cmap='viridis')

for i, (xi, yi) in enumerate(zip(x, y)):
    plt.annotate(f'Point {i+1}', (xi, yi), xytext=(5, 5), textcoords='offset points',
                 fontsize=8, alpha=0.7)

plt.colorbar(scatter, label='Color Value')
plt.title('Matplotlib Scatter Labels with Colorbar - how2matplotlib.com')
plt.xlabel('X-axis')
plt.ylabel('Y-axis')
plt.show()
Output:
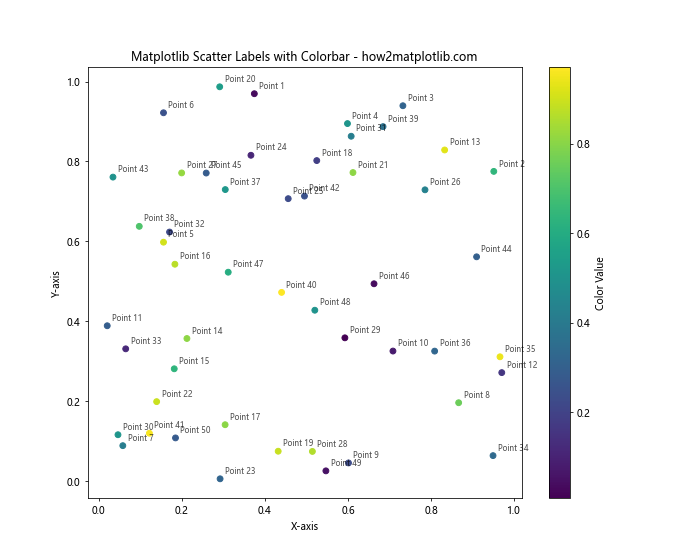
This example demonstrates how to add a colorbar to a scatter plot with labels, allowing you to represent three dimensions of data in a single plot.
Combining Scatter Labels with Trend Lines
You can enhance your scatter plot by adding trend lines or regression lines alongside the scatter labels. Here’s an example:
import matplotlib.pyplot as plt
import numpy as np
from scipy import stats

np.random.seed(42)
x = np.linspace(0, 10, 50)
y = 2 * x + 1 + np.random.normal(0, 2, 50)

plt.figure(figsize=(10, 8))
scatter = plt.scatter(x, y)

for i, (xi, yi) in enumerate(zip(x, y)):
    plt.annotate(f'Point {i+1}', (xi, yi), xytext=(5, 5), textcoords='offset points',
                 fontsize=8, alpha=0.7)

slope, intercept, r_value, p_value, std_err = stats.linregress(x, y)
line = slope * x + intercept
plt.plot(x, line, color='red', label=f'Trend Line (R² = {r_value**2:.2f})')

plt.title('Matplotlib Scatter Labels with Trend Line - how2matplotlib.com')
plt.xlabel('X-axis')
plt.ylabel('Y-axis')
plt.legend()plt.show()
Output:
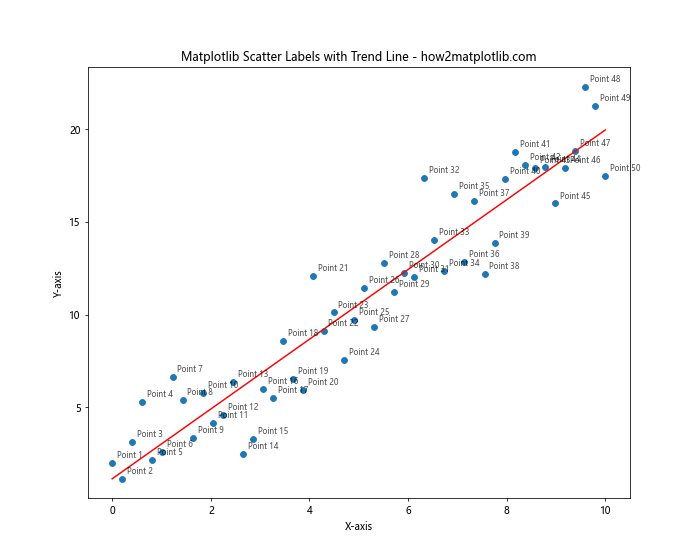
This example shows how to combine scatter labels with a trend line, providing additional context to your data visualization.
Best Practices for Using Matplotlib Scatter Labels
To create effective and informative scatter plots with labels, consider the following best practices:
- Use clear and concise labels: Keep your labels short and informative to avoid cluttering the plot.
- Choose appropriate font sizes: Ensure that your labels are readable but not overpowering.
- Use color strategically: Color-code your labels to convey additional information when appropriate.
- Avoid overlapping: Implement techniques to prevent label overlap, especially in dense plots.
- Consider interactivity: Add hover or click functionality for detailed information in complex plots.
- Balance information density: Don’t overcrowd your plot with too many labels or data points.
- Maintain consistency: Use a consistent labeling style throughout your visualization.
Troubleshooting Common Issues with Matplotlib Scatter Labels
When working with matplotlib scatter labels, you may encounter some common issues. Here are some problems and their solutions:
Labels Disappearing or Not Showing
If your labels are not appearing on the plot, check the following:
- Ensure that the label coordinates are within the plot limits.
- Check if the labels are being drawn outside the visible area of the plot.
- Verify that the label color is not the same as the background color.
Here’s an example that demonstrates how to address these issues:
import matplotlib.pyplot as plt
import numpy as np

np.random.seed(42)
x = np.random.rand(20)
y = np.random.rand(20)

plt.figure(figsize=(10, 8))
scatter = plt.scatter(x, y)

for i, (xi, yi) in enumerate(zip(x, y)):
    plt.annotate(f'Point {i+1}', (xi, yi), xytext=(5, 5), textcoords='offset points',
                 fontsize=8, color='black', bbox=dict(facecolor='white', edgecolor='none', alpha=0.7))

plt.title('Ensuring Visible Matplotlib Scatter Labels - how2matplotlib.com')
plt.xlabel('X-axis')
plt.ylabel('Y-axis')
plt.xlim(-0.1, 1.1)  # Extend plot limits to show all labels
plt.ylim(-0.1, 1.1)
plt.show()
Output:
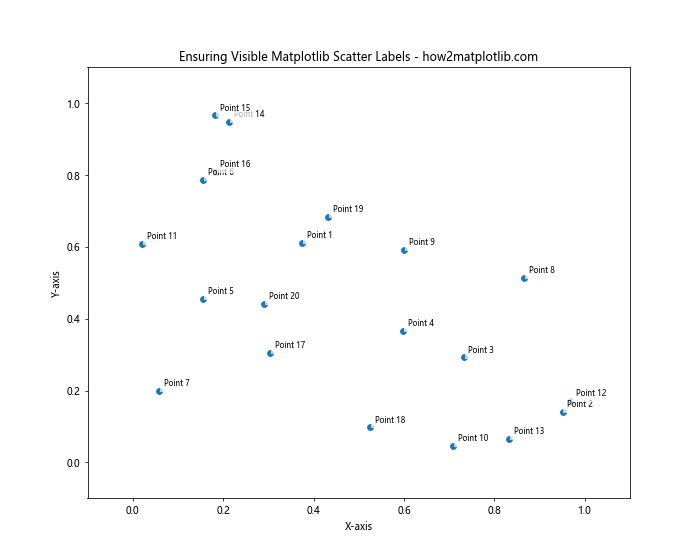
This example ensures that all labels are visible by adjusting the plot limits and adding a white background to each label.
Dealing with Performance Issues
When working with large datasets, adding labels to every point can significantly impact performance. Here are some strategies to improve performance:
- Label only a subset of points
- Use marker symbols instead of text labels for less important points
- Implement interactive labeling that only shows labels on hover or click
Here’s an example that demonstrates these techniques:
import matplotlib.pyplot as plt
import numpy as np

np.random.seed(42)
x = np.random.rand(1000)
y = np.random.rand(1000)

plt.figure(figsize=(10, 8))
scatter = plt.scatter(x, y, alpha=0.5)

# Label only every 100th point
for i in range(0, len(x), 100):
    plt.annotate(f'Point {i+1}', (x[i], y[i]), xytext=(5, 5), textcoords='offset points',
                 fontsize=8, alpha=0.7)

plt.title('Efficient Labeling for Large Datasets - how2matplotlib.com')
plt.xlabel('X-axis')
plt.ylabel('Y-axis')

# Add interactivity for unlabeled points
annot = plt.annotate("", xy=(0,0), xytext=(20,20), textcoords="offset points",
                     bbox=dict(boxstyle="round", fc="w"),
                     arrowprops=dict(arrowstyle="->"))
annot.set_visible(False)

def update_annot(ind):
    pos = scatter.get_offsets()[ind["ind"][0]]
    annot.xy = pos
    text = f"Point {ind['ind'][0]+1}"
    annot.set_text(text)

def hover(event):
    vis = annot.get_visible()
    if event.inaxes == plt.gca():
        cont, ind = scatter.contains(event)
        if cont:
            update_annot(ind)
            annot.set_visible(True)
            plt.gcf().canvas.draw_idle()
        else:
            if vis:
                annot.set_visible(False)
                plt.gcf().canvas.draw_idle()

plt.gcf().canvas.mpl_connect("motion_notify_event", hover)

plt.show()
Output:
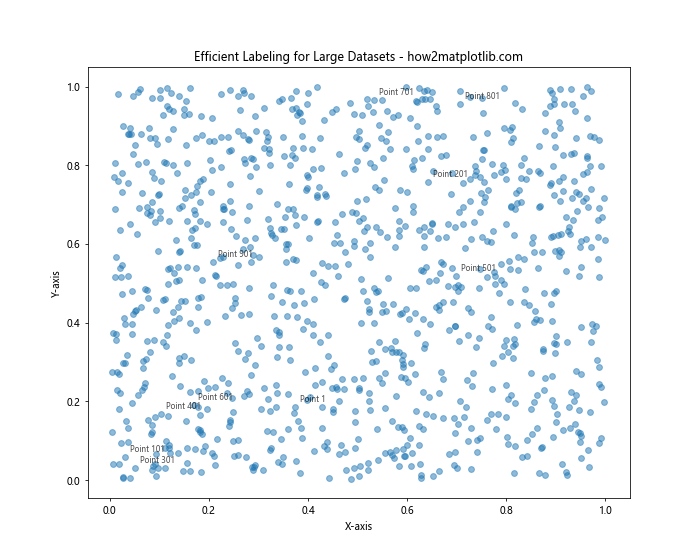
This example demonstrates how to efficiently label a large dataset by labeling only a subset of points and implementing interactive hover labels for the remaining points.
Advanced Customization of Matplotlib Scatter Labels
For even more control over your scatter labels, you can create custom label styles and layouts. Here are some advanced customization techniques:
Radial Label Layout
For circular or radial scatter plots, you may want to arrange labels in a radial layout. Here’s an example that demonstrates this technique:
import matplotlib.pyplot as plt
import numpy as np

def polar_to_cartesian(r, theta):
    return r * np.cos(theta), r * np.sin(theta)

np.random.seed(42)
r = np.random.uniform(0, 1, 20)
theta = np.random.uniform(0, 2*np.pi, 20)

x, y = polar_to_cartesian(r, theta)

plt.figure(figsize=(10, 10))
scatter = plt.scatter(x, y)

for i, (xi, yi, ri, ti) in enumerate(zip(x, y, r, theta)):
    label_r = ri + 0.1
    label_x, label_y = polar_to_cartesian(label_r, ti)
    plt.annotate(f'Point {i+1}', (label_x, label_y), xytext=(0, 0), textcoords='offset points',
                 fontsize=8, ha='center', va='center', rotation=np.degrees(ti))
    plt.plot([xi, label_x], [yi, label_y], 'k-', linewidth=0.5, alpha=0.3)

plt.title('Radial Label Layout for Matplotlib Scatter - how2matplotlib.com')
plt.xlim(-1.5, 1.5)
plt.ylim(-1.5, 1.5)
plt.gca().set_aspect('equal', adjustable='box')
plt.axis('off')
plt.show()
Output:
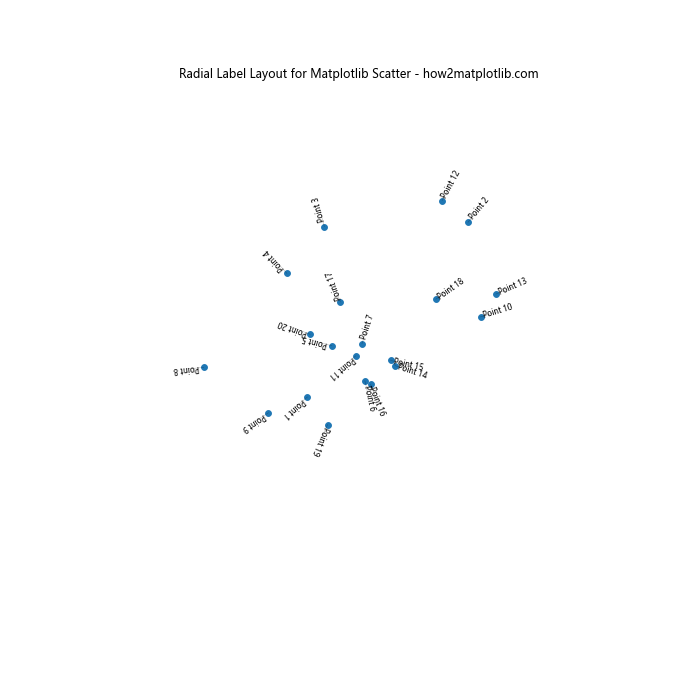
This example shows how to create a radial layout for scatter labels, which can be useful for circular or polar scatter plots.
Integrating Matplotlib Scatter Labels with Data Analysis
Matplotlib scatter labels can be powerful tools when integrated with data analysis techniques. Here are some examples of how to combine scatter labels with data analysis:
Clustering and Labeling
You can use clustering algorithms to group similar data points and then apply labels to the clusters. Here’s an example using K-means clustering:
import matplotlib.pyplot as plt
import numpy as np
from sklearn.cluster import KMeans

np.random.seed(42)
X = np.random.rand(100, 2)

kmeans = KMeans(n_clusters=3, random_state=42)
cluster_labels = kmeans.fit_predict(X)

plt.figure(figsize=(10, 8))
scatter = plt.scatter(X[:, 0], X[:, 1], c=cluster_labels, cmap='viridis')

for i, (xi, yi) in enumerate(X):
    plt.annotate(f'Point {i+1}', (xi, yi), xytext=(5, 5), textcoords='offset points',
                 fontsize=8, alpha=0.7)

for i, center in enumerate(kmeans.cluster_centers_):
    plt.annotate(f'Cluster {i+1}', center, xytext=(0, 0), textcoords='offset points',
                 fontsize=12, fontweight='bold', ha='center', va='center',
                 bbox=dict(facecolor='white', edgecolor='black', alpha=0.8))

plt.title('Clustering and Labeling with Matplotlib Scatter - how2matplotlib.com')
plt.xlabel('X-axis')
plt.ylabel('Y-axis')
plt.colorbar(scatter, label='Cluster')
plt.show()
Output:
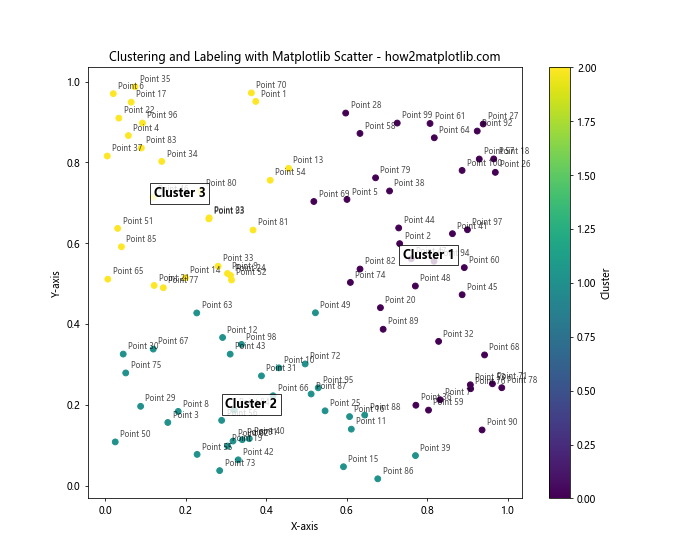
This example demonstrates how to apply K-means clustering to a dataset and label both individual points and cluster centers.
Outlier Detection and Labeling
You can use outlier detection techniques to identify and label unusual data points in your scatter plot. Here’s an example using the Interquartile Range (IQR) method:
import matplotlib.pyplot as plt
import numpy as np

def detect_outliers(data):
    q1 = np.percentile(data, 25)
    q3 = np.percentile(data, 75)
    iqr = q3 - q1
    lower_bound = q1 - (1.5 * iqr)
    upper_bound = q3 + (1.5 * iqr)
    return (data < lower_bound) | (data > upper_bound)

np.random.seed(42)
x = np.random.normal(0, 1, 100)
y = np.random.normal(0, 1, 100)

x_outliers = detect_outliers(x)
y_outliers = detect_outliers(y)
outliers = x_outliers | y_outliers

plt.figure(figsize=(10, 8))
scatter = plt.scatter(x, y, c=outliers, cmap='coolwarm')

for i, (xi, yi, is_outlier) in enumerate(zip(x, y, outliers)):
    if is_outlier:
        plt.annotate(f'Outlier {i+1}', (xi, yi), xytext=(5, 5), textcoords='offset points',
                     fontsize=8, fontweight='bold', color='red')

plt.title('Outlier Detection and Labeling with Matplotlib Scatter - how2matplotlib.com')
plt.xlabel('X-axis')
plt.ylabel('Y-axis')
plt.colorbar(scatter, label='Outlier')
plt.show()
Output:
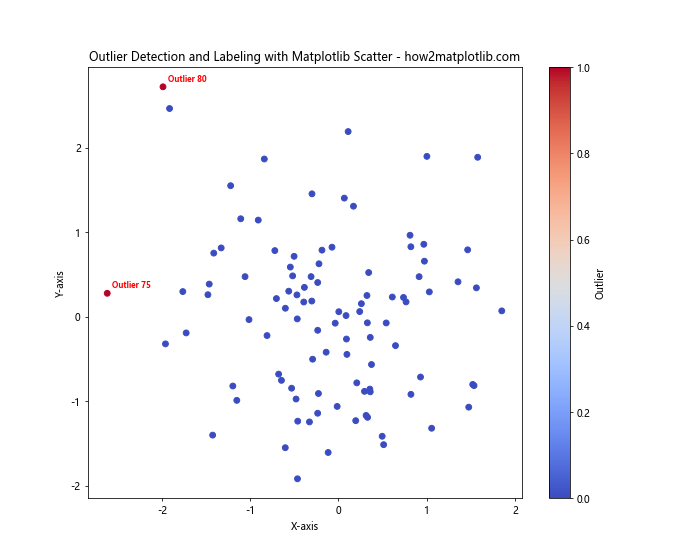
This example shows how to detect outliers using the IQR method and label them in a scatter plot.
Matplotlib scatter label Conclusion
Matplotlib scatter labels are a powerful tool for creating informative and visually appealing data visualizations. By mastering the techniques and best practices outlined in this comprehensive guide, you can create scatter plots that effectively communicate your data insights.
Remember to consider the following key points when working with matplotlib scatter labels:
- Choose appropriate label content and formatting to enhance readability and convey information effectively.
- Use customization options to make your labels stand out and represent additional dimensions of your data.
- Implement techniques to handle overlapping labels and improve the overall appearance of your plot.
- Consider adding interactivity to your scatter plots for a more engaging user experience.
- Combine scatter labels with other plot elements and data analysis techniques to create more comprehensive visualizations.
By applying these principles and exploring the various examples provided in this guide, you’ll be well-equipped to create professional-quality scatter plots with informative labels using matplotlib. Continue to experiment with different techniques and adapt them to your specific data visualization needs to make the most of this powerful tool.