Comprehensive Guide to Using Matplotlib.axis.Tick.get_clip_path() in Python
Matplotlib.axis.Tick.get_clip_path() in Python is an essential method for customizing tick marks in Matplotlib plots. This function allows you to retrieve the clip path associated with a specific tick mark, enabling fine-grained control over the appearance and behavior of your plot’s axis ticks. In this comprehensive guide, we’ll explore the various aspects of Matplotlib.axis.Tick.get_clip_path() in Python, providing detailed explanations and practical examples to help you master this powerful feature.
Understanding Matplotlib.axis.Tick.get_clip_path() in Python
Matplotlib.axis.Tick.get_clip_path() in Python is a method that belongs to the Tick class in Matplotlib’s axis module. This function is used to obtain the clip path associated with a particular tick mark. A clip path defines the region where the tick mark is visible, effectively controlling its shape and extent.
To better understand how Matplotlib.axis.Tick.get_clip_path() in Python works, let’s start with a simple example:
import matplotlib.pyplot as plt
import numpy as np

# Create a sample plot
fig, ax = plt.subplots()
x = np.linspace(0, 10, 100)
y = np.sin(x)
ax.plot(x, y, label='Sine wave')

# Get the first x-axis tick
tick = ax.xaxis.get_major_ticks()[0]

# Get the clip path of the tick
clip_path = tick.get_clip_path()

print(f"Clip path: {clip_path}")

plt.title('How to use Matplotlib.axis.Tick.get_clip_path() - how2matplotlib.com')
plt.legend()
plt.show()
Output:
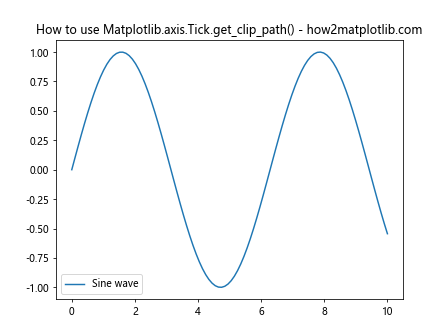
In this example, we create a simple sine wave plot and retrieve the clip path of the first major tick on the x-axis using Matplotlib.axis.Tick.get_clip_path() in Python. The clip path is then printed to the console.
Exploring the Return Value of Matplotlib.axis.Tick.get_clip_path() in Python
When you call Matplotlib.axis.Tick.get_clip_path() in Python, it returns a Path object or None. The Path object represents the clip path associated with the tick mark. If no clip path is set, the method returns None.
Let’s examine the return value more closely:
import matplotlib.pyplot as plt
import numpy as np

fig, ax = plt.subplots()
x = np.linspace(0, 10, 100)
y = np.cos(x)
ax.plot(x, y, label='Cosine wave')

tick = ax.yaxis.get_major_ticks()[0]
clip_path = tick.get_clip_path()

if clip_path is None:
    print("No clip path is set for this tick.")
else:
    print(f"Clip path vertices: {clip_path.vertices}")
    print(f"Clip path codes: {clip_path.codes}")

plt.title('Exploring Matplotlib.axis.Tick.get_clip_path() - how2matplotlib.com')
plt.legend()
plt.show()
Output:
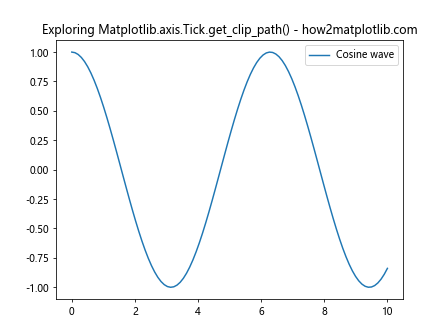
In this example, we retrieve the clip path of the first major tick on the y-axis and examine its properties. If a clip path is set, we print its vertices and codes, which define the shape of the path.
Setting Custom Clip Paths with Matplotlib.axis.Tick.set_clip_path() in Python
While Matplotlib.axis.Tick.get_clip_path() in Python allows you to retrieve the clip path, you can also set custom clip paths using the set_clip_path() method. This can be useful for creating unique tick mark shapes or limiting their visibility.
Here’s an example of setting a custom clip path:
import matplotlib.pyplot as plt
import matplotlib.patches as patches
import numpy as np

fig, ax = plt.subplots()
x = np.linspace(0, 10, 100)
y = np.tan(x)
ax.plot(x, y, label='Tangent wave')

# Create a custom clip path (a circle)
circle = patches.Circle((0, 0), radius=0.1, transform=ax.transAxes)

# Set the clip path for the first x-axis tick
tick = ax.xaxis.get_major_ticks()[0]
tick.set_clip_path(circle)

# Verify the clip path
clip_path = tick.get_clip_path()
print(f"Custom clip path set: {clip_path}")

plt.title('Custom Clip Path with Matplotlib.axis.Tick.get_clip_path() - how2matplotlib.com')
plt.legend()
plt.show()
Output:
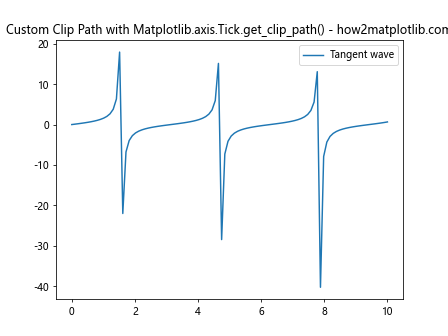
In this example, we create a circular clip path and apply it to the first x-axis tick using set_clip_path(). We then use Matplotlib.axis.Tick.get_clip_path() in Python to verify that the custom clip path has been set correctly.
Practical Applications of Matplotlib.axis.Tick.get_clip_path() in Python
Matplotlib.axis.Tick.get_clip_path() in Python has several practical applications in data visualization. Let’s explore some of these use cases:
1. Customizing Tick Mark Appearance
By manipulating the clip path, you can create unique tick mark shapes:
import matplotlib.pyplot as plt
import matplotlib.patches as patches
import numpy as np

fig, ax = plt.subplots()
x = np.linspace(0, 10, 100)
y = np.exp(x)
ax.plot(x, y, label='Exponential')

# Create a custom triangular clip path
triangle = patches.RegularPolygon((0, 0), 3, radius=0.1, transform=ax.transAxes)

# Apply the custom clip path to all x-axis ticks
for tick in ax.xaxis.get_major_ticks():
    tick.set_clip_path(triangle)

# Verify the clip paths
for i, tick in enumerate(ax.xaxis.get_major_ticks()):
    clip_path = tick.get_clip_path()
    print(f"Tick {i} clip path: {clip_path}")

plt.title('Custom Tick Shapes with Matplotlib.axis.Tick.get_clip_path() - how2matplotlib.com')
plt.legend()
plt.show()
Output:
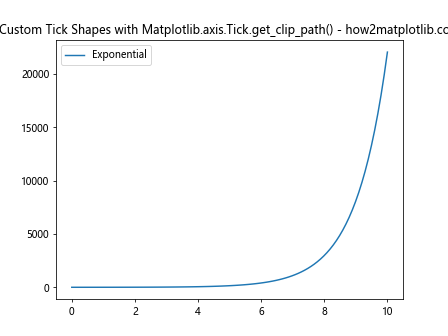
This example creates triangular tick marks by setting a custom clip path for each x-axis tick. We then use Matplotlib.axis.Tick.get_clip_path() in Python to verify that the clip paths have been applied correctly.
2. Limiting Tick Visibility
You can use clip paths to limit the visibility of tick marks in certain regions of the plot:
import matplotlib.pyplot as plt
import matplotlib.patches as patches
import numpy as np

fig, ax = plt.subplots()
x = np.linspace(0, 10, 100)
y = np.log(x)
ax.plot(x, y, label='Logarithmic')

# Create a rectangular clip path for the left half of the plot
rect = patches.Rectangle((0, 0), 0.5, 1, transform=ax.transAxes)

# Apply the clip path to all y-axis ticks
for tick in ax.yaxis.get_major_ticks():
    tick.set_clip_path(rect)

# Verify the clip paths
for i, tick in enumerate(ax.yaxis.get_major_ticks()):
    clip_path = tick.get_clip_path()
    print(f"Y-axis tick {i} clip path: {clip_path}")

plt.title('Limited Tick Visibility with Matplotlib.axis.Tick.get_clip_path() - how2matplotlib.com')
plt.legend()
plt.show()
Output:
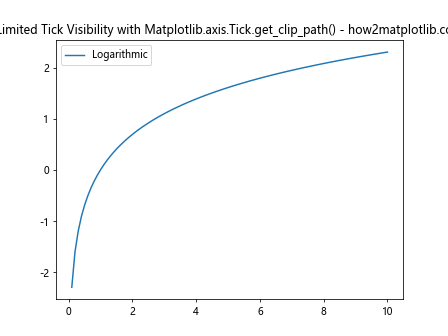
In this example, we create a rectangular clip path that covers only the left half of the plot. By applying this clip path to all y-axis ticks, we limit their visibility to the left side of the plot. Matplotlib.axis.Tick.get_clip_path() in Python is used to confirm that the clip paths have been set correctly.
Advanced Techniques with Matplotlib.axis.Tick.get_clip_path() in Python
Now that we’ve covered the basics, let’s explore some advanced techniques using Matplotlib.axis.Tick.get_clip_path() in Python:
1. Dynamic Clip Paths
You can create dynamic clip paths that change based on data or user interaction:
import matplotlib.pyplot as plt
import matplotlib.patches as patches
import numpy as np

fig, ax = plt.subplots()
x = np.linspace(0, 10, 100)
y = np.sin(x) * np.exp(-0.1 * x)
line, = ax.plot(x, y, label='Damped sine wave')

def update_clip_paths(event):
    if event.inaxes == ax:
        # Create a circular clip path centered on the mouse position
        circle = patches.Circle((event.xdata, event.ydata), radius=0.5)

        # Apply the clip path to all ticks
        for tick in ax.xaxis.get_major_ticks() + ax.yaxis.get_major_ticks():
            tick.set_clip_path(circle)

        # Verify the clip paths
        for i, tick in enumerate(ax.xaxis.get_major_ticks()):
            clip_path = tick.get_clip_path()
            print(f"X-axis tick {i} clip path: {clip_path}")

        fig.canvas.draw_idle()

fig.canvas.mpl_connect('motion_notify_event', update_clip_paths)

plt.title('Dynamic Clip Paths with Matplotlib.axis.Tick.get_clip_path() - how2matplotlib.com')
plt.legend()
plt.show()
Output:
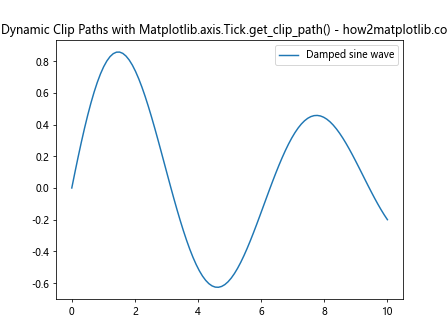
This example creates a dynamic clip path that follows the mouse cursor. As the user moves the mouse over the plot, the clip path is updated, and Matplotlib.axis.Tick.get_clip_path() in Python is used to verify the changes.
Troubleshooting Common Issues with Matplotlib.axis.Tick.get_clip_path() in Python
When working with Matplotlib.axis.Tick.get_clip_path() in Python, you may encounter some common issues. Here are some troubleshooting tips:
- Clip path not visible: If your custom clip path is not visible, ensure that it’s properly positioned and sized relative to the plot axes.
Unexpected tick behavior: If ticks are not behaving as expected after setting a clip path, check if other tick properties (e.g., visibility, size) are conflicting with the clip path.
Performance issues: If your plot becomes slow after applying clip paths, consider simplifying the paths or applying them to fewer ticks.
Let’s look at an example that addresses these common issues: