Comprehensive Guide to Using Matplotlib.axis.Tick.get_animated() in Python
Matplotlib.axis.Tick.get_animated() in Python is an essential method for managing animations in Matplotlib plots. This function is part of the Matplotlib library, which is widely used for creating static, animated, and interactive visualizations in Python. In this comprehensive guide, we’ll explore the ins and outs of Matplotlib.axis.Tick.get_animated(), its usage, and how it can enhance your data visualization projects.
Understanding Matplotlib.axis.Tick.get_animated() in Python
Matplotlib.axis.Tick.get_animated() is a method that belongs to the Tick class in Matplotlib’s axis module. This function is used to retrieve the animation state of a tick object. When working with animated plots in Matplotlib, understanding how to use Matplotlib.axis.Tick.get_animated() can be crucial for creating dynamic and interactive visualizations.
Let’s start with a simple example to demonstrate how to use Matplotlib.axis.Tick.get_animated():
import matplotlib.pyplot as plt

# Create a figure and axis
fig, ax = plt.subplots()

# Plot some data
ax.plot([1, 2, 3, 4], [1, 4, 2, 3], label='Data from how2matplotlib.com')

# Get the x-axis ticks
x_ticks = ax.get_xticks()

# Check the animation state of the first x-axis tick
first_tick = ax.xaxis.get_major_ticks()[0]
is_animated = first_tick.get_animated()

print(f"Is the first x-axis tick animated? {is_animated}")

plt.legend()
plt.show()
Output:
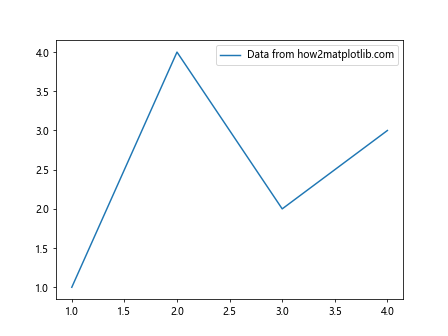
In this example, we create a simple line plot and then use Matplotlib.axis.Tick.get_animated() to check if the first x-axis tick is animated. By default, ticks are not animated, so the output will be False.
The Importance of Matplotlib.axis.Tick.get_animated() in Python
Matplotlib.axis.Tick.get_animated() plays a crucial role in managing animations in Matplotlib. When creating animated plots, you may want to control which elements of the plot are updated in each frame. By using Matplotlib.axis.Tick.get_animated(), you can determine whether a specific tick should be included in the animation updates.
Here’s an example that demonstrates the importance of Matplotlib.axis.Tick.get_animated():
import matplotlib.pyplot as plt
import matplotlib.animation as animation
import numpy as np

# Create a figure and axis
fig, ax = plt.subplots()

# Create an initial line plot
x = np.linspace(0, 2*np.pi, 100)
line, = ax.plot(x, np.sin(x), label='Sine wave from how2matplotlib.com')

# Function to update the plot
def update(frame):
    line.set_ydata(np.sin(x + frame/10))
    return line,

# Create the animation
ani = animation.FuncAnimation(fig, update, frames=100, interval=50, blit=True)

# Check if the x-axis ticks are animated
for tick in ax.xaxis.get_major_ticks():
    print(f"Tick at {tick.get_loc()} is animated: {tick.get_animated()}")

plt.legend()
plt.show()
Output:
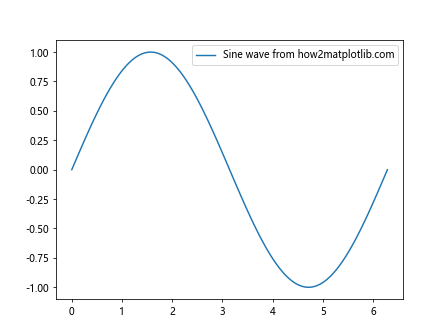
In this example, we create an animated sine wave plot. We then use Matplotlib.axis.Tick.get_animated() to check if each x-axis tick is animated. By default, they are not animated, which means they won’t be updated in each frame of the animation.
Setting up Matplotlib.axis.Tick.get_animated() in Python
To fully utilize Matplotlib.axis.Tick.get_animated(), it’s important to understand how to set up and configure tick animations. While Matplotlib.axis.Tick.get_animated() retrieves the animation state, you can use the corresponding set_animated() method to control whether a tick should be animated.
Here’s an example that demonstrates how to set up and use Matplotlib.axis.Tick.get_animated():
import matplotlib.pyplot as plt
import numpy as np

# Create a figure and axis
fig, ax = plt.subplots()

# Plot some data
x = np.linspace(0, 10, 100)
ax.plot(x, np.sin(x), label='Sine wave from how2matplotlib.com')

# Get the x-axis ticks
x_ticks = ax.xaxis.get_major_ticks()

# Animate every other tick
for i, tick in enumerate(x_ticks):
    if i % 2 == 0:
        tick.set_animated(True)

# Check the animation state of all ticks
for i, tick in enumerate(x_ticks):
    is_animated = tick.get_animated()
    print(f"Tick {i} is animated: {is_animated}")

plt.legend()
plt.show()
Output:
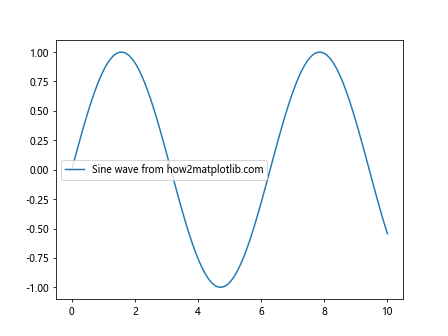
In this example, we set every other x-axis tick to be animated using set_animated(True). We then use Matplotlib.axis.Tick.get_animated() to verify the animation state of each tick.
Advanced Usage of Matplotlib.axis.Tick.get_animated() in Python
Matplotlib.axis.Tick.get_animated() can be particularly useful in more complex scenarios, such as creating custom animations or interactive plots. Let’s explore some advanced usage examples:
Example 1: Custom Tick Animation
import matplotlib.pyplot as plt
import matplotlib.animation as animation
import numpy as np

# Create a figure and axis
fig, ax = plt.subplots()

# Plot some data
x = np.linspace(0, 10, 100)
line, = ax.plot(x, np.sin(x), label='Sine wave from how2matplotlib.com')

# Get the x-axis ticks
x_ticks = ax.xaxis.get_major_ticks()

# Animate every other tick
for i, tick in enumerate(x_ticks):
    if i % 2 == 0:
        tick.set_animated(True)

# Function to update the plot
def update(frame):
    line.set_ydata(np.sin(x + frame/10))

    # Update only the animated ticks
    for tick in x_ticks:
        if tick.get_animated():
            tick.label1.set_rotation(frame % 360)

    return line, *[tick.label1 for tick in x_ticks if tick.get_animated()]

# Create the animation
ani = animation.FuncAnimation(fig, update, frames=360, interval=50, blit=True)

plt.legend()
plt.show()
Output:
In this advanced example, we create a custom animation where the sine wave is animated, and every other x-axis tick label rotates. We use Matplotlib.axis.Tick.get_animated() to determine which ticks should be updated in each frame.
Example 2: Interactive Tick Highlighting
import matplotlib.pyplot as plt
import numpy as np

# Create a figure and axis
fig, ax = plt.subplots()

# Plot some data
x = np.linspace(0, 10, 100)
ax.plot(x, np.sin(x), label='Sine wave from how2matplotlib.com')

# Get the x-axis ticks
x_ticks = ax.xaxis.get_major_ticks()

# Function to highlight a tick
def highlight_tick(event):
    if event.inaxes == ax:
        for tick in x_ticks:
            if abs(tick.get_loc() - event.xdata) < 0.5:
                tick.label1.set_color('red')
                tick.set_animated(True)
            else:
                tick.label1.set_color('black')
                tick.set_animated(False)

        fig.canvas.draw()

# Connect the event to the figure
fig.canvas.mpl_connect('motion_notify_event', highlight_tick)

plt.legend()
plt.show()
Output:
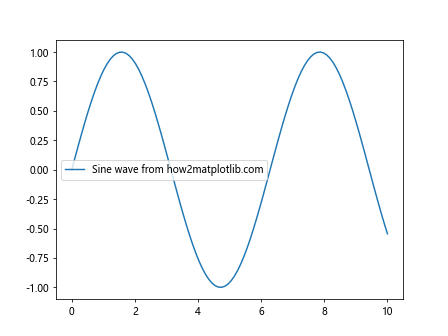
In this interactive example, we use Matplotlib.axis.Tick.get_animated() as part of a mouse hover effect. When the mouse moves over a tick, it's highlighted and set to be animated. This demonstrates how Matplotlib.axis.Tick.get_animated() can be used in conjunction with user interactions.
Best Practices for Using Matplotlib.axis.Tick.get_animated() in Python
When working with Matplotlib.axis.Tick.get_animated(), it's important to follow some best practices to ensure efficient and effective use of the function:
- Use Matplotlib.axis.Tick.get_animated() sparingly: Checking the animation state of ticks should be done only when necessary, as frequent checks can impact performance.
Combine with set_animated(): Always use Matplotlib.axis.Tick.get_animated() in conjunction with set_animated() to manage the animation state of ticks effectively.
Consider performance: When animating ticks, be mindful of the number of ticks you're animating, as animating too many elements can slow down your visualization.
Use with blit=True: When creating animations, use blit=True in FuncAnimation and only update the necessary elements to improve performance.
Here's an example that demonstrates these best practices: