How to Master Matplotlib Scatter Marker Styles: A Comprehensive Guide
Matplotlib scatter marker styles are an essential aspect of data visualization in Python. This comprehensive guide will explore the various marker styles available in Matplotlib’s scatter plots, demonstrating how to effectively use them to enhance your data representations. We’ll cover everything from basic marker shapes to customized markers, providing detailed examples and explanations along the way.
Understanding Matplotlib Scatter Marker Styles
Matplotlib scatter marker styles refer to the various shapes and symbols used to represent individual data points in a scatter plot. These markers play a crucial role in distinguishing between different data sets, highlighting specific points, and improving the overall readability of your visualizations.
Let’s start with a basic example of using matplotlib scatter marker styles:
import matplotlib.pyplot as plt
import numpy as np

x = np.random.rand(50)
y = np.random.rand(50)

plt.figure(figsize=(8, 6))
plt.scatter(x, y, marker='o', label='how2matplotlib.com')
plt.title('Basic Scatter Plot with Circular Markers')
plt.xlabel('X-axis')
plt.ylabel('Y-axis')
plt.legend()
plt.show()
Output:
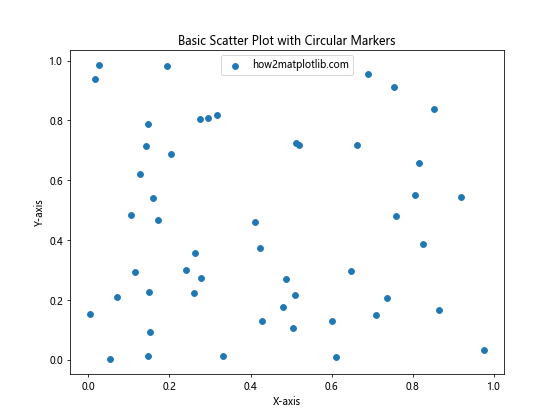
In this example, we create a simple scatter plot using circular markers (‘o’). The marker parameter in the plt.scatter() function is where we specify the matplotlib scatter marker style.
Common Matplotlib Scatter Marker Styles
Matplotlib offers a wide range of predefined marker styles. Let’s explore some of the most commonly used ones:
- Point markers:
- ‘.’ (point)
- ‘,’ (pixel)
- Standard markers:
- ‘o’ (circle)
- ‘s’ (square)
- ‘^’ (triangle up)
- ‘v’ (triangle down)
- ‘<' (triangle left)
- ‘>’ (triangle right)
- ‘D’ (diamond)
- ‘p’ (pentagon)
- ‘h’ (hexagon)
- Star markers:
- ‘*’ (star)
- ‘8’ (octagon)
- Special markers:
- ‘+’ (plus)
- ‘x’ (x)
- ‘d’ (thin diamond)
Let’s create a plot showcasing these matplotlib scatter marker styles:
import matplotlib.pyplot as plt
import numpy as np

markers = ['.', ',', 'o', 's', '^', 'v', '<', '>', 'D', 'p', 'h', '*', '8', '+', 'x', 'd']
x = np.arange(len(markers))
y = np.random.rand(len(markers))

plt.figure(figsize=(12, 8))
for i, marker in enumerate(markers):
    plt.scatter(x[i], y[i], marker=marker, s=200, label=f'{marker} - how2matplotlib.com')

plt.title('Common Matplotlib Scatter Marker Styles')
plt.xlabel('X-axis')
plt.ylabel('Y-axis')
plt.legend(ncol=4, loc='upper center', bbox_to_anchor=(0.5, -0.15))
plt.tight_layout()
plt.show()
Output:
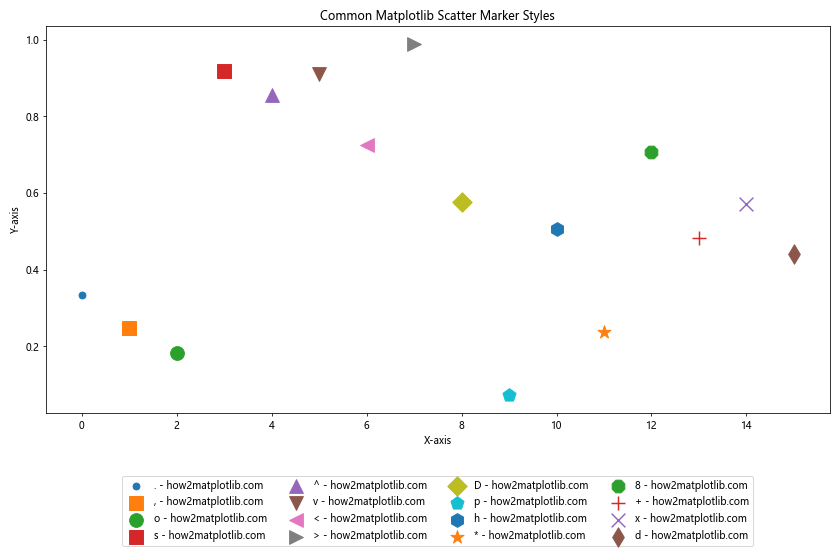
This example demonstrates various matplotlib scatter marker styles in a single plot. Each marker is labeled for easy identification.
Customizing Marker Size and Color
In addition to choosing the marker style, you can also customize the size and color of the markers to further enhance your scatter plots. Let’s explore how to do this:
import matplotlib.pyplot as plt
import numpy as np

x = np.random.rand(50)
y = np.random.rand(50)
colors = np.random.rand(50)
sizes = 1000 * np.random.rand(50)

plt.figure(figsize=(10, 8))
scatter = plt.scatter(x, y, c=colors, s=sizes, alpha=0.6, marker='o')
plt.colorbar(scatter)
plt.title('Customized Marker Size and Color - how2matplotlib.com')
plt.xlabel('X-axis')
plt.ylabel('Y-axis')
plt.show()
Output:
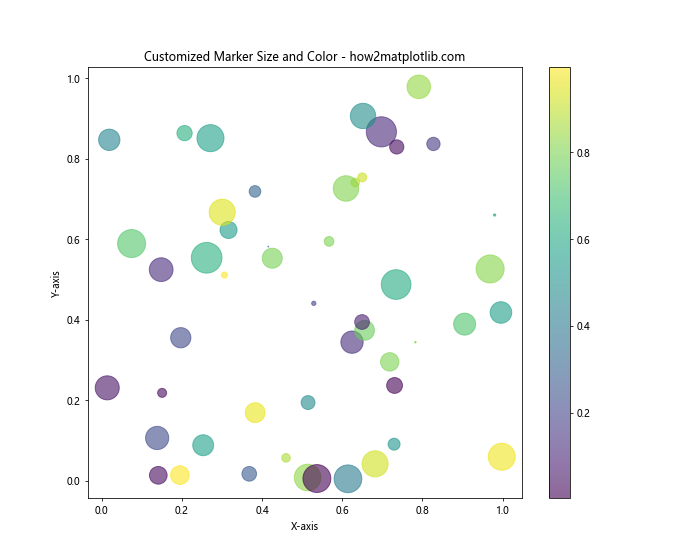
In this example, we use the c parameter to set the color of each marker based on a color array, and the s parameter to set the size of each marker. The alpha parameter controls the transparency of the markers.
Using Multiple Marker Styles in One Plot
Sometimes, you may want to use different matplotlib scatter marker styles within the same plot to distinguish between different data sets or categories. Here’s how you can achieve this:
import matplotlib.pyplot as plt
import numpy as np

np.random.seed(42)
x1 = np.random.rand(30)
y1 = np.random.rand(30)
x2 = np.random.rand(30)
y2 = np.random.rand(30)
x3 = np.random.rand(30)
y3 = np.random.rand(30)

plt.figure(figsize=(10, 8))
plt.scatter(x1, y1, marker='o', label='Dataset 1 - how2matplotlib.com', s=100)
plt.scatter(x2, y2, marker='^', label='Dataset 2 - how2matplotlib.com', s=100)
plt.scatter(x3, y3, marker='s', label='Dataset 3 - how2matplotlib.com', s=100)

plt.title('Multiple Marker Styles in One Plot')
plt.xlabel('X-axis')
plt.ylabel('Y-axis')
plt.legend()
plt.show()
Output:
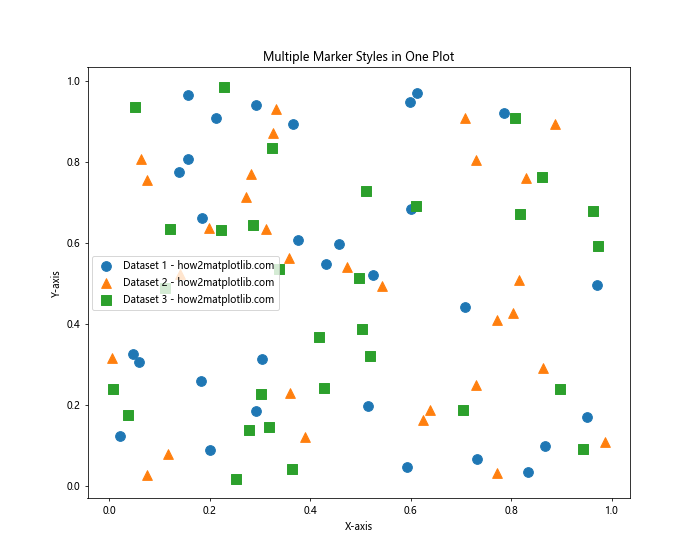
This example demonstrates how to use different matplotlib scatter marker styles for three distinct datasets within the same plot.
Creating Custom Markers
While Matplotlib provides a wide range of predefined marker styles, you can also create custom markers to suit your specific needs. Let’s explore a few ways to create custom markers:
Using Path Objects
You can create custom markers using Path objects from Matplotlib’s path module:
import matplotlib.pyplot as plt
import numpy as np
from matplotlib.path import Path

# Define custom marker
verts = [
    (0., -1.),  # left
    (0.5, 0.),  # top
    (1., -1.),  # right
    (0., 0.),  # center
    (0., -1.),  # back to left
]
codes = [Path.MOVETO, Path.LINETO, Path.LINETO, Path.LINETO, Path.CLOSEPOLY]
custom_marker = Path(verts, codes)

x = np.random.rand(50)
y = np.random.rand(50)

plt.figure(figsize=(8, 6))
plt.scatter(x, y, marker=custom_marker, s=200, label='Custom Marker - how2matplotlib.com')
plt.title('Scatter Plot with Custom Marker')
plt.xlabel('X-axis')
plt.ylabel('Y-axis')
plt.legend()
plt.show()
Output:
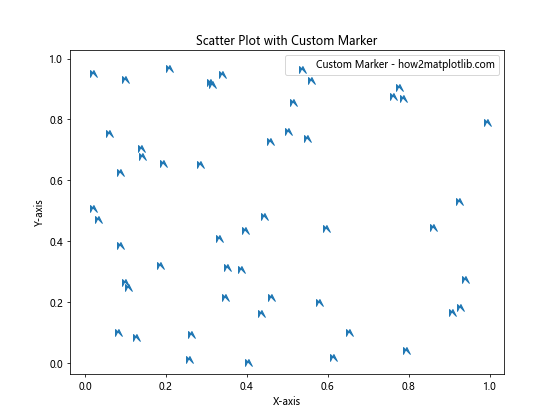
This example creates a custom arrow-like marker using a Path object.
Using Unicode Characters
Another way to create custom markers is by using Unicode characters:
import matplotlib.pyplot as plt
import numpy as np

x = np.random.rand(50)
y = np.random.rand(50)

plt.figure(figsize=(10, 8))
plt.scatter(x, y, marker='$\u2665$', s=200, color='red', label='Heart - how2matplotlib.com')
plt.scatter(x + 0.1, y + 0.1, marker='$\u2660$', s=200, color='black', label='Spade - how2matplotlib.com')
plt.title('Scatter Plot with Unicode Markers')
plt.xlabel('X-axis')
plt.ylabel('Y-axis')
plt.legend()
plt.show()
Output:
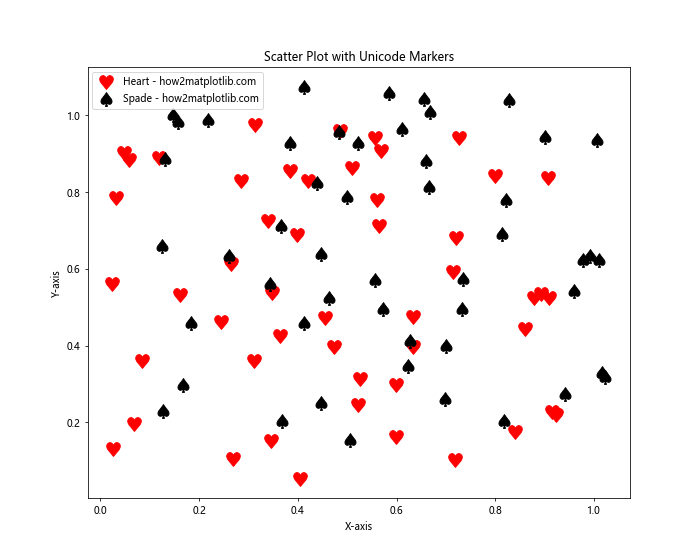
This example uses Unicode characters for heart (♥) and spade (♠) symbols as custom markers.
Marker Fill Styles
Matplotlib scatter marker styles can be further customized using different fill styles. The main fill styles are:
- ‘full’: A filled marker (default)
- ‘none’: An empty marker
- ‘top’, ‘bottom’, ‘left’, ‘right’: Half-filled markers
- ‘top-bottom’, ‘left-right’: Markers filled on opposite sides
Let’s demonstrate these fill styles:
import matplotlib.pyplot as plt
import numpy as np

fill_styles = ['full', 'none', 'top', 'bottom', 'left', 'right', 'top-bottom', 'left-right']
x = np.arange(len(fill_styles))
y = np.ones_like(x)

plt.figure(figsize=(12, 6))
for i, style in enumerate(fill_styles):
    plt.scatter(x[i], y[i], marker='o', s=500, facecolors=style, edgecolors='black', label=f'{style} - how2matplotlib.com')

plt.title('Marker Fill Styles')
plt.xlabel('X-axis')
plt.ylabel('Y-axis')
plt.legend(ncol=4, loc='upper center', bbox_to_anchor=(0.5, -0.15))
plt.ylim(0.5, 1.5)
plt.tight_layout()
plt.show()
This example showcases different fill styles for circular markers.
Combining Marker Styles with Line Plots
Matplotlib scatter marker styles can be effectively combined with line plots to create more informative visualizations. Here’s an example:
import matplotlib.pyplot as plt
import numpy as np

x = np.linspace(0, 10, 50)
y1 = np.sin(x)
y2 = np.cos(x)

plt.figure(figsize=(10, 6))
plt.plot(x, y1, '-o', label='Sine - how2matplotlib.com', markersize=8)
plt.plot(x, y2, '-s', label='Cosine - how2matplotlib.com', markersize=8)
plt.title('Combining Marker Styles with Line Plots')
plt.xlabel('X-axis')
plt.ylabel('Y-axis')
plt.legend()
plt.grid(True)
plt.show()
Output:
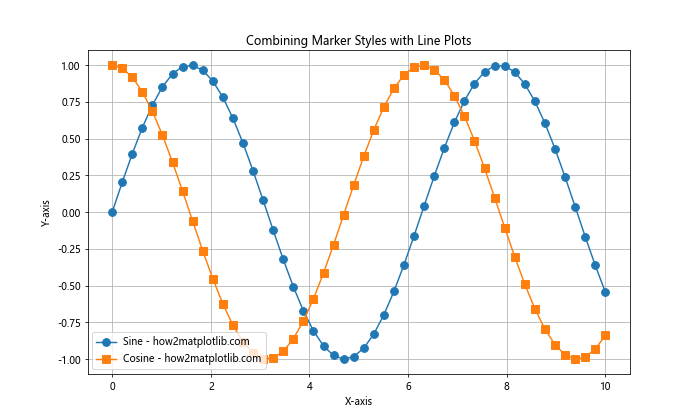
In this example, we use circular markers for the sine wave and square markers for the cosine wave, combined with line plots.
Marker Edge Colors and Widths
You can further customize matplotlib scatter marker styles by adjusting the edge colors and widths:
import matplotlib.pyplot as plt
import numpy as np

x = np.random.rand(50)
y = np.random.rand(50)

plt.figure(figsize=(10, 8))
plt.scatter(x, y, marker='o', s=200, facecolors='none', edgecolors='blue', linewidths=2, label='Blue edge - how2matplotlib.com')
plt.scatter(x + 0.1, y + 0.1, marker='s', s=200, facecolors='red', edgecolors='green', linewidths=3, label='Green edge - how2matplotlib.com')

plt.title('Customizing Marker Edge Colors and Widths')
plt.xlabel('X-axis')
plt.ylabel('Y-axis')
plt.legend()
plt.show()
Output:
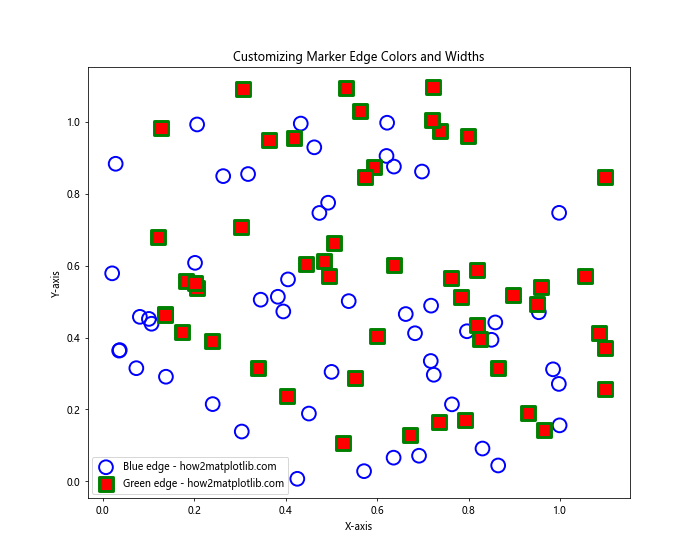
This example demonstrates how to set different edge colors and widths for markers.
Marker Transparency
Adjusting the transparency of markers can be useful when dealing with overlapping data points:
import matplotlib.pyplot as plt
import numpy as np

x = np.random.normal(0, 1, 1000)
y = np.random.normal(0, 1, 1000)

plt.figure(figsize=(10, 8))
plt.scatter(x, y, alpha=0.5, s=50, label='Transparent markers - how2matplotlib.com')
plt.title('Scatter Plot with Transparent Markers')
plt.xlabel('X-axis')
plt.ylabel('Y-axis')
plt.legend()
plt.show()
Output:
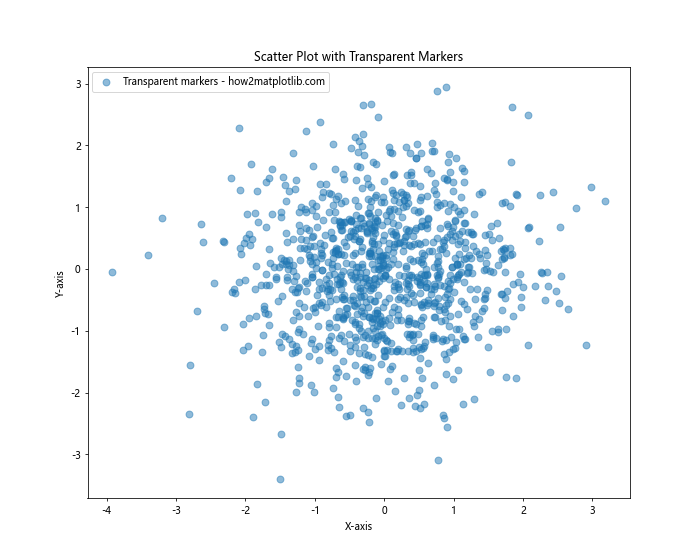
In this example, we set the alpha parameter to 0.5 to make the markers semi-transparent.
Marker Rotation
Some matplotlib scatter marker styles can be rotated to create interesting effects:
import matplotlib.pyplot as plt
import numpy as np

x = np.random.rand(50)
y = np.random.rand(50)
angles = np.random.randint(0, 360, 50)

plt.figure(figsize=(10, 8))
for i in range(len(x)):
    plt.scatter(x[i], y[i], marker=(3, 0, angles[i]), s=200, label='Rotated triangle' if i == 0 else "")

plt.title('Scatter Plot with Rotated Markers - how2matplotlib.com')
plt.xlabel('X-axis')
plt.ylabel('Y-axis')
plt.legend()
plt.show()
Output:
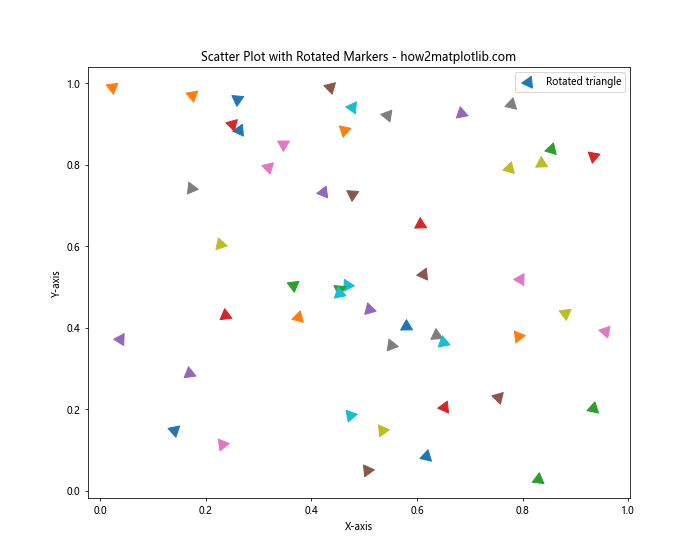
This example demonstrates how to rotate triangle markers by specifying the number of vertices (3), the starting angle (0), and a rotation angle for each marker.
Combining Multiple Customizations
Let’s create a more complex example that combines various matplotlib scatter marker styles and customizations:
import matplotlib.pyplot as plt
import numpy as np

np.random.seed(42)
x = np.random.rand(100)
y = np.random.rand(100)
colors = np.random.rand(100)
sizes = 1000 * np.random.rand(100)

plt.figure(figsize=(12, 10))

# Group 1: Circular markers with varying sizes and colors
scatter1 = plt.scatter(x[:30], y[:30], c=colors[:30], s=sizes[:30], alpha=0.6, marker='o', label='Group 1 - how2matplotlib.com')

# Group 2: Square markers with fixed size and color
plt.scatter(x[30:60], y[30:60], color='red', s=100, marker='s', label='Group 2 - how2matplotlib.com')

# Group 3: Triangle markers with varying sizes and fixed color
plt.scatter(x[60:90], y[60:90], color='green', s=sizes[60:90], marker='^', label='Group 3 - how2matplotlib.com')

# Group 4: Custom star markers
plt.scatter(x[90:], y[90:], marker='*', s=200, color='purple', label='Group 4 - how2matplotlib.com')

plt.colorbar(scatter1, label='Color scale for Group 1')
plt.title('Complex Scatter Plot with Various Marker Styles and Customizations')
plt.xlabel('X-axis')
plt.ylabel('Y-axis')
plt.legend()
plt.show()
Output:
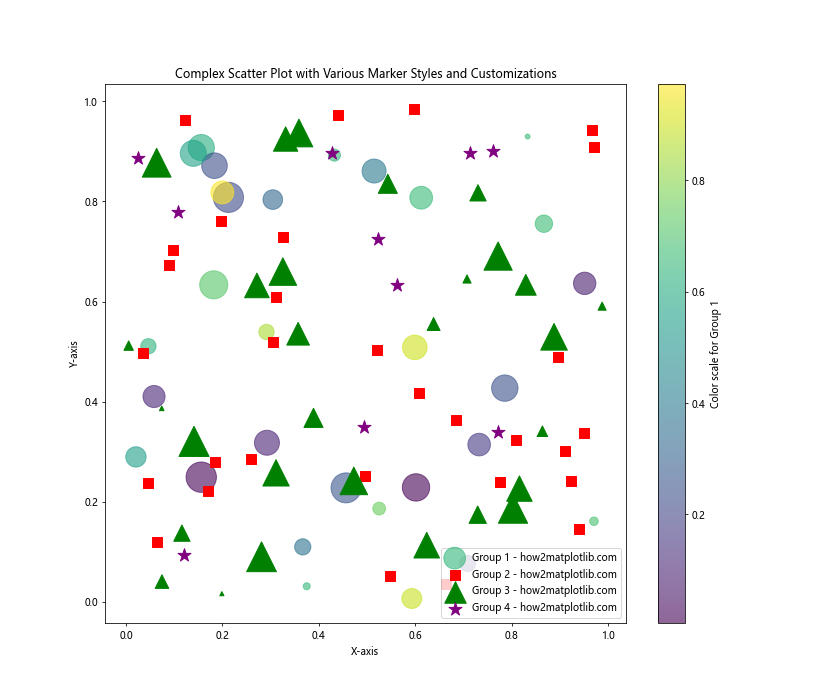
This example showcases a complex scatter plot with different marker styles, sizes, colors, and customizations for different groups of data points.
Matplotlib scatter marker styles Conclusion
Mastering matplotlib scatter marker styles is crucial for creating effective and visually appealing data visualizations. This comprehensive guide has covered a wide range of topics, from basic marker shapes to advanced customizations. By understanding and applying these concepts, you can significantly enhance your scatter plots and make your data more engaging and informative.
Remember that the key to creating great visualizations is experimentation and practice. Don’t hesitate to mix and match different matplotlib scatter marker styles and customizations to find the perfect combination for your specific data and audience.
As you continue to work with Matplotlib, you’ll discover even more ways to refine your scatter plots and other visualizations. Keep exploring, and don’t forget to refer back to this guide whenever you need inspiration or a refresher on matplotlib scatter marker styles.